
Abstract
Aggregate survey responses collected from students are commonly used by universities to compare effective educational practices across program majors, and to make high-stakes decisions about the effectiveness of programs. Yet if there is too much heterogeneity among student responses within programs, the program-level averages may not appropriately represent student-level outcomes, and any decisions made based on these averages may be erroneous. Findings revealed that survey items regarding students’ perceived general learning outcomes could be appropriately aggregated to the program level for 4th-year students in the study but not for 1st-year students. Survey items concerning the learning environment were not valid for either group when aggregated to the program level. This study demonstrates the importance of considering the multilevel nature of survey results and determining the multilevel validity of program-level interpretations prior to making any conclusions based on aggregate student responses. Implications for institutional effectiveness research are discussed.
Although direct measures of student learning, such as examinations or rubrics to measure student competency levels, are the preferred approach used to assess student learning (Banta, 2007), indirect measures, such as student surveys of perceptions of learning outcomes, are a common approach used by institutional effectiveness researchers in Canada and internationally to solicit feedback from students. Surveys are a popular approach in higher education because they can include questions regarding student perceptions of their learning outcomes, together with questions regarding their perceptions about how well university practices contribute to learning (Barr & Tagg, 1995; Chatman, 2007; Pike, 2011). The National Survey of Student Engagement (NSSE; Kuh, 2009) is a recognized example of a survey measure that is used to examine student engagement in learning and how the institution allocates its resources and organizes the curriculum to support student learning. Students in their 1st and 4th year (e.g., senior students) of their postsecondary studies are invited to participate in the NSSE. Institutions can choose to provide a random selection of 1st- and 4th-year students to include in the sample or invite all 1st- and 4th-year students to participate using a census approach.
Determining Program-Level Effectiveness
In Canada, information regarding student learning outcomes at the program level has been particularly pertinent in fulfilling program accreditation requirements and informing academic program reviews. Most commonly, students’ feedback about their learning and their learning environment is often collected using surveys during their 1st and 4th years of postsecondary studies (NSSE, 2011a). The information collected from these surveys is used to inform how well students are transitioning in their 1st-year studies and then what they have learned as a result of being at the institution for 4 years as graduating students (Organisation for Economic Co-operation and Development [OECD], 2013). As part of the standards in the accreditation and academic review processes, there has been a recent emphasis on reporting student learning outcomes that can be attributed to the quality of the program (Ewell, 2008).
Aggregate composite ratings based on student survey results are commonly used in Canada and the United States to compare effective educational practices across major fields of study, such as psychology, mathematics, and sociology, within a university and between the same majors across universities (Chatman, 2009; Nelson Laird, Shoup & Kuh, 2005). Results from these surveys are used to inform high-stakes decisions in determining program effectiveness, indicating areas for improvement, and are provided in support of program accreditation. Accurate interpretation of results from these surveys is important to inform effective educational practices and high-stakes decisions. Of particular concern is that although the outcome data are collected from students, results are typically interpreted at the program or university level. Given the nested nature of data from institutional surveys—student, program, faculty, and institution levels—results can be best examined from a multilevel perspective that takes into account the issue of heterogeneity across programs and institutions in interpreting results (Liu, 2011; Porter, 2005).
Study Purpose
This article aims to contribute to the national and international discussions about the complexity in measuring student general learning outcomes in higher education, specifically with respect to using aggregate survey results as program-level outcomes. The proponents of these surveys and other similar surveys argue that the results are appropriate for diagnostic purposes to inform educational improvement efforts within universities by comparing survey results across program majors within and among institutions (NSSE, 2011b). When the intent is to interpret aggregated survey results rather than the individual student responses, multilevel validity evidence is required to support interpretations made from the higher level of analysis. If there is too much heterogeneity across the levels of analysis, perhaps due to diversity in student responses, diversity in size of the programs, or instructional approaches, the within-level structure may be distorted and interpretations at the higher level of aggregation may be more problematic to interpret, which may not allow for meaningful conclusions to be derived from the data. In such instances, interpretations of program-level decisions across university programs may not be appropriate or meaningful (Hubley & Zumbo, 2011; Zumbo & Forer, 2011; Zumbo, Liu, Wu, Forer & Shear, 2010). Despite the recurrent use of these surveys, researchers have neglected to examine the appropriateness of aggregation. The issues of heterogeneity and aggregation are important for understanding how to summarize and apply student survey results that are suitable for informing program-level decision making, accountability, and improvement efforts.
Measuring Student General Learning Outcomes
Learning outcomes in higher education are indicators of what a student is expected to know, understand, and demonstrate at the end of a period of learning (Adam, 2008; OECD, 2013). Until recently, institutions relied on traditional ideals of quality, characterized by resource- and reputation-outcome indicators, such as student-to-faculty ratios and labor market outcomes. These types of indicators have resulted in limited information about institutional accountability for student learning (Brint & Cantwell, 2011; Ewell, 2008; Skolnik, 2010). This gap in our understanding has resulted from the use of traditional approaches to measuring quality in higher education, which has disregarded the influence of the educational context on student performance and instead focused on the impact of student performance on the institution’s reputation.
Although we want students to learn discipline-specific skills, a recent trend has been to measure general learning outcomes at the program or institutional level as a measure of institutional effectiveness (Penn, 2011). General learning outcomes in higher education typically refers to the knowledge and skills graduates need to prepare them for the workplace and society, such as critical thinking, writing, and problem solving, that are not discipline specific but are skills that can be applied across the disciplines (Spelling Commission on the Future of Higher Education, 2006). Measuring learning in higher education, and determining whether students are actually meeting the stated learning outcomes, is a complex process because there is currently little consensus on how to measure student general learning across programs and institutions (Penn, 2011; Porter, 2012).
Conclusions drawn from aggregate student responses to NSSE items were originally expected to provide information about university quality on a national basis and to compare results across institutions; however, the most common institutional use for these surveys has been to provide program-level information regarding student learning outcomes for accreditation and academic program reviews (NSSE, 2011b). The NSSE staff members encourage institutions to use their Major Field Report, which provides aggregate survey results by program major to examine educational patterns across program majors within the university and among equivalent program majors across comparable universities (NSSE, 2011b).
Levels of Analysis and Interpretation
A primary concern for assessing the quality of higher education from aggregate student-level outcomes is determining whether ratings and perceptions collected from individual students reflect attributes at the higher level of aggregation so that interpretations made at this level are meaningful (Griffith, 2002). Borden and Young (2008) emphasized the lack of research available in higher education regarding the claims institutions make on the value they add to student learning outcomes. They argued that evidence in support of interpretation at the aggregate level should demonstrate that the responses of any one student group member should reflect those of other group members. There are two potential threats to validity if a construct loses meaning upon aggregation: atomistic fallacy and ecological fallacy (Bobko, 2001; Dansereau, Cho, & Yammarino, 2006; Forer & Zumbo, 2011; Zumbo & Forer, 2011). An atomistic fallacy refers to inappropriate conclusions made about groups based on individual-level results, whereas an ecological fallacy refers to inappropriate inferences made about individuals based on group-level results (Kim, 2005). If the meaning at the program level is not consistent with the meaning at the student level, then drawing conclusions based on program-level results could lead to making an atomistic fallacy.
D’Haenens, Van Damme, and Onghena (2008) argued that when the researcher does not consider that student perceptions are likely to be dependent on the program they belong to, results can lead to overestimated interitem correlations, or covariances, and biased results. They also acknowledged that some researchers have found that distinct latent factors (e.g., the suggested scales that emerge from the data) differ across the student and group levels. As such, researchers have recently proposed that multilevel approaches should be used that simultaneously include both the student responses and the program-level averages to determine how well aggregate student responses can be interpreted at the higher level, such as the program major level (Muthén & Muthén, 1998–2012). Thus, aggregating student survey responses to the program level should not be assumed appropriate without first determining if the meaning at the student level has been upheld at the program level (Zumbo et al., 2010; Zumbo & Forer, 2011).
Multilevel Validity
In its contemporary use, validity theory is focused on the interpretations or conclusions drawn from the assessment results rather than the actual assessment scores (Kane, 2006; Messick, 1995). The validation process involves first specifying the proposed inferences and assumptions that will be made from the assessment findings and then providing empirical evidence in support of them (Kane, 2006, 2013; Messick, 1995). The Standards for Educational and Psychological Testing (American Educational Research Association, American Psychological Association, & National Council on Measurement in Education, 2014) state that validity has to do with an investigation of threats and biases that can weaken the meaningfulness of the research. Thus, the validation process involves asking questions that may threaten the conclusions drawn and inferences made from the findings to consider alternate answers and to support the claims made through the integration of validity evidence, including values and consequences. Kane (2006, 2013) suggested that the evidence required to justify a proposed interpretation or use of the assessment findings depends primarily on the importance of the decisions made based on these findings. If an explanation makes modest or low-stakes claims, then less evidence would be required than an explanation that makes more ambitious claims. It is from this modern perspective of the validation process that contemporary theorists, such as Zumbo and Forer (2011) and Hubley and Zumbo (2011), proposed an extension to validity theory to include multilevel validity. They argued that empirical evidence is required to support that interpretations of individual results are still meaningful when aggregated to some higher-level unit or grouping.
Method
Sample
All registered 1st- and 4th-year undergraduate students enrolled at two campuses of the University of British Columbia (UBC)—Okanagan and Vancouver—were invited to participate in the online 2011 version of the NSSE. This online survey was available to students for 3 months, from February to April 2011. As an incentive to participate, the names of students who participated in the surveys were entered into a draw for the chance to win one of three travel prizes, one at $500 and two at $250. The overall response rate in completing this survey was 33%.
Program Major Groupings
One of the questions on the NSSE asked students to write in their primary program major and, if applicable, their second program major into an open-text field. On the basis of student responses to this question, the researchers at the Centre for Postsecondary Research, which conducted the survey for UBC, created 85 program major categories. Table 1 reports the count of respondents at each campus who were included in each of these program major categories. For example, students at the Vancouver campus who identified civil engineering as their primary program major were grouped as “civil engineering UBCV,” and students at the Okanagan campus who also identified their program major as civil engineering were grouped as “civil engineering UBCO.”
NSSE Student Respondents by Program Major

Note. NSSE = National Survey of Student Engagement; UBCV = University of British Columbia, Vancouver campus; UBCO = University of British Columbia, Okanagan campus.
Only programs with at least five full-time students responding to the NSSE were included in this study. The final sample consisted of 1,852 1st-year students grouped into 59 program majors and 1,281 4th-year students in 49 program major groupings. The variables gender, international status, and whether a student attended UBC directly from high school (e.g., direct entry status) or transferred to UBC from another higher education institution are reported for the 1st- and 4th-year samples in Table 2, and these variables are compared to the overall population at each campus.
NSSE Final Study Sample Demographics

Note. NSSE = National Survey of Student Engagement.
Measure
The 2011 version of the NSSE was a voluntary 87-item online survey that purports to measure undergraduate student behaviors, attitudes, and perceptions of institutional practices intended to correlate with student learning (Kuh, 2009). It was first piloted in 1999 by the Center for Postsecondary Research at the Indiana University School of Education, and it is typically administered to students enrolled in the 1st and 4th years of their postsecondary studies. The NSSE was originally recognized for producing five benchmarks of effective educational practices, but some users of this information found institutional-level results too general to act upon within a university (NSSE, 2000).
As an alternative to the five benchmarks, Pike (2006b) developed 12 scalelets comprising 49 NSSE items and examined the dependability of group means for assessing student engagement at the university, college, and program levels. Scalelets are composite scores that are created by combining multiple NSSE survey items into a single score based on students’ responses to those survey items. Pike’s scalelets measured deep approaches to learning, satisfaction, gains in general learning, in-class activities, and aspects of the campus environment. Pike (2006a, 2006b) developed these scalelets to respond to the need to have survey data that were more specific at the department level rather than at the university level. On the basis of his findings, he argued that the NSSE scalelets produced dependable group means and provided richer detail than the NSSE benchmarks, which he believed would lead to information for improvement at the program level (Pike, 2006a). The SPSS syntax for determining these scalelets can be found at http://nsse.indiana.edu/html/creating_scales_scalelets_original.cfm, which was made available for institutional researchers using NSSE data to examine the effectiveness of program outcomes.
NSSE Scalelets
Using the SPSS syntax developed by Pike (2006a), 15 questions from the 2011 NSSE were used to create five scalelets for the 1st-year sample and five scalelets for the 4th-year sample: general learning outcomes (four items), overall satisfaction (two items), emphasis on diversity (three items), support for student success (three items), and interpersonal environment (three items) (see Appendix A). Scalelets for each student respondent were created by first transforming all related items to a common scale ranging from 0 to 100 and then summing the transformed ratings across the selected items using an unweighted approach, which means that each survey item used contributed equally in creating the overall scalelet (Comrey & Lee, 1992). These five scalelets were selected in this study to examine how well aggregate ratings of students’ perceived general learning and their perceptions of their learning environment could be used to report on program-level outcomes.
Analytic Procedures
The purpose of this study was to determine the appropriateness of aggregating survey data obtained from individual students to assess program-level characteristics. To do this, a multistep analytic process was followed (Figure 1), which included principal components analysis (PCA), two-level exploratory multilevel factor analysis (MFA), and three statistical approaches to determine the appropriateness of aggregation: ANOVA, the within and between analysis (WABA), and the unconditional multilevel model. Each of these procedures was applied to the 1st- and 4th-year study samples separately.

Overview of analytical procedures used in this study.
PCA
Prior to creating each scalelet, the selected NSSE items were tested to determine if they could be appropriately combined based on student responses (Tabachnick & Fidell, 2001). A PCA was conducted, separately for the 1st- and 4th-year study samples, using student survey responses to determine which linear components exist within the student responses and how the NSSE items contribute to creating the five scalelets (Hair, Anderson, Tatham, & Black, 1998).
Exploratory two-level MFA
A limitation of the PCA approach is that it does not take into consideration the multilevel structure of the data, which is important when the intent is to interpret student responses as program-level outcomes (Van de Vijver & Poortinga, 2002). As such, an MFA was also used in this study, which simultaneously includes both the student responses and the program-level averages to determine how well the items contribute to creating the scalelets that can be interpreted at the program level (Muthén & Muthén, 1998–2012). The between-program group and pooled-within-program group correlation and covariation matrices were calculated, where the pooled-within-program group matrix was based on the individual student deviations from the corresponding program mean (e.g., the mean for psychology UBCV), and the between-program group matrix is based on the program-group deviations from the grand mean (e.g., university mean). The two-level MFAs were conducted separately for the 1st- and 4th-year samples using Mplus Version 7.2 for categorical data (Muthén & Muthén, 1998–2012). The estimation procedure used was weighted least squares estimation with missing data because of its appropriateness for use with ordinal data to determine the scalelets (Brown, 2006). The results of the MFAs were examined using the criteria described by Hu and Bentler (1998), where the acceptable values for the root mean square error of approximation (RMSEA) value and the standardized root mean square residual (SRMR) within and between values were less than or equal to 0.08, and the acceptable values for the comparative fit index (CFI) and the Tucker-Lewis index (TLI) were larger than or equal to 0.95.
ANOVA
The first procedure used in this study to examine the appropriateness of aggregation was the three-step ANOVA approach. This approach was conducted to examine variability across program majors.
Nonindependence. The program major groupings were identified as the independent variable, and the ratings or scalelets used in this study—perceived general learning, overall satisfaction, emphasis on diversity, support for student success, and interpersonal environment—were the dependent variables (Griffith, 2002). If program major membership is related to the dependent variables, such as perceived general learning, then program means should differ, which leads to nonindependence and can be determined by reviewing the intraclass correlation (ICC)(1) values. Using Equation (1) (in Appendix B), the ICC(1) values were calculated to indicate the proportion of variance in the dependent variable that is explained by program major membership (Bliese, 2000). This study applied the criteria suggested by Griffith (2002) of an ICC(1) value greater than 0.12 to determine if variance in the dependent variable is related to program membership. As the program major groupings used in this study for all samples were quite unbalanced in numbers, the harmonic mean was used rather than the arithmetic mean. By using the harmonic mean, less weight was given to programs with extremely large numbers to provide a more appropriate calculation of the average for program groups in this study.
Reliability of program means. The second step in the ANOVA approach is to determine if responses made by students within programs correspond to each other. The program means of perceived general learning may differ, yet students within each program may give very different responses. Bliese (2000) suggested that reliability of program means could be assessed by the ICC(2) values: If they are high, then a single rating from an individual student would be a reliable estimate of the program mean, but if they are low, then multiple student ratings would be necessary to provide reliable estimates of the program mean. Griffith (2002) suggested the use of an ICC(2) value greater than 0.83 to determine acceptable reliability estimates for group means (Equation [2]; Appendix B) (Griffith, 2002; Lüdtke, Robitzsch, Trautwein, & Kunter, 2009).
Within-program agreement. As Griffith (2002) notes, just because the reliability of program means is high, it does not necessarily mean that there are high levels of agreement among students within the program. Within-program agreement is determined by calculating the rwg statistic because although individual student ratings within a program major might correspond to each other, thereby resulting in high reliability estimates, the students may not be in agreement (Griffith, 2002). Griffith provided an example of an individual responding using ratings of 1, 2, and 3 on a 5-point scale, whereas another individual in the same group responded using 3, 4, and 5. This response scenario would result in high reliability because the student ratings would be proportionately consistent, but the within-program agreement would be low because the response of a 3 from the first individual corresponds to a 5 from the second individual. Griffith suggested that researchers use the rwg statistic, calculated using Equations (3a) and (3b) (Appendix B), to determine the extent to which group members give the same ratings or responses. LeBreton and Senter (2008) suggested the use of an rwg value greater than 0.70 to determine acceptable values for within-program agreement levels; however, if decisions made based on these responses were considered high stakes, then a much higher value, likely greater than 0.90, would be required.
WABA
The second approach used to examine the appropriateness of aggregation to the program level was the WABA approach. In contrast to the ANOVA approach, the WABA approach simultaneously models the student and program levels by taking the multilevel structure of the data into account. The WABA approach provides additional information to the ANOVA approach on whether there is a more suitable level of aggregation beyond the student level but not quite at the program level (Dansereau et al., 2006). There are four levels of inferences that can be drawn from the WABA approach: wholes, parts, equivocal, and null.
Wholes. When the inference drawn is “wholes,” it means that the results can be aggregated to the program level because the students within the program are homogeneous in their responses.
Parts. If the inference indicates a “parts” level, then some level of aggregation may be appropriate but not quite at the level of the program. A parts inference could mean that there is some level of interdependency among students within program majors but that there are still too many differences among students within the program to support aggregation at the highest, wholes level.
Equivocal. In contrast, if the inference drawn is at the level of “equivocal,” then it implies that aggregation beyond the student responses is not valid and the researcher should use only disaggregated results.
Null. Also, if the inference result is “null,” then the within-program variation is in error, and again, any level of aggregation is not supported.
Table 3 describes the criteria established by Dansereau and Yammarino (2000), and adapted by Griffith (2002, p. 121), that were used for this study when determining the appropriate levels of inference using the WABA approach. In the first column are the four possible inferences: wholes, parts, equivocal, and null. The next three columns presented in Table 3 provide the information on how these levels of inferences can be determined from the data.
WABA Criteria for Determining Level of Inference for Composite Scalelets

Note. WABA = Within and between analysis; Var = variance; bn = between; wn = within.
The criteria detailed in Table 4 (Griffith, 2002, p. 122) were used to interpret the results for the WABA aggregation analysis. Table 4 includes two sections, where the first column shows the criteria used to understand the correlations between perceived general learning and the learning environment variables at the program level and at the student level. The second section provides the criteria for interpreting the decomposition of the correlations between perceived general learning and the learning environment ratings into their between- and within-program components. Finally, Table 4 also reports the criteria used to examine the results of the third step in the WABA analysis that first compares the correlations between perceived student learning and the learning environment variables and then decomposes the between- and within-program component correlations. The final step in the WABA approach was referred to as “multiple relationship analysis” by O’Connor (2004) because this step extends the inferences that were made based on the second step of the WABA process by investigating the boundary conditions of those Step 2 inferences (described in Table 3).
WABA Criteria for Determining Aggregation and the Relationship Between Two Scalelets

Note. WABA = Within and between analysis; bn = between; wn = within.
Unconditional two-level multilevel model
The third and final approach used to examine the appropriate level of data aggregation and analysis in this study was the unconditional two-level multilevel model. The unconditional multilevel model provides three results that help determine the appropriateness of examining the scalelets at the program level (Raudenbush & Bryk, 2002): first, the proportion of variance in the dependent variable explained by program membership compared to total within-program variance; second, the extent to which member responses on dependent variables indicate program-level responses; and third, the extent to which variation in the dependent variable can distinguish program membership. This model is called the “unconditional two-level model” because it simultaneously includes the student and program levels and includes only one scalelet in the model at a time (Equations [4] and [5]; Appendix B). Using the notation described by Raudenbush and Bryk (2002), the proportion of variance explained by the unconditional multilevel model was calculated using Equation (6) (Appendix B). The restricted maximum likelihood estimation procedure was selected over the full maximum likelihood approach because it provides more realistic and larger posterior variances than with the full maximum likelihood method, particularly when the number of highest grouping units is small, which was the case for this study (Bryk & Raudenbush, 1992).
Results
Properties of the NSSE Scalelets Using PCA
The PCA model assumptions require that the variances of different samples be homogeneous, a criterion that was met for all the variables included in this analysis. In addition, variables should be normally distributed, which was confirmed upon examination of the P-P (probability-probability) plots that were created for each variable. The results of the PCA were examined for each scale regarding the Kaiser-Meyer-Olkin (K-M-O) measure of sampling adequacy, Bartlett’s test of sphericity, anti-image matrices, interpretation of the factors, number of items included in each factor, size of the pattern and structure coefficients, and the percentage of variance explained. The acceptable value of the K-M-O index was 0.60 and a significant p value for the Bartlett’s test of sphericity. The anti-image matrices were reviewed to examine the correlations, where the values on the diagonal were greater than 0.50, indicating that the item contributes well to the scale. A common rule applied in PCA and factor analysis for determining the number of acceptable factors to retain is Kaiser’s rule of an eigenvalue greater than 1.00, which was applied in this study.
Table 5 includes the number of students for whom the scalelets were calculated as well as the number of items used to compose a scalelet, the mean scores, the standard error, and standard deviation calculated using IBM SPSS Version 21. The reliability of each scale was determined using Cronbach’s alpha, which ranged from 0.65 to 0.76 for 1st-year students and from 0.63 to 0.79 for 4th-year students. Although 0.70 is typically the minimum acceptable level of reliability estimates in educational research (Tavakol & Dennick, 2011), reliabilities of 0.60 have been found to be acceptable in survey research when the stakes associated with the interpretation of results are low and the number of items used to create the scale is less than 10 (Loewenthal, 1996). However, low reliability values indicate high measurement error, which could hamper the correct interpretation of students’ perceptions. The lowest reliability estimates were associated with the emphasis on diversity scalelet for both 1st- and 4th-year samples (Table 5). Overall, the results of the PCA indicate that on the basis of student responses, the NSSE items examined contributed well to their respective scalelets. The correlations among the scalelet scores are included in Table 6. The scalelets interpersonal environment and overall satisfaction had the largest correlation values for both 1st- and 4th-year students (0.48 and 0.56, respectively), whereas the smallest correlation values for each sample were found between interpersonal environment and support for student success (0.22 and 0.20, respectively).
NSSE PCA Descriptive Statistics for Composite Scalelets by Year Level

Note. NSSE = National Survey of Student Engagement; PCA = principal components analysis.
Correlations Among Scalelets

p < .001.
Properties of the NSSE Scalelets Using MFA
The results of the two-level MFAs corresponded to the PCA results and confirmed that the NSSE items contributed statistically significantly (p < .05) to their respective scalelets at the student level across both year levels. However, perceived general learning outcomes for 4th-year students was the only scalelet to meet the model requirements for aggregation to the program level. The items used to create the perceived general learning scalelet for 1st-year students, and all of the learning environment scalelets for both year levels, did not meet model assumptions (e.g., resulted in misspecified models) when using aggregate program-level responses (see Appendix C). The results of the ICC values and the factor loadings for within programs and between programs for the perceived general learning scalelet for the 4th-year sample are reported in Table 7. For the 4th-year sample, the model fit statistics indicated an acceptable fit, although the RMSEA value of 0.09 was slightly higher than the acceptable criteria of equal to or less than 0.08 (Hu & Bentler, 1998). The SRMR within value was 0.03, and the SRMR between value was 0.05, both acceptable at values less than 0.08. The CFI value was also acceptable at 0.99, as was the TLI value of 0.97.
NSSE MFA Results for Perceived General Learning for 4th-Year Students

Note. NSSE = National Survey of Student Engagement; MFA = multilevel factor analysis; ICC = intraclass correlation.
p < .05.
The ICC values reported in Table 7 were low across most of the items used to describe the perceived general learning scalelet, which indicates that item results about general learning outcomes did not vary strongly based on program membership for the 4th-year sample. The ICC value for the item, writing clearly and effectively, did yield the highest ICC value across all items, 0.13, which suggests that about 13% of the variance in student responses could be attributed to program membership on this item for the 4th-year sample. Also, all items contributed well to the overall scalelet based on the within-program factor loadings and for items on the between-program factor loadings (p < .05). When examining the 4th-year MFA results for the perceived general learning scalelet, we found some variation with the order of the factor loadings between the student and program levels, based on their magnitude. Only the item writing clearly and effectively had the largest factor loadings at both the student and program levels (0.898 and 0.961, respectively). The item acquiring a broad general education contributed more at the program level (0.854) than it did at the student level (0.565).
Aggregation Statistics
Table 8 displays the results of the ANOVA that examined variability across program major groups. As shown, all F values were statistically significant at the p < .05 level for all scalelets except support for student success in the 4th-year sample, indicating variability across the groups. Using Equation (1) (Appendix B), the ICC(1) values were calculated for each of the five NSSE study scalelets to examine nonindependence. The ICC(1) values in Table 8 show that program-level variances were relatively small, ranging from 0.00 to 0.10 across year levels, which were much lower than the criterion described in the Method section of a value greater than or equal to 0.12 (Griffith, 2002). The perceived general learning scalelet showed the largest variation for the 4th-year sample, with an ICC(1) value of 0.10. These values indicate that about 10% of variation among 4th-year student perceptions about their general learning outcomes could be attributed to the program. Emphasis on diversity and interpersonal environment scalelets also showed relatively large variation among 4th-year students, with ICC(1) values of 0.06 and 0.07, respectively. The ICC(1) values for the remaining variables were quite low, indicating that student responses did not vary as a result of program membership.
NSSE ANOVA Approach to Test Aggregation by Program Major

Note. NSSE = National Survey of Student Engagement.
Using Equation (2) (Appendix B), the reliability estimates, or ICC(2) values, were calculated for 1st-year students, and the results ranged from 0.29 to 0.44, and for 4th-year students, they ranged from 0.02 to 0.67. These ICC(2) values are very low, especially when compared against Griffith’s (2002) acceptable criterion value of greater or equal to 0.83. Essentially, these results indicate that the average program ratings on all five of the scalelets, across both year levels, did not provide reliable estimates of program major means. The highest ICC(2) value reported was for perceived general learning for both 1st- and 4th-year students (0.44 and 0.67, respectively). The lowest ICC(2) value reported for 1st-year and 4th-year students was support for student success: 0.29 and 0.02, respectively. Also shown in Table 8 are the results of the within-program agreement statistic, rwg. This statistic was calculated for each of the program majors separately, then averaged across all programs in the study (i.e., university) for each scalelet and for 1st- and 4th-year students (Castro, 2002). These university averages ranged from 0.26 to 0.65 for 1st-year students and from 0.31 to 0.61 for 4th-year students. These values indicate that there were low levels of agreement among students grouped in NSSE program major groupings across both year levels.
Results from the first step in the WABA approach are presented in Table 9. The first value in the second column of the table is the between-program variance, which is compared to the second value, which is the within-program variance. As shown, the between-program variances were larger than the within-program variances for all variables across both year levels, which indicates that the first step of the WABA approach seems to support aggregation to the program major level. The third column in the table provides the F values, and the fourth column provides the p values, which provide information regarding the statistical appropriateness of aggregation. The F values were larger than the value of 1.00 and had statistically significant p values (p < .05), which implies that there is empirical evidence to support the statistical appropriateness of aggregation to the program level, with the exception of supporting student success for the 4th-year sample. The final two columns in Table 9 provide information regarding the effect size (eta-squared) statistic, which represents the practical significance of aggregating to a particular level of inference. Tests of statistical significance incorporate sample sizes, whereas the tests of practical significance are geometrically based and are not influenced by sample sizes (Castro, 2002). Based on the effect size results, a parts relationship was practically supported for all study variables across both year levels. These results suggest that subgroup populations may be responding similarly, but there was too much variation within the program major grouping to practically support aggregation to that level.
NSSE WABA Approach to Test Levels of Inference by Program Major
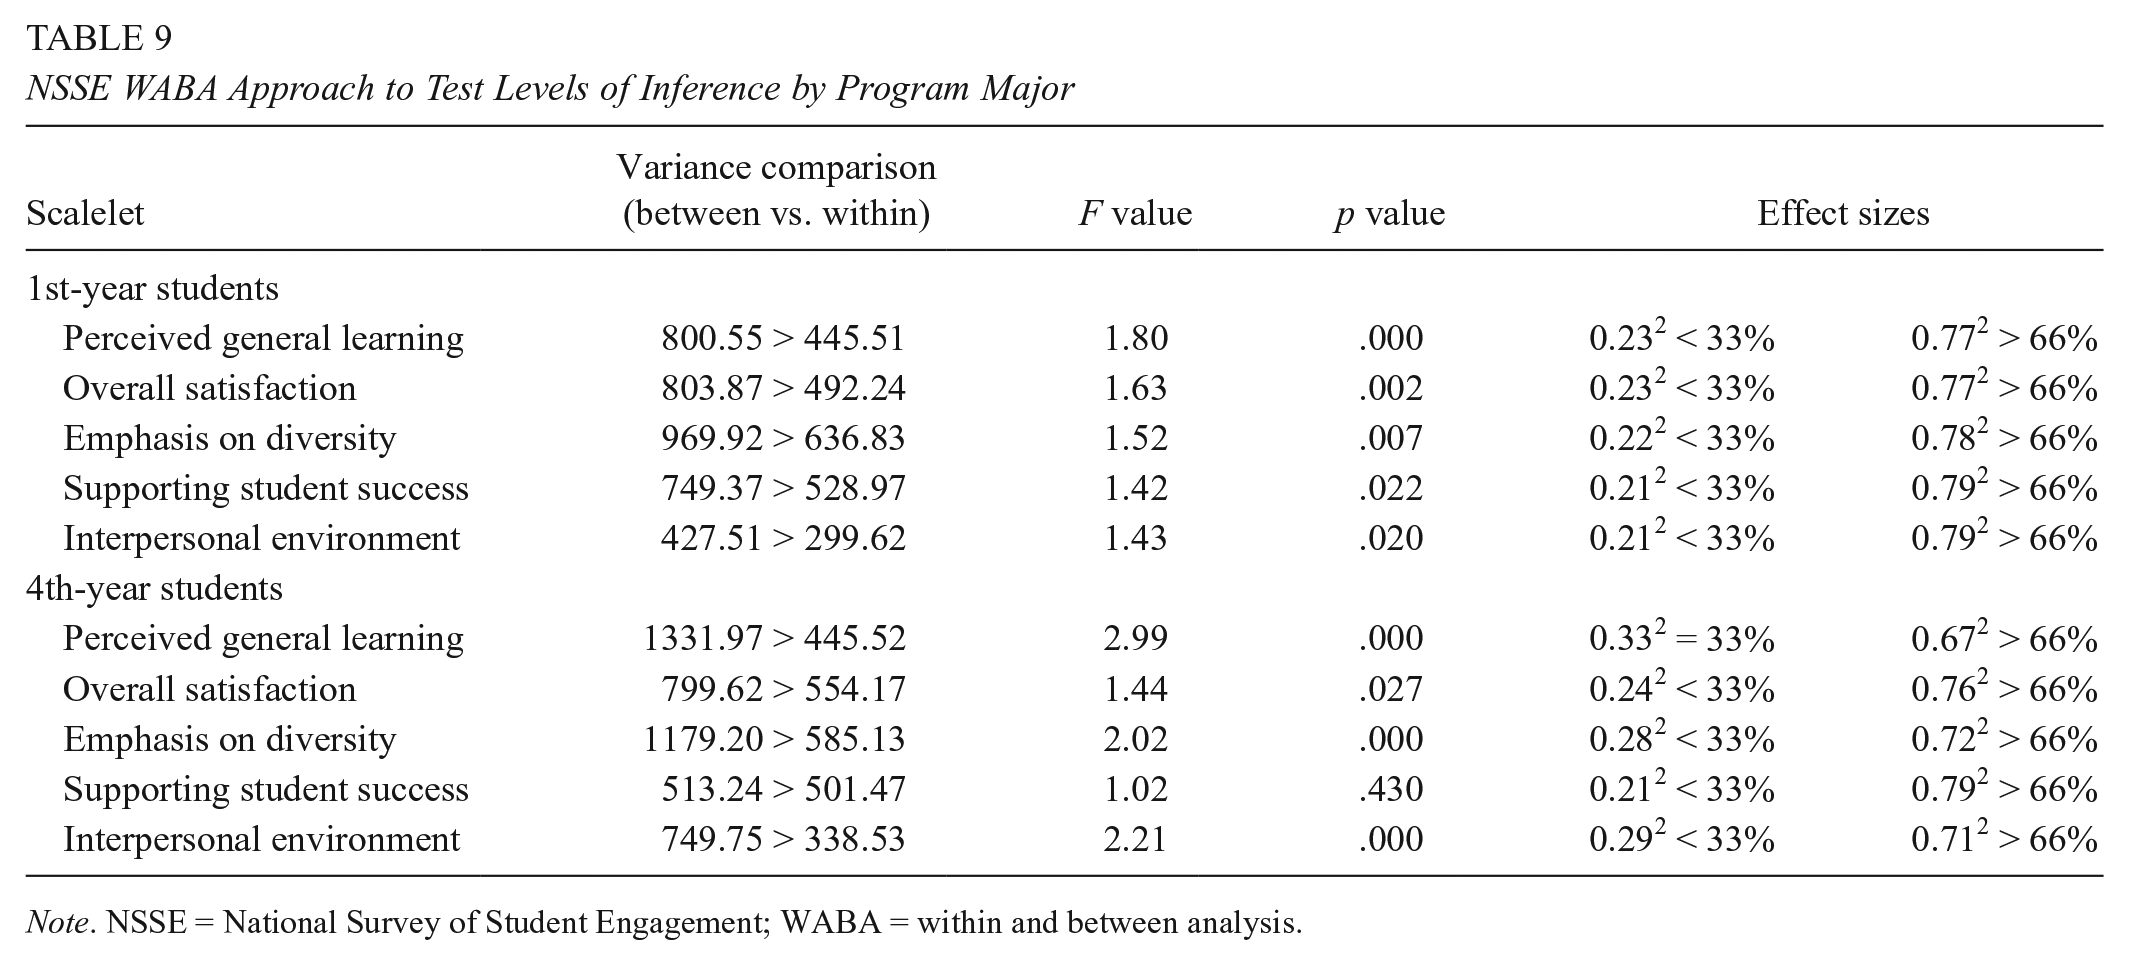
Note. NSSE = National Survey of Student Engagement; WABA = within and between analysis.
Correlations between perceived general learning outcomes and each of the learning environment variables were calculated at the program level and the student level for 1st- and 4th-year students. Each of these program- and student-level correlations was compared against each other for each of the study variables to determine the level of inference that could be made from these NSSE data. Table 10 reports the results of the bivariate correlations for both 1st- and 4th-year students. For 1st-year students, the correlations among perceived general learning outcomes and the learning environment variables were related to the program groupings, or wholes, because the bivariate correlations based on program-level data were greater than the correlations based on student-level data. The results for 4th-year students indicated that only the emphasis on diversity scalelet could be interpreted at the program level. The student-level correlations for the 4th-year students were larger than the program-level correlations; thus the remaining variables should be interpreted from a lower-level grouping within the program major.
NSSE WABA Comparisons of Bivariate Correlations

Note. NSSE = National Survey of Student Engagement; WABA = within and between analysis.
p < .01. ***p < .001.
When the correlations of student perceived general learning outcomes and program-level variables were decomposed into their between- and within-program components (Table 11), the results indicated that these relationships should more appropriately be studied as subgroups within programs, or the parts effect, rather than with wholes across both year levels (Dansereau et al., 2006). As shown in Table 11, the results indicated that the between-program component correlations were quite small, whereas the within-program component correlations were much larger, and statistically significant, for all study variables across both year levels.
NSSE WABA Decomposition of Correlations
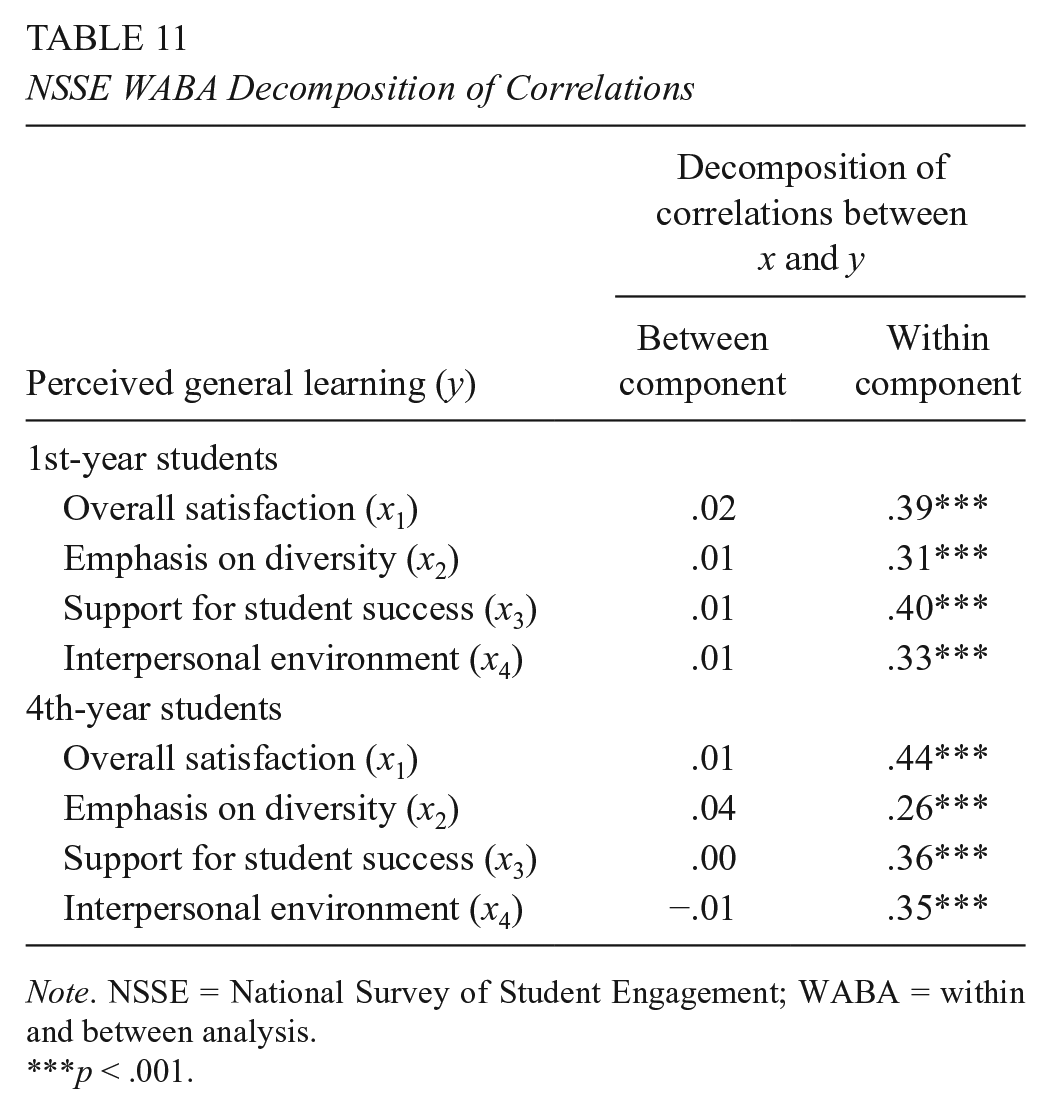
Note. NSSE = National Survey of Student Engagement; WABA = within and between analysis.
p < .001.
Table 12 displays the results of the unconditional multilevel analyses for 1st- and 4th-year students, which was conducted using HLM Version 7.0 software (Raudenbush, Bryk, & Congdon, 2004). At the program level, the reliability of program means is influenced by the number of students sampled per program and the level of student agreement within programs (Raudenbush & Bryk, 2002). The proportion of variance explained was calculated using Equation (6) (Appendix B). The proportions of variance explained were quite low for the 1st-year students, which implied that for the program groupings in this sample, there was likely more variability within program majors than among program majors on the outcome variables. These results were supported by reliability estimates for each of these variables, ranging from 0.26 to 0.37, which indicates that program means were not reliable. The 4th-year student results also did not support aggregation at the program major level. These results imply that the program major means were not reliable because there were too many within-program differences among student responses to the NSSE study items. Student perceptions of general learning outcomes for 4th-year students seemed to be the only variable to have a reliability estimate large enough, 0.64, to be considered appropriate for aggregation (Loewenthal, 1996). About 6% of the variability among student perceptions for perceived general learning outcomes was explained by program membership, which suggests that the remaining 94% could be attributed to differences between students within program majors, and a term that includes error variance.
NSSE Unconditional Multilevel Results to Test Aggregation by Program Major
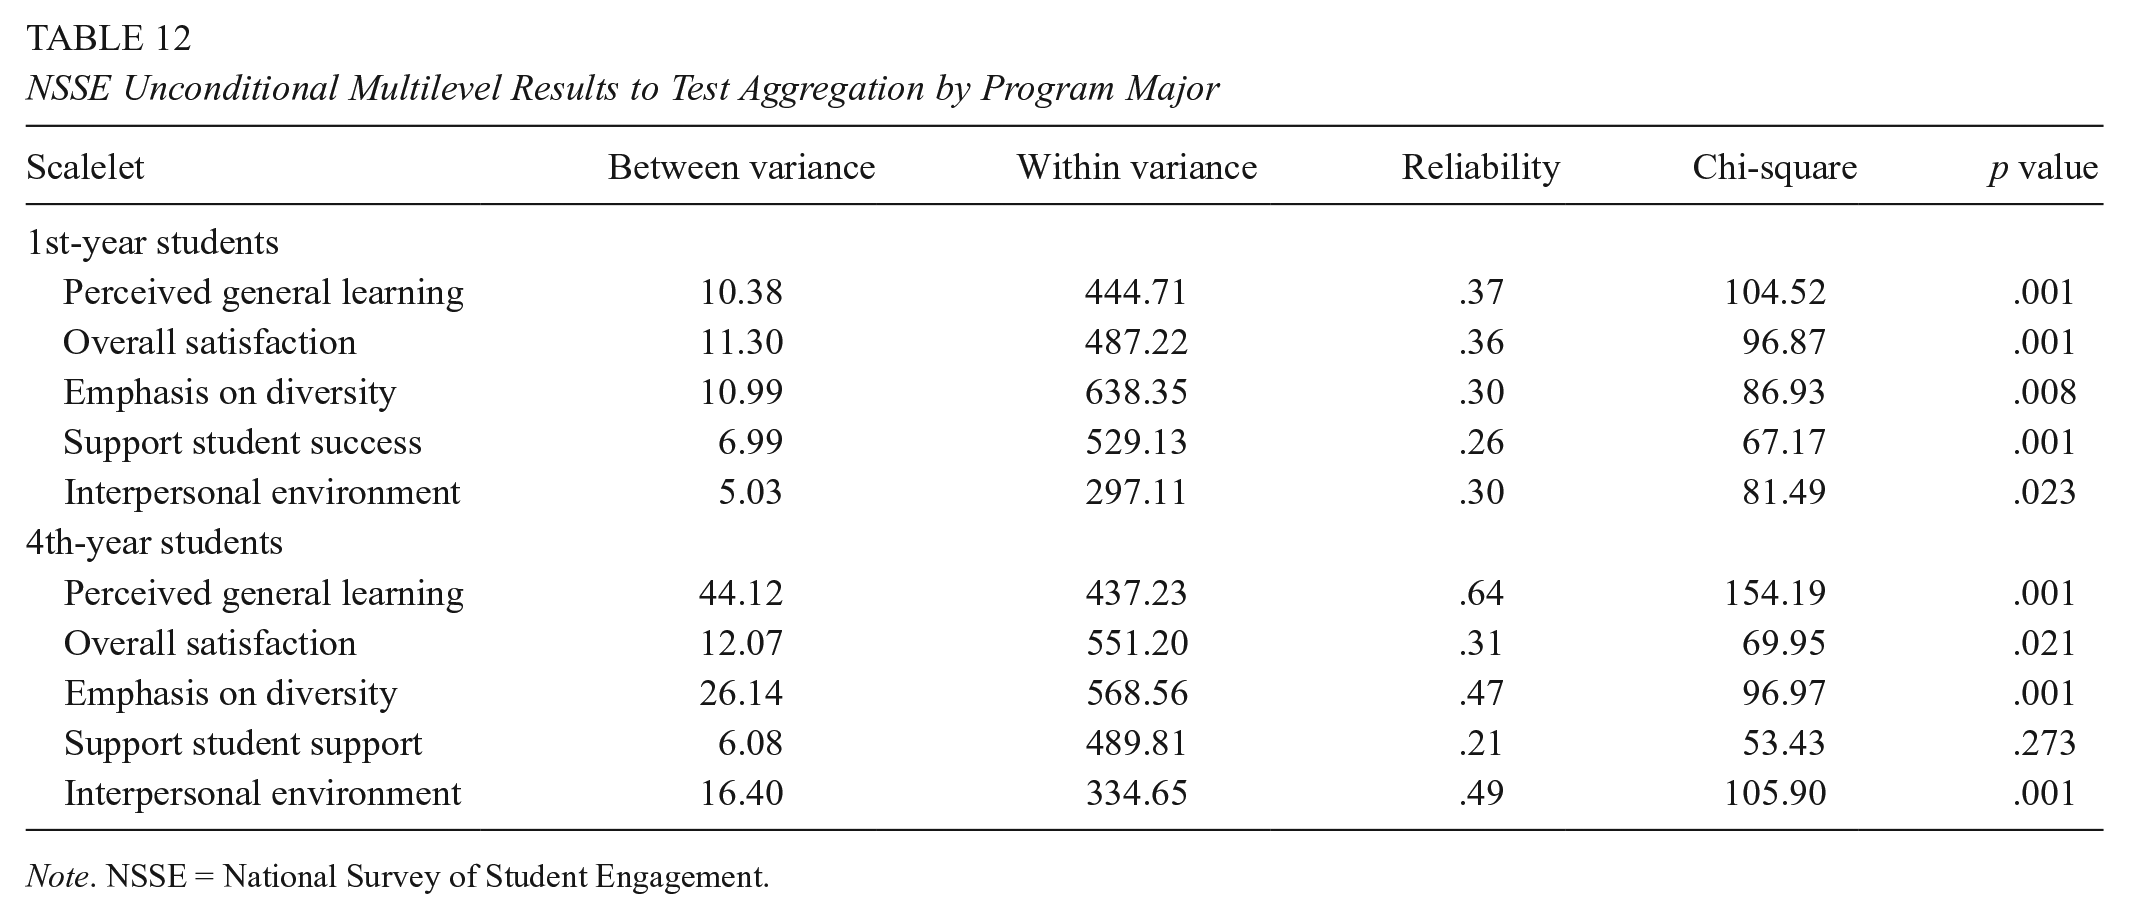
Note. NSSE = National Survey of Student Engagement.
Discussion
Group-level analyses are common in educational research (D’Haenens et al., 2008; Porter, 2011) and are of importance to institutional effectiveness research that focuses on the interactions among groups as well as the interaction between the student and program majors, yet the appropriate level of aggregation based on student responses requires empirical and substantive support. Many group-level analyses regarding program of study have neglected to examine the appropriateness of aggregation prior to drawing their conclusions. The overall results of this study showed that different interpretations could be drawn regarding the reliability and accuracy of a scalelet when examining it from a multilevel perspective compared to a single-level perspective. Thus, decisions made based on program averages, calculated from aggregating student survey responses, may be misleading and lead to erroneous judgments regarding program effectiveness. The findings from this study were consistent with the research of D’Haenens et al. (2008), who also found different outcomes in their study when constructing school process variables based on teacher perceptions by using a multilevel approach compared with a single-level approach. Of particular concern is that many researchers examining group-level interactions fail to examine the multilevel structure of their data prior to creating composite ratings and interpreting program-level results.
The lack of multilevel validity evidence for these study scalelets might be related to the wording of the NSSE survey items. The scalelets for perceived general learning outcomes, overall satisfaction, and interpersonal environment tended to perform somewhat better at the program level than the scalelets for emphasis on diversity and support for student success. This could be related to the use of a referent-direct consensus approach, whereby students were asked to refer to their own experiences when responding, compared with a referent-shift approach, whereby students were asked to refer to students in general, or to the university, when responding rather than their own personal experiences. There was one item on the emphasis-on-diversity scalelet that was about the university rather than the individual student, and all questions related to support for student success were related to the university. The findings in this study might suggest that items intended to be aggregated to the program level should be worded using a referent-direct approach. Klein et al. (2001) also highlighted the importance of item wording in their study of employee perceptions of the work environment; however, their findings differed from this study, and they reported that items using the referent-shift approach increased between-group variability as well as within-group agreement in their study. They concluded that item wording using a referent-shift approach might yield greater support for group-level aggregation. Further research regarding the wording of survey items would need to be conducted to determine which approach would be best for program-level grouping within a university setting.
Limitations of the Study
A limitation of this study was related to the sample size requirements to conduct the multilevel models: the WABA and the unconditional multilevel model. Multilevel procedures are based on the assumption that there are many higher-level units in the analysis. Sample sizes of 30 units with 30 individuals work with acceptable loss of information in a multilevel model (Kreft & De Leeuw, 1998), and practically, 20 units are considered acceptable (Centre for Multilevel Modelling, 2011). The sample sizes used in this study included 59 1st-year and 49 4th-year programs, each with a minimum of 5 students per program. The results of the multilevel analyses indicated that the program means for these samples were not highly reliable, which could be due to the small within-program sample sizes. The program means might have been more reliable, and results regarding the influence of program majors could have differed if more program-level units, and more students included within programs, were included in the analyses.
The summed score approach was used in this study because it was suggested by Pike (2006b) as the most commonly used approach by researchers examining NSSE results, which is because it can be easily replicated by the institutional users of the NSSE (Pike, 2006b). In addition, the summed approach is useful because it maintains the variability of the original scores and is able to be compared across different samples. Yet, this approach could be considered a limitation as it assumes that all items contributed similarly to the scalelet; however, based on the results from the two-level MFA, items did not contribute equally to the scalelet at the student and program levels. Another consideration could be to use the weighted summed approach, because it considers the variability in how items contribute to the overall scalelet, thus providing more weight to items that contribute more and less weight to items that contribute less. When the value of the factor loadings is similar across items, the overall results will not change too much between the unweighted and weighted summed approaches, but when the results differ considerably across items, the results could differ substantially.
The process for identifying group membership could also be considered a limitation of this study. When examining the differences among groups, it is best to use a natural grouping variable rather than force an unnatural grouping of individuals. As previously mentioned, the NSSE survey asked students to identify their program major, or intended program major, using an open text field. Although this process of collecting program major could be considered a natural grouping, based on how the students view their program membership, the results of this study for the NSSE example indicated that there was still too much variability in responses from all but one scalelet for inferences to be drawn at the program level. There was too much variability among the program means for most of the scalelets regarding the learning environment, which might have been due to poor program groupings. Although the NSSE staff members encourage institutional NSSE users to compare across program majors (NSSE, 2011b), the results of this study did not support the use of the NSSE program major field as a grouping variable for many of the scalelets used in this study.
Implications for Institutional Effectiveness Research
Despite these limitations, the results of this study have implications for higher educational policy, higher educational practice, and institutional effectiveness research. More specifically, there are four general areas where this study contributes to the national and international conversation on the complexities in measuring general learning outcomes in higher education. First, even though the most common institutional use of these surveys has been for program-level analyses, this is the first study to examine the multilevel validity of program-level inferences made from the NSSE results within a university setting. The research examining institutional effectiveness using the NSSE data has usually involved multiple institutions analyzed together, and findings are reported across universities and colleges (Olivas, 2011). Even though a primary purpose of the NSSE is for internal institutional use, there have been few attempts to validate these models within a single university setting (Borden & Young, 2008). Second, this study demonstrated how inferences made at the program level based on aggregate student survey outcomes are best examined using a multilevel perspective. Third, the results of this study reveal that the appropriateness of aggregation could be variable dependent and related to NSSE item phrasing and item design. Thus, the results of this study suggest that further research is needed to understand the appropriate item design framework to be used when creating survey items for students, which will be used to draw conclusions about their program. Finally, the results of this study underscore the importance of statistical procedures used to examine the multilevel validity of program-level inferences and how multilevel models provide additional insight that would be overlooked with single-level models. Multilevel models that can handle smaller group sizes at the higher-level units and the within-group population are of considerable importance in institutional settings, particularly for institutional effectiveness researchers.
Measuring general learning outcomes is a complex process because currently there is little consensus on how to measure student general learning across programs and institutions (Penn, 2011; Porter, 2012). There are few studies of the quality of higher education that make the appropriate linkages of quality and effectiveness indicators to educational process for the differences in educational outcomes between students, programs, and the learning environment within a single institution (Borden & Young, 2008). Although the use of more direct measures of student learning has been gaining popularity in higher education, the use of surveys (e.g., student course evaluations, senior surveys, exit surveys, etc.) is a common approach used in Canada and the United States used to solicit feedback from students regarding their perceived learning outcomes and impressions regarding their learning environment. The results of this study highlights the significance of examining the issue of heterogeneity within and across program majors prior to drawing conclusions at the program level. Prior to interpreting aggregate student results as program-level results, the appropriate level of aggregation and interpretation requires empirical evidence sufficient for demonstrating multilevel validity. This study has provided several statistical options on how to examine the multilevel validity of aggregate student survey responses within a university setting.
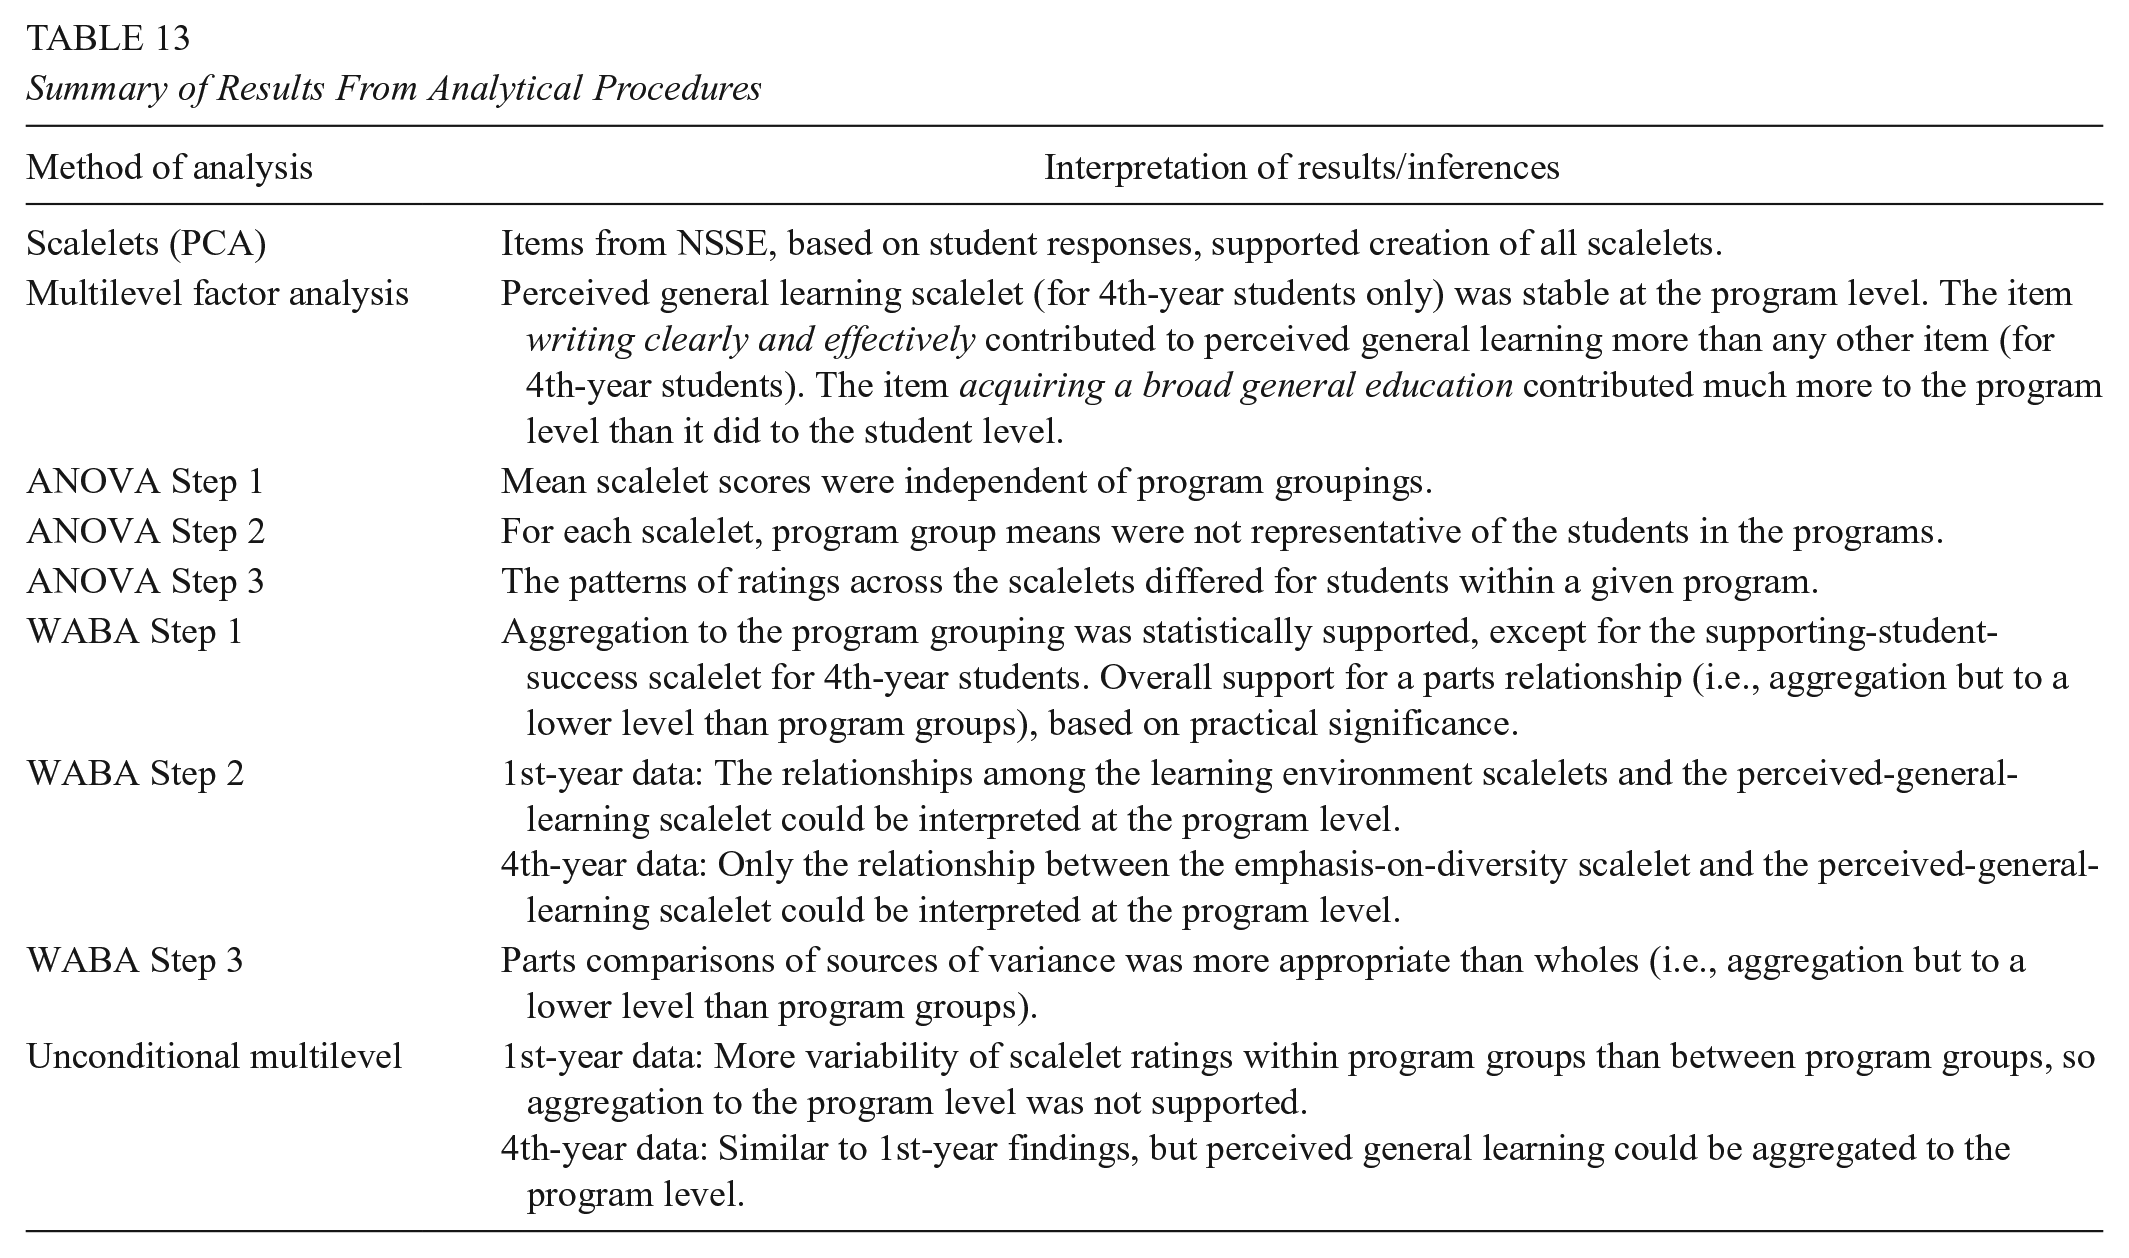
Conclusions
Table 13 provides an overall summary of the study findings. According to the results of the PCA, student-level responses to the NSSE items used in this study contributed statistically significantly to each of the scalelets, and the reliability estimates were acceptable. However, results differed substantively when both student responses and program averages were examined simultaneously using a two-level MFA approach. Only one scalelet, perceived general learning, for 4th-year students was found to be stable at both the student and program levels. The results from all three of the aggregation procedures indicated that student responses on the NSSE scalelets used in this study were independent of program membership, that program means were not reliable, and that there was too much variability among students within program groups for the program means to be used for comparing against other programs within the university. Thus, any program-level decisions made based on these scalelets would be inappropriate for the samples used in this study. However, the WABA and the unconditional multilevel model results suggested that another lower-level grouping may be more appropriate than the NSSE program major groups for all of the scalelets. Further research could examine the levels of disagreement among students within program majors to determine the amount of within-program variability (Klein, Conn, Smith, & Sorra, 2001). Campus location, student age, gender, race, culture, educational background, and other characteristics could potentially be used to examine the correlates of variability about the perceptions of program members’ general learning outcomes and the learning environment.
Summary of Results From Analytical Procedures
Footnotes
Appendix A
Appendix B
Appendix C
Authors
STEPHANIE BARCLAY MCKEOWN is the director of planning and institutional research at the University of British Columbia’s Okanagan campus.
KADRIYE ERCIKAN is the vice president of statistical analysis, data analysis, and psychometric research at Educational Testing Services and a professor of measurement, evaluation, and research methodology at the University of British Columbia’s Vancouver campus.