
Abstract
Although prior research has suggested that some students may be averse to taking out loans to finance their college education, there is little empirical evidence showing the extent to which loan aversion exists or how it affects different populations of students. This study provides the first large-scale quantitative evidence of levels of loan aversion in the United States. Using survey data collected on more than 6,000 individuals, we examine the frequency of loan aversion in three distinct populations. Depending on the measure, between 20 and 40% of high school seniors exhibit loan aversion with lower rates among community college students and adults not in college. Women are less likely to express loan-averse attitudes than men, and Hispanic respondents are more likely to be loan averse than White respondents.
A
Evidence of the existence of loan aversion has been found among students in various contexts (Burdman, 2005; Caetano, Palacios, & Patrinos, 2011; Callendar & Jackson, 2005; Cunningham & Santiago, 2008; Goldrick-Rab & Kelchen, 2013; Palameta & Voyer, 2010), but much of the empirical work has been done outside the United States. Goldrick-Rab and Kelchen (2013) sampled students from Wisconsin to estimate the extent of loan aversion, but because their sample has already enrolled in college, their findings may not be generalizable to individuals who are not currently enrolled in higher education. The present study overcomes this limitation by obtaining samples from three different populations: high school seniors, community college students, and adults who are not currently enrolled in higher education. We include high school students as we are interested in how attitudes about borrowing money for college might shape the decision to borrow and enroll in higher education. Community college students have already made a decision about borrowing money for college and, as a result, may have attitudes about borrowing that differ from those of high school students. In addition, community college students constitute an important population of students in higher education as almost 50% of undergraduates are enrolled in a public community college (College Board, 2011). Adults who do not have a college degree provide another, unique perspective into attitudes about borrowing given their experience in the labor market and managing their own finances. They may also be future college students.
Within any of these three populations, little quantitative evidence exists to identify how loan aversion varies by demographic characteristics. Cunningham and Santiago (2008) suggest Asian and Hispanic college students are less likely to borrow, but it is not clear if those preferences are a result of loan aversion. In addition to contributing to the evidence suggesting that loan aversion exists among students in the United States, our study also measures how loan aversion varies by gender, income, parental education, and race.
Loan aversion may lead to negative outcomes for some students. Given that student loans are the primary policy mechanism by which to relieve credit constraints, a reluctance to borrow implies loan-averse students could potentially underinvest in higher education. This underinvestment could manifest itself in a variety of ways: working more hours while enrolled, enrolling in 2-year instead of 4-year colleges, enrolling part-time instead of full-time, delaying college enrollment after high school, or forgoing college altogether. These decisions may adversely affect enrollment, persistence, and success in college. For example, research suggests that too many hours of work may have a negative effect on students’ college grade point average (GPA; Scott-Clayton, 2011; Soliz & Long, 2016; Stinebrickner & Stinebrickner, 2003), and lower- and middle-income students engage in this behavior at higher rates than their upper-income peers (authors’ calculations using Educational Longitudinal Study of 2002). Moreover, delaying enrollment, enrolling less than full-time, or enrolling in a 2-year college rather than a 4-year college has also been shown to have a negative effect on students’ probability of persistence and degree completion (Attewell, Heil, & Reisel, 2012; DesJardins, Ahlburg, & McCall, 2006; Long & Kurlaender, 2009; Monaghan & Attewell, 2014).
This study seeks to better understand loan aversion among students in the United States, drawing upon economic and sociological theory to describe why loan aversion may exist. Through the collection and analysis of a unique data set of over 6,000 high school seniors, community college students, and adults without a degree who are not enrolled in college, we measure the extent of loan aversion among a diverse population in an effort to assess differences in loan aversion by gender, race, income, and first-generation college status. Within our survey, we replicate the questions of past studies in order to compare different measures of loan aversion used in the previous literature (Callendar & Jackson, 2005; Palameta & Voyer, 2010). Our three research questions are as follows:
To what extent is loan aversion present among high school students, community college students, and adults not enrolled in college?
What is the relationship between different measures of loan aversion?
Does loan aversion vary by individual characteristics?
Someone who is loan averse may underinvest in higher education, likely leading to lower lifetime earnings and possibly reducing the educational attainment of his or her children. This behavior also has negative implications for society, as higher education is strongly correlated with healthier, more engaged citizens and provides a greater tax base for government funding (Baum, Ma & Payea, 2013). If loan aversion exists, our second research question addresses how to measure it. Finally, loan aversion may affect some potential students more than others. If, for example, loan aversion affects the college investment decisions of females more than males, this has implications for policy interventions designed to ameliorate this problem.
Our study contributes to the extant literature in several ways. First, we replicate the survey questions of Callendar and Jackson (2005) and Palameta and Voyer (2010), who conducted their studies in England and Canada, respectively, in the context of the United States among three separate populations: high school seniors, community college students, and adults without a college degree who are not enrolled in higher education. Second, by surveying populations who are not currently enrolled in higher education, we improve upon the existing literature. Studies limited to samples already enrolled in higher education may underestimate the effects of loan aversion if students who were averse did not initially enroll, and for this reason, we sample two groups (high school seniors and adults) prior to enrolling in college. Third, we demonstrate how three distinct measures of loan aversion, all of which exist in the literature, compare to each other within the same sample. Finally, we provide evidence of how the various definitions of loan aversion vary by respondent characteristics, which is notably absent in the literature.
Theory and Literature on Loan Aversion
Rational Economic Theory on Borrowing for Higher Education
According to standard economic theory, a student decides whether or not to enroll in college using a standard cost-benefit analysis. A potential college student assesses the cost of enrolling by factoring in tuition and fees, room and board, and available financial aid. The student weighs those costs against the discounted future benefits associated with the degree, including greater earnings. Economic theory would suggest that a rational student will enroll in college when the benefits outweigh the costs (Avery & Hoxby, 2004).
Given the evidence on the significant financial returns to college credentials, investing in higher education is, on average, a smart economic decision for students (Avery & Turner, 2012; Carnevale, Rose, & Cheah, 2011; Hoekstra, 2009; Kane & Rouse, 1995). The average benefit of earning a bachelor’s degree compared to a high school diploma has increased at a faster rate since the 1960s than the cost of a college education (Avery & Turner, 2012). However, not all students can afford the direct costs even if they want to enter college. Student loans are available to resolve this credit constraint. Individuals must decide how much debt to take on relative to the potential payoffs in future earnings. Although students are taking on more debt than in previous decades, the ratio of student loan payment to income has remained constant at between 9% and 11% (Baum & Schwartz, 2006). Even conservative estimates of the median value in lifetime earnings associated with a college degree (around $800,000 over a lifetime) far surpass the average national loan debt of $27,850 for those who earn a 4-year degree (Hershbein & Kearney, 2014; Institute for College Access and Success, 2015). These numbers suggest that borrowing for a college degree is, on average, a good decision.
Despite these average outcomes, some students may decide not to borrow or to borrow a small amount for rational reasons. For example, if students carefully consider their degree, major choice, and labor market prospects and decide that they are unlikely to earn enough to repay their loan, then avoiding borrowing may be completely rational. Using student loans to finance one’s postsecondary education also has potential negative implications. Among students who graduate with a degree, many report delaying buying a house (40%), buying a car (31%), having children (22%), moving out of their parents’ house (21%), and getting married (15%) due to educational loans (Baum & Saunders, 1998). Gladieux and Perna (2005) found that the negative ramifications of educational debt are particularly high for the approximately 20% of student borrowers who drop out without earning a degree. Students who drop out experience fewer gains in employment and income, as well as higher loan default rates, than students who earn a degree (Gladieux & Perna, 2005). McKinnery and Burridge (2015) found that community college students with federal loans were over 2 times more likely to drop out over a 3- and 6-year period compared to nonborrowers. However, Gladieux and Perna demonstrate that the risk factors related to socioeconomic status best predict whether students will drop out, not their decision to borrow.
Aside from these rational reasons for not borrowing, some students may be unwilling to borrow even though investing in higher education would result in positive economic returns. Traditional economic theory argues that these students are behaving irrationally. In this sense, loan aversion may present a policy problem, making it important to measure the extent of this phenomenon within our samples. Although we present various measures of loan aversion, our study is not able to disentangle rational from irrational preferences.
Behavioral Economic and Sociological Explanations for Loan Aversion
Behavioral economics offers several potential explanations for loan aversion. 1 Previous literature has demonstrated that the complexity of the financial aid system prevents some prospective students from applying for aid (Bettinger, Long, Oreopoulos, & Sanbonmatsu, 2012; Dynarski & Scott-Clayton, 2006), and this complexity may deter students from borrowing. Because the Free Application for Federal Student Aid (FAFSA) requires knowledge of prior-year earnings and assets, individuals for whom this information is not readily understood or accessible may elect not to apply for financial aid and, thus, not attend college. Similarly, there is evidence that many people living in poverty do not open bank accounts because of small obstacles, such as distance to the nearest bank (Bertrand, Mullainathan, & Shafir, 2006). Some prospective students may be highly risk averse and, therefore, avoid any decision that could result in a negative outcome, such as defaulting on their student loans if they fail to secure a job or end up earning less than expected (Rabin & Thaler, 2001). This rationale is further supported by cumulative prospect theory (Tversky & Kahneman, 1992), which suggests people tend to overweight extreme events even when their likelihood of occurrence is quite low. Student loan default may be viewed as such an event, and students averse to borrowing may be overweighting the risk inherent in borrowing.
In addition, behavioral economics suggests that framing and labeling effects matter. Typically, people make decisions based around a reference point (Tversky & Kahneman, 1992), and individuals may make different decisions depending on the frame or the label of the reference point. For example, Caetano et al. (2011) demonstrate that students in Latin America differentially respond to financially equivalent contracts to finance education depending on whether the contract is labeled a “loan.” In the United States, Field (2009) used an experimental design to explore the instances of loan aversion among law students at New York University. Students interested in careers in public service were randomly assigned to receive one of two financially equivalent aid offers: a loan to pay tuition that would be paid back by the school if the student ended up in public service or tuition assistance in the form of grants that students would have to pay back if they did not end up in public service law. Students who were offered the grants were twice as likely to enroll as students who were offered the loans and were 36% more likely to enter public-interest law within 2 years after graduation. Collectively, these findings suggest that a subset of prospective students is averse to borrowing due to framing and/or labeling effects.
In addition to behavioral economics, there are several sociological explanations for loan aversion. Prior negative experience in credit markets by students and their families could deter potential borrowers from taking on student debt. Although we are not aware of any evidence linking parental student loan debt with borrowing decisions, there is evidence that observed negative experiences with parental credit card debt is linked to negative perceptions of credit card usage (Joo, Grable, & Bagwell, 2003). If students observed their family’s struggles with debt, especially foreclosures during the 2007 housing market crash, they may wish to avoid future borrowing. This may also be true of adults who have had their own negative experiences in the credit market. Finally, it is possible that cultural differences in the preference for debt explain some of this difference. Research has found that Asian and Hispanic students are less likely to borrow for college than White students, suggesting possible racial differences in loan aversion (Cunningham & Santiago, 2008; ECMC Group Foundation, 2003; Hillman, 2015), although researchers continue to explore the reasons behind these trends. These preferences may apply to more than student loan debt and could affect other forms of borrowing as well. Our study attempts to shed light on this proposition by measuring borrowing attitudes generally and specific to higher education across a racially and socioeconomically diverse population of respondents.
Loan Aversion in the Education Literature
Some previous studies have hypothesized that loan aversion may affect students’ decisions about enrolling in college without providing empirical evidence that the phenomenon exists. St. John (1993) cites loan aversion as a possible explanation for why low-income students’ college enrollment is not associated with borrowing, and Paulsen and St. John (2002) state, “Latinos choose to attend colleges with lower costs and are more loan averse than other ethnic groups” (p. 211). Despite these arguments, neither paper offers evidence of loan aversion. Many other papers have also cited loan aversion as a potential explanation for student borrowing behavior (Avery & Turner, 2012; Dowd & Coury, 2006; Malcom & Dowd, 2012; Perna, 2008; Rothstein & Rouse, 2011), but none of these analyses have examined the extent of this phenomenon across different populations of respondents.
Only a handful of empirical studies help us understand how widespread the problem of loan aversion is or how it affects students’ decisions about college enrollment and financial aid. Qualitative studies have cited lower levels of borrowing among students as evidence of loan aversion (Burdman, 2005; Xue & Chao, 2015). This definition of loan aversion is unsatisfying as lower levels of borrowing could be explained by students attending lower-cost institutions or having unobserved resources used to finance higher education. Goldrick-Rab and Kelchen (2013) offer evidence that loan aversion exists among a specific population of college students in the United States by examining nearly 700 first-year Pell Grant recipients attending the public college system in Wisconsin. They identify students as loan averse if they either did not accept a loan offered in a financial aid package or responded on a survey question that they would not choose any loan aid if offered and conclude that 48% of their sample is loan averse by these two definitions. Although these measures may capture some degree of loan aversion, they may be biased. The students surveyed may have other unobserved financial resources that obviate borrowing, in which case the students labeled loan averse might be willing to borrow but simply find it unnecessary, leading to estimates biased upward. On the other hand, because the study samples only students who have already applied for financial aid and enrolled in college, it may underestimate loan aversion if it prevents potential students from enrolling in college entirely.
The two studies we rely upon most heavily in this paper use survey methods to explore loan aversion for students outside the United States. Callender and Jackson (2005) surveyed 1,954 prospective college students in England to explore the relationship between students’ attitudes toward debt and their college enrollment decisions. They find that students from low socioeconomic classes are more debt averse than those from other social classes, and this aversion deters their pursuit of higher education. Palameta and Voyer (2010) present 1,248 Canadian students in their final year of high school or 1st year of college with the option of accepting financial aid for college in the future versus accepting smaller amounts of cash in the present. Respondents chose between grants versus cash or combinations of grants and loans versus cash. The authors define loan aversion as the decision to take a grant only when it is stand-alone and not when it is offered in combination with an optional loan. Palameta and Voyer find that between 5% and 20% of the sample are loan averse, with a higher propensity among underrepresented groups (Aboriginals, boys, and students’ whose parents are not college educated).
Collectively, the empirical evidence on loans suggests somewhere between 5% and 50% of students or prospective students are loan averse and that loan aversion varies by individual characteristics, such as gender, race, and income, but not always in consistent ways. Furthermore, prior studies all use different measures of loan aversion and were conducted either outside the United States, only on traditional students, or only on a group of students who had already made the choice to enroll in higher education. Our paper addresses these limitations and makes important additional contributions to the literature on loan aversion. Using survey methods, we gather a unique data set comprising samples from three distinct populations (high school seniors, community college students, and adults without a degree who are not enrolled in college) and explore the concept of loan aversion using three different measures from the previous literature. By exploring respondents’ attitudes and choices about borrowing money generally and specifically for education, our study is the first to examine multiple measures of loan aversion in a variety of contexts for three distinct populations of potential and current college students.
Conceptualizing and Operationalizing Loan Aversion
Unlike previous studies that rely on a single measure or a response to a single question, we assess loan aversion in three distinct ways, thereby enabling broader content validity across multiple dimensions of loan aversion. Our three measures of loan aversion are based on (a) respondents’ attitudes toward borrowing, (b) respondents’ beliefs that it is acceptable to borrow money to pay for education, and (c) respondents’ preferences between cash and hypothetical financial aid packages that include grants alone or grants and loans combined. Below, we describe how we operationalize each of our three measures of loan aversion. For each measure of loan aversion, see online Appendix A for the specific question asked on the survey. Additional details about the survey instruments are available in the online Data Appendix.
Respondents’ Attitudes Toward Borrowing
A common hypothesis is that aversion to borrowing varies across race in large part due to cultural differences in the perception and value of money (Cunningham & Santiago, 2008; Lynn, 1991). If variation in attitudes can be explained by demographic characteristics, it lends support to this hypothesis. To measure these attitudes, we borrow directly from a survey used by Callender and Jackson (2005) to assess students’ debt attitudes in England. We include survey items that ask students to respond on a 5-poing Likert scale (strongly agree to strongly disagree) the extent to which they agree or disagree with three statements: “You should always save up first before buying something,” “Owing money is basically wrong,” and “There is no excuse for borrowing money.” These three statements vary in their severity, with the first allowing for a less aggressive stance on borrowing compared to the second and especially compared to the third. Therefore, answering strongly agree or agree for the last question should imply agreement with the earlier two. Indeed, we see a pattern of responses for these three questions that strongly suggest an ordered scale, with the coefficient of reproducibility for all three samples greater than 98%. As a result, we use Guttman scaling to create a debt-averse scale based upon the binary measures of answering strongly agree or agree on these three questions (hereafter termed Attitudes Scale). Responses are measured on a scale that ranges from 0 to 3, in which respondents who received a 0 displayed no loan-averse attitudes and respondents who received a 3 answered they agree or strongly agree with “There is no excuse for borrowing money,” the most severe statement.
A primary advantage of this measure is that it assesses general attitudes toward borrowing that can apply regardless of the scenario. This allows for a more holistic definition of loan aversion that is not specific to any one item or purchase. We also use a scaling technique to weight respondents’ answers, thus acknowledging the nuance in borrowing attitudes that may exist. A downside of this measure is that it is not directly related to a specific borrowing decision. As we are especially interested in respondents’ attitudes toward borrowing money for education, our second measure provides a more direct test of this particular decision.
Respondents’ Beliefs That It Is Acceptable to Borrow Money to Pay for Education
To further gauge respondents’ attitudes toward borrowing money, we supplement Callender and Jackson’s (2005) debt attitude questions with questions similar to those the Federal Reserve has used to collect data on consumer behavior. Mortenson (1988) conducted an analysis of willingness to borrow for educational expenses using borrowing questions from a nationally representative survey collected by the Federal Reserve. Specifically, we ask, “Do you think it is okay to borrow for education?” To test loan aversion for educational expenses, we define a respondent as loan averse if he or she did not answer yes to this question, a measure similar to the one Mortenson uses to identify loan-averse students (hereafter termed Borrow for Education).
An advantage of this measure is that it provides a direct assessment of a respondent’s attitude toward borrowing money for education; however, it does not capture attitudes toward borrowing more broadly. Since aversion to borrowing money for education is the specific phenomenon we strive to define and understand, the Borrow for Education definition is an important complement to Attitudes Scale.
Cash Versus Loans in Financial Aid Packages
Finally, we measure whether students avoid loans in financial aid packages. This measure has the advantage of identifying loan aversion specifically in the context of borrowing for college. Instead of simply asking respondents their attitudes about borrowing money generally (Attitudes Scale) or borrowing money for college (Borrow for Education), we asked respondents to make a series of choices between taking different amounts of cash or various financial aid packages. Following Palameta and Voyer (2010), survey respondents were asked, for instance, to choose whether they would prefer $300 in cash or a $1,000 grant when they enroll in college. Some of the financial aid packages include only grants, whereas others are a combination of grants and loans. We identify loan-averse respondents as those who chose financial aid offers over cash when the financial aid package consisted only of grants but accepted cash over financial aid when the financial aid package included loans (hereafter termed Avoid Loan Packages). For example, we define a respondent as loan averse if he or she prefers $1,000 in grants over $300 in cash but prefers $300 in cash over a financial aid package of $1,000 grants and $1,000 in loans. If the respondent did not need the additional loan money, he or she could immediately repay the loan and still have the $1,000 in grant aid. Therefore, there must be a characteristic of his or her preferences that makes the financial aid package with a loan less desirable than one with the same amount of grant aid but without the loan. If respondents change their preferences due to the inclusion of a loan, we define them as loan averse.
The advantage of this measure is that it is contextually situated in an actual decision people face when making choices about financial aid. The downside of this measure is that the question may be difficult to understand, casting doubt on its reliability. We observed 6.2% of the sample making unreasonable choices that suggest that they did not understand this question. 2 These respondents prefer a lower amount of cash over an aid package but then prefer the same aid package over a higher cash amount. We exclude these respondents for our Avoid Loan Packages measure throughout our analyses, although our findings are robust to their inclusion (results available upon request).
Methods and Data
Sample Selection and Data
We collected survey data from three different populations: high school seniors, community college students, and adults ages 20 to 39 without a college degree who were not currently enrolled in higher education. We sampled from three distinct populations because we hypothesize that the extent of loan aversion may vary by characteristics, including age, experience with higher education, and experience with the credit market. For example, as individuals age and have more experience with the credit market, this could make them more or less willing to borrow for education, depending on whether these experiences are positive or negative. The high schools were selected randomly across all racially diverse public high schools in Texas, Kentucky, Tennessee, and Massachusetts and supplemented with a diverse sample of community college students and adults. Ultimately, we surveyed 2,140 high school students, 4,278 community college students, and 843 adults.
To save time during the school day and reduce the survey burden on high school seniors, we used two different forms of the survey with slightly different question sets for the high school sample. Only one form measured our Borrow for Education loan aversion definition, so our sample for this measure is half the size of the others. We randomly assigned the two forms of the survey, thereby avoiding bias. Comparisons across 10 demographic characteristics between respondents from the two survey forms show only one statistically significant difference, reassuring us that the randomization process was successful. Additional details about the sampling methodology are available in the online Data Appendix (including an analysis of missing data).
Descriptive Statistics
Descriptive statistics for each of our three analytic samples are displayed in Table 1. Our primary sampling goal was to reach a racially diverse set of respondents as well as a diverse sample based on gender, age, and other demographics to enable subgroup analysis of loan aversion. Although our high school sample includes an even distribution of male and female students, we had many more women complete the survey in the community college and adult samples (over 70% female for both). Our community college sample is also disproportionally White (45% compared to 35% for the high school students and 28% for the adults). This is not surprising because, although we chose community colleges that had diverse populations, we did not explicitly sample on race among community college sites. Despite not sampling on race, the racial demographics of our community college sample are representative of community colleges nationwide. Our community college sample includes 45% White respondents, 10% Black respondents, and 29% Hispanic respondents, compared to the national enrollment averages for American community colleges of 49% White, 14% Black, and 22% Hispanic (National Center for Education Statistics, 2014). The racial breakdown of our high school and adult samples are also roughly reflective of national numbers, with lower rates of White and higher rates of Black respondents (53% White, 15% Black, 23% Hispanic for high school seniors nationally and 50% White, 16% Black, 28% Hispanic for 18- to 40-year-old adults without a college degree nationally). 3
Sample Summary Statistics

Note. Sample size for high school borrowing for education loan-aversion definition is 823. Standard deviations are reported in parentheses for nonbinary variables. Low income is defined for high school seniors as those who reported being eligible for free or reduced-price lunch and for the community college and adult samples as having received a form of federal assistance within the past 2 years (Pell; Temporary Assistance for Needy Families; Special Supplemental Nutrition Program for Women, Infants, and Children; or Supplemental Nutrition Assistance Program).
We also sought a sample of low-income students at least as socioeconomically disadvantaged as the national average. Respondents in the high school sample are defined as low income if they receive free or reduced-price lunch, and over 46% of them did relative to 36% of all seniors nationally. Respondents in the community college and adult samples are defined as low income if they received any of the following forms of federal public assistance within the past 2 years: Pell; Temporary Assistance for Needy Families; Special Supplemental Nutrition Program for Women, Infants, and Children (WIC); or Supplemental Nutrition Assistance Program. Nearly 55% of community college respondents were low income compared with 38% nationally who receive federal education grants, and approximately 42% of the adult sample is low income relative to 45% at 185% of the federal poverty line nationally (the qualifying level for WIC). All three samples have high aspirations to obtain postsecondary degrees. Although adults who are not enrolled in college are less likely to aspire to obtain a degree than the other two samples, over 68% hope to earn at least an associate’s degree. This indicates a high likelihood that some portion of the adult sample will face the future decision to borrow for education. Parental education is similar across the high school and community college samples (60% to 65% have a parent who attended college). The adult sample comes from families with noticeably less educational attainment.
Empirical Strategy
We first examine each of the above three measures of loan aversion (Attitudes Scale, Borrow for Education, and Avoid Loan Packages) individually across each of the three samples and use ANOVA and Bonferroni post hoc tests to formally test whether loan aversion varies across these samples. We then explore the relationship across these measures to see if or how they might be related to one another by examining the correlation between each measure in each sample. We also explore whether the existence of loan aversion varies across student characteristics first by using t tests to compare each of the loan aversion measures by student characteristics. To simultaneously control for all of our demographic characteristics, we then run the following regression model separately for each of the three populations:

in which Averse is one of our three measures of loan aversion for student i in high school or community college j (adults are not indexed by j). Student_characteristics is a vector that includes dummy variables for gender, race (with White as the omitted category in the regressions), citizenship, low-income status, whether the respondent’s parents attended college, and whether his or her parents graduated from college. Models for the high school sample also include the respondent’s self-reported GPA to account for the fact that some loan aversion may be driven by poor academic performance reducing the likelihood of pursuing higher education. We did not collect this information for community college students, which is a limitation, but as they have already enrolled in higher education, we do not believe it likely that academic performance in college is a strong driver of loan aversion. For the community college sample, we include several measures of financial aid dependency status, including binary measures for being married, having children, having a dependent other than a child, being active-duty military, and being a veteran. These controls are theoretically important given research suggesting that those with more children are more likely to have favorable attitudes toward credit, and married individuals are more likely to have installment loans, such as student loans or car loans (Chien & Devaney, 2001). Although we do not observe marital status, dependents, and military status for the high school and adult samples, these characteristics are unlikely to vary much for high school seniors. These variables serve as omitted variables for the adult sample; however, the inclusion of these variables for the community college students only slightly attenuates the coefficients, so we believe any bias is very small (community college results available from the authors upon request). Fixed effects for high school or community college are included as γ j . Regression standard errors are clustered at the high school level for the high school sample and the college level for the community college sample.
Results
To What Extent Is Loan Aversion Present Among High School Students, Community College Students, and Adults Not Enrolled in College?
In Tables 2, 3, and 4, we present the proportions of respondents who are loan averse by our three measures across each of the three samples. Our first measure, Attitudes Scale, is derived from the survey responses to three statements about borrowing money generally. As shown in Table 2, the majority of respondents in all three samples believe one should always save up first before buying something, the weakest of the three statements. A smaller but still substantial number of respondents in each sample (between 8% and 12%) agree with the most severe statement, that “there is no excuse for borrowing money.” When we use Guttman scaling to combine these three responses into a 0-to-3 scale score, we find that loan aversion, as defined by attitudes about borrowing money, exists for all three samples. By this definition, the adult sample is the most loan averse, followed by the high school respondents and the community college respondents. A one-way ANOVA demonstrates that the differences between samples are statistically significant, and the Bonferroni post hoc tests demonstrate that the differences between each pairing are statistically significant.
Loan Aversion Measure: Attitudes Scale

Note. The first three rows report the proportions of each sample that agree or strongly agree with each statement. The Attitudes Scale row provides the means and standard deviations of the Guttman scale for the three attitudes questions.
Bonferroni posttest reveals significant differences between each pair (p values < .001).
Loan Aversion Measure: Borrow for Education

Note. The table reports the proportions that did not answer yes to the question, “Do you think it’s okay to borrow money to pay for education?” This question was posed to only half of the high school sample, hence the lower sample size relative to Table 1.
Bonferroni posttest reveals significant differences between high school and community college samples and between community college and adult samples (p values < .001) but no difference between high school and adult samples (p value = .604).
Loan Aversion Measure: Avoid Loan Packages (Unreasonable Responses Excluded)
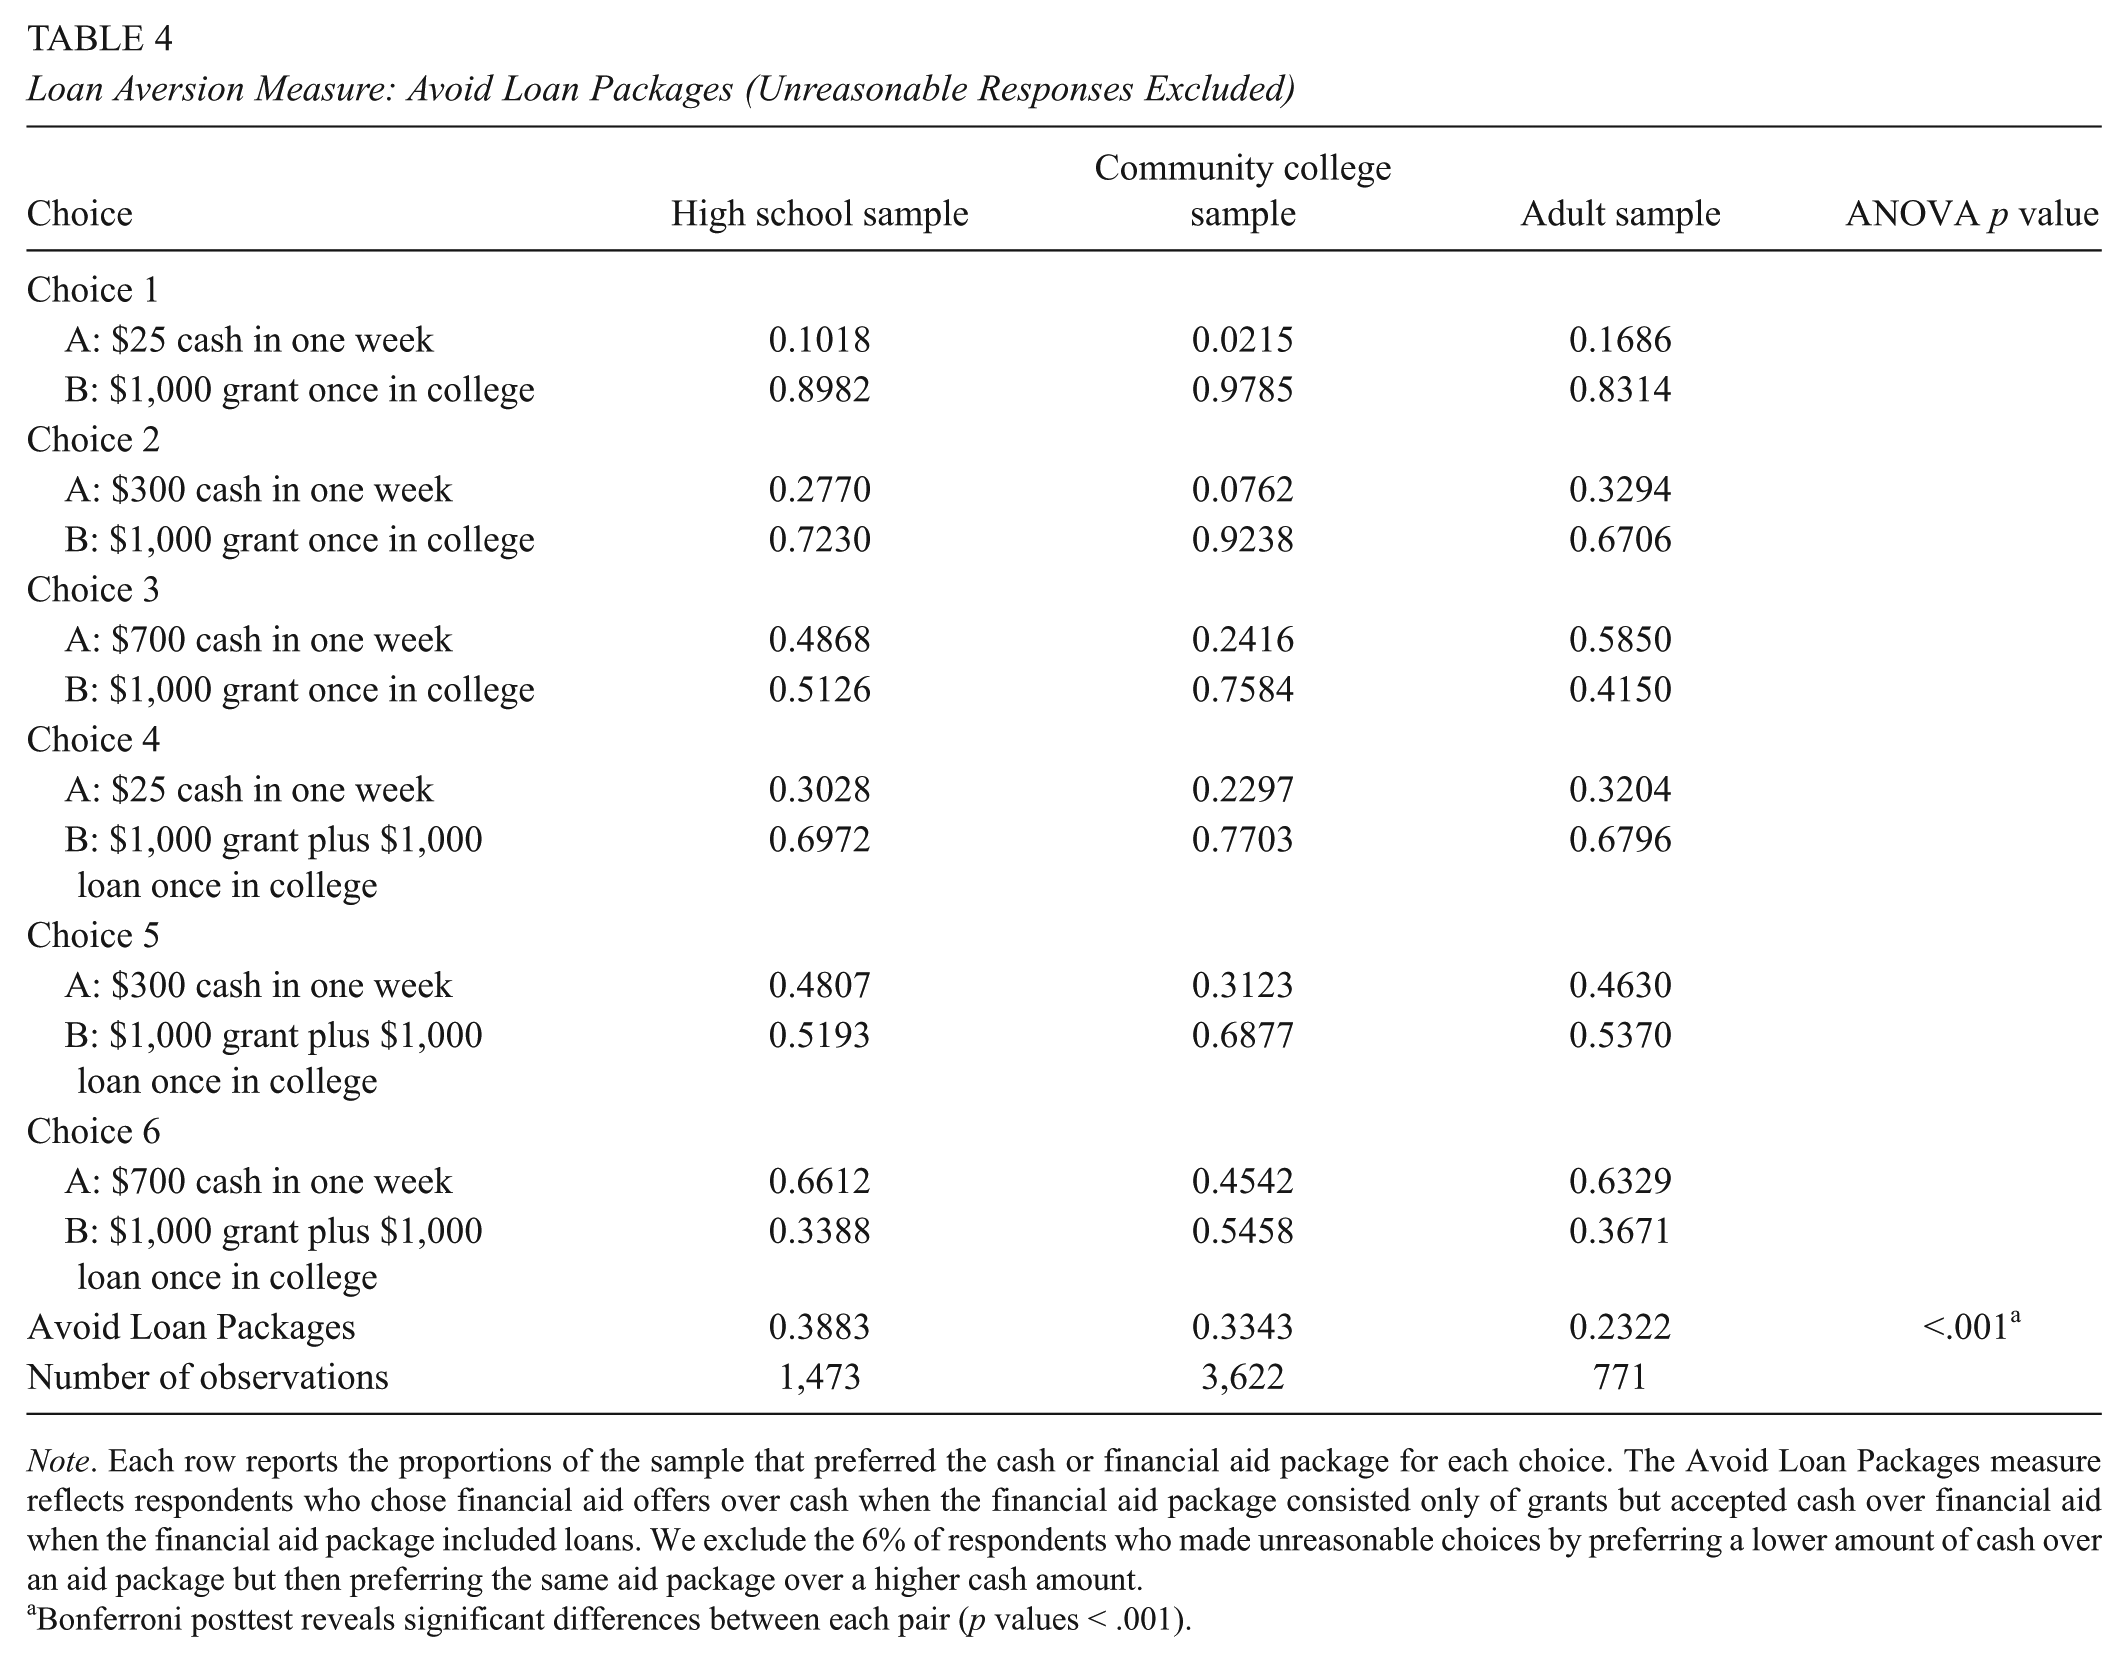
Note. Each row reports the proportions of the sample that preferred the cash or financial aid package for each choice. The Avoid Loan Packages measure reflects respondents who chose financial aid offers over cash when the financial aid package consisted only of grants but accepted cash over financial aid when the financial aid package included loans. We exclude the 6% of respondents who made unreasonable choices by preferring a lower amount of cash over an aid package but then preferring the same aid package over a higher cash amount.
Bonferroni posttest reveals significant differences between each pair (p values < .001).
Moving to a definition of loan aversion that centers on education (Borrow for Education), Table 3 demonstrates that loan aversion exists in all three samples but to varying degrees. Twenty-one percent of high school students do not think it is okay to borrow money to pay for education, compared to 20% of adults and 9% of community college students. We expected community college students to exhibit less loan aversion when asked explicitly about borrowing for education given that over half of the respondents (55%) reported on a separate survey question that they had borrowed some amount of money to attend. Approximately one in every five high school seniors and adults who are not in college do not believe it is okay to borrow for education. ANOVA results allow us to conclude the community college sample has significantly lower loan aversion by this measure but that there is no difference between the high school and adult samples. The results of this question suggest that a substantial number of high school seniors and adults not in college may be deterred from investing in higher education because of their desire to avoid borrowing.
Table 4 demonstrates that an even larger percentage of each sample may be defined as loan averse when loan aversion is defined by their choices between various financial aid packages and cash (Avoid Loans Packages). Given the complexity of this question, we first examined whether any students made sets of decisions that would suggest they did not understand the prompt. We examined how many students stated they preferred a smaller amount of cash to an aid package but that same aid package compared to a larger amount of cash. There were 175 high school seniors, 138 community college students, and 72 adults who made these types of errors. When these respondents are excluded, the results suggest that nearly 39% of the high school sample, over 33% of the community college sample, and over 23% of the adult sample preferred a financial aid package to cash when the package included only a grant but switched to preferring the cash when a loan was added to the aid package. ANOVA results suggest the differences between samples are all statistically significant.
By all three measures, loan aversion appears to exist and at quite high rates across all three samples of respondents.
What Is the Relationship Between Different Measures of Loan Aversion?
For this research question, we aim to demonstrate whether our various measures of loan aversion are related to one another. Table 5 shows the correlations across the three different measures of loan aversion for each of the three samples. In general, our measures of loan aversion are only weakly correlated with one another. The Attitudes Scale and Borrowing for Education are correlated, with ρ of between 0.23 and 0.25 for the high school and community college samples but only a value of 0.09 for the adult sample. Avoid Loan Packages is poorly correlated with both other measures across all three samples.
Correlation Across Loan Aversion Measures

Note. Unreasonable responses for the Avoid Loan Packages measure are excluded in correlations with that measure.
We hypothesize that the three measures of loan aversion that we describe are not highly correlated because they measure different dimensions of loan aversion in different contexts. For example, the Attitudes Scale combines attitudes toward borrowing for multiple types of purchases, including borrowing to buy a home and borrowing for education. Some respondents may be averse to borrowing to finance higher education (as captured in the Borrow for Education measure) but may not be concerned about taking out a mortgage in order to purchase a home. Finally, for the third measure (Avoid Loan Packages), survey respondents who did not appear to be loan averse when asked in the abstract about their attitudes toward borrowing in the Attitudes Scale or Borrow for Education measure may be loan averse when faced with the actual prospect of taking out a loan. We discuss this phenomenon in greater detail in the Discussion section.
Does Loan Aversion Vary by Demographic Characteristics?
In Table 6, we examine the heterogeneity of our three loan aversion measures across demographic characteristics for each sample using t tests to compare the conditional means. The top panel of Table 6 shows the difference in means from tests of the hypothesis that there is no difference across these student characteristics for each of our three measures of loan aversion for the high school sample. The sign of the mean difference indicates the direction of loan aversion for the named category (i.e., a negative sign implies that group is less loan averse). The middle panel displays the results for the community college sample, and the bottom panel displays the results for the adult sample. These hypothesis tests suggest that there are differences in loan aversion across student characteristics and that these differences are not necessarily consistent across measures or samples. For example, low-income high school seniors are more likely to be loan averse by our first measures (although only marginally significant) but not by the second or third measures. We find no evidence of differences in loan aversion by income in the other two samples. By gender, the t tests suggest that females are less loan averse by the Attitudes Scale and Borrow for Education measures in the high school and community college samples but more loan averse by the Avoid Loan Packages measure. In the high school and community college samples, respondents who report having parents that attended college are less loan averse than those who do not by the Attitudes Scale and the Borrow for Education measure. White students are notably less loan averse than Hispanic students across all three scales in both the high school and community college samples, but in the adult sample, White respondents are less loan averse than Hispanic respondents only on the Avoid Loan Packages measure.
Differences in Conditional Means From Test of the Hypothesis That the Difference Is Zero

Note. Each cell reports the mean difference between 1 and 0 for the binary variable where 1 is the named group. The three binary race variables are in reference to White students only.
Unreasonable responses for the Avoid Loan Packages measure are excluded for that measure.
p < .10. **p < .05. ***p < .01.
Although Table 6 directly answers our third research question and demonstrates loan aversion differs across demographic characteristics, conducting a regression analysis to account for the partial correlations across these multiple demographic characteristics may lend additional insight. Perhaps the result that Hispanic respondents are more loan averse than White respondents is actually driven by lower parental education or citizenship status, leading us to the incorrect conclusion that race is a driving factor behind loan aversion. Or perhaps the high school results are driven by a group of poor academic performers who do not envision pursuing higher education. Controlling for GPA mitigates that concern. The regression analysis presented in Table 7 enables us to determine which characteristics are associated with loan aversion while controlling for all other observed characteristics.
Heterogeneity of Loan Aversion Measures by Demographic Characteristics
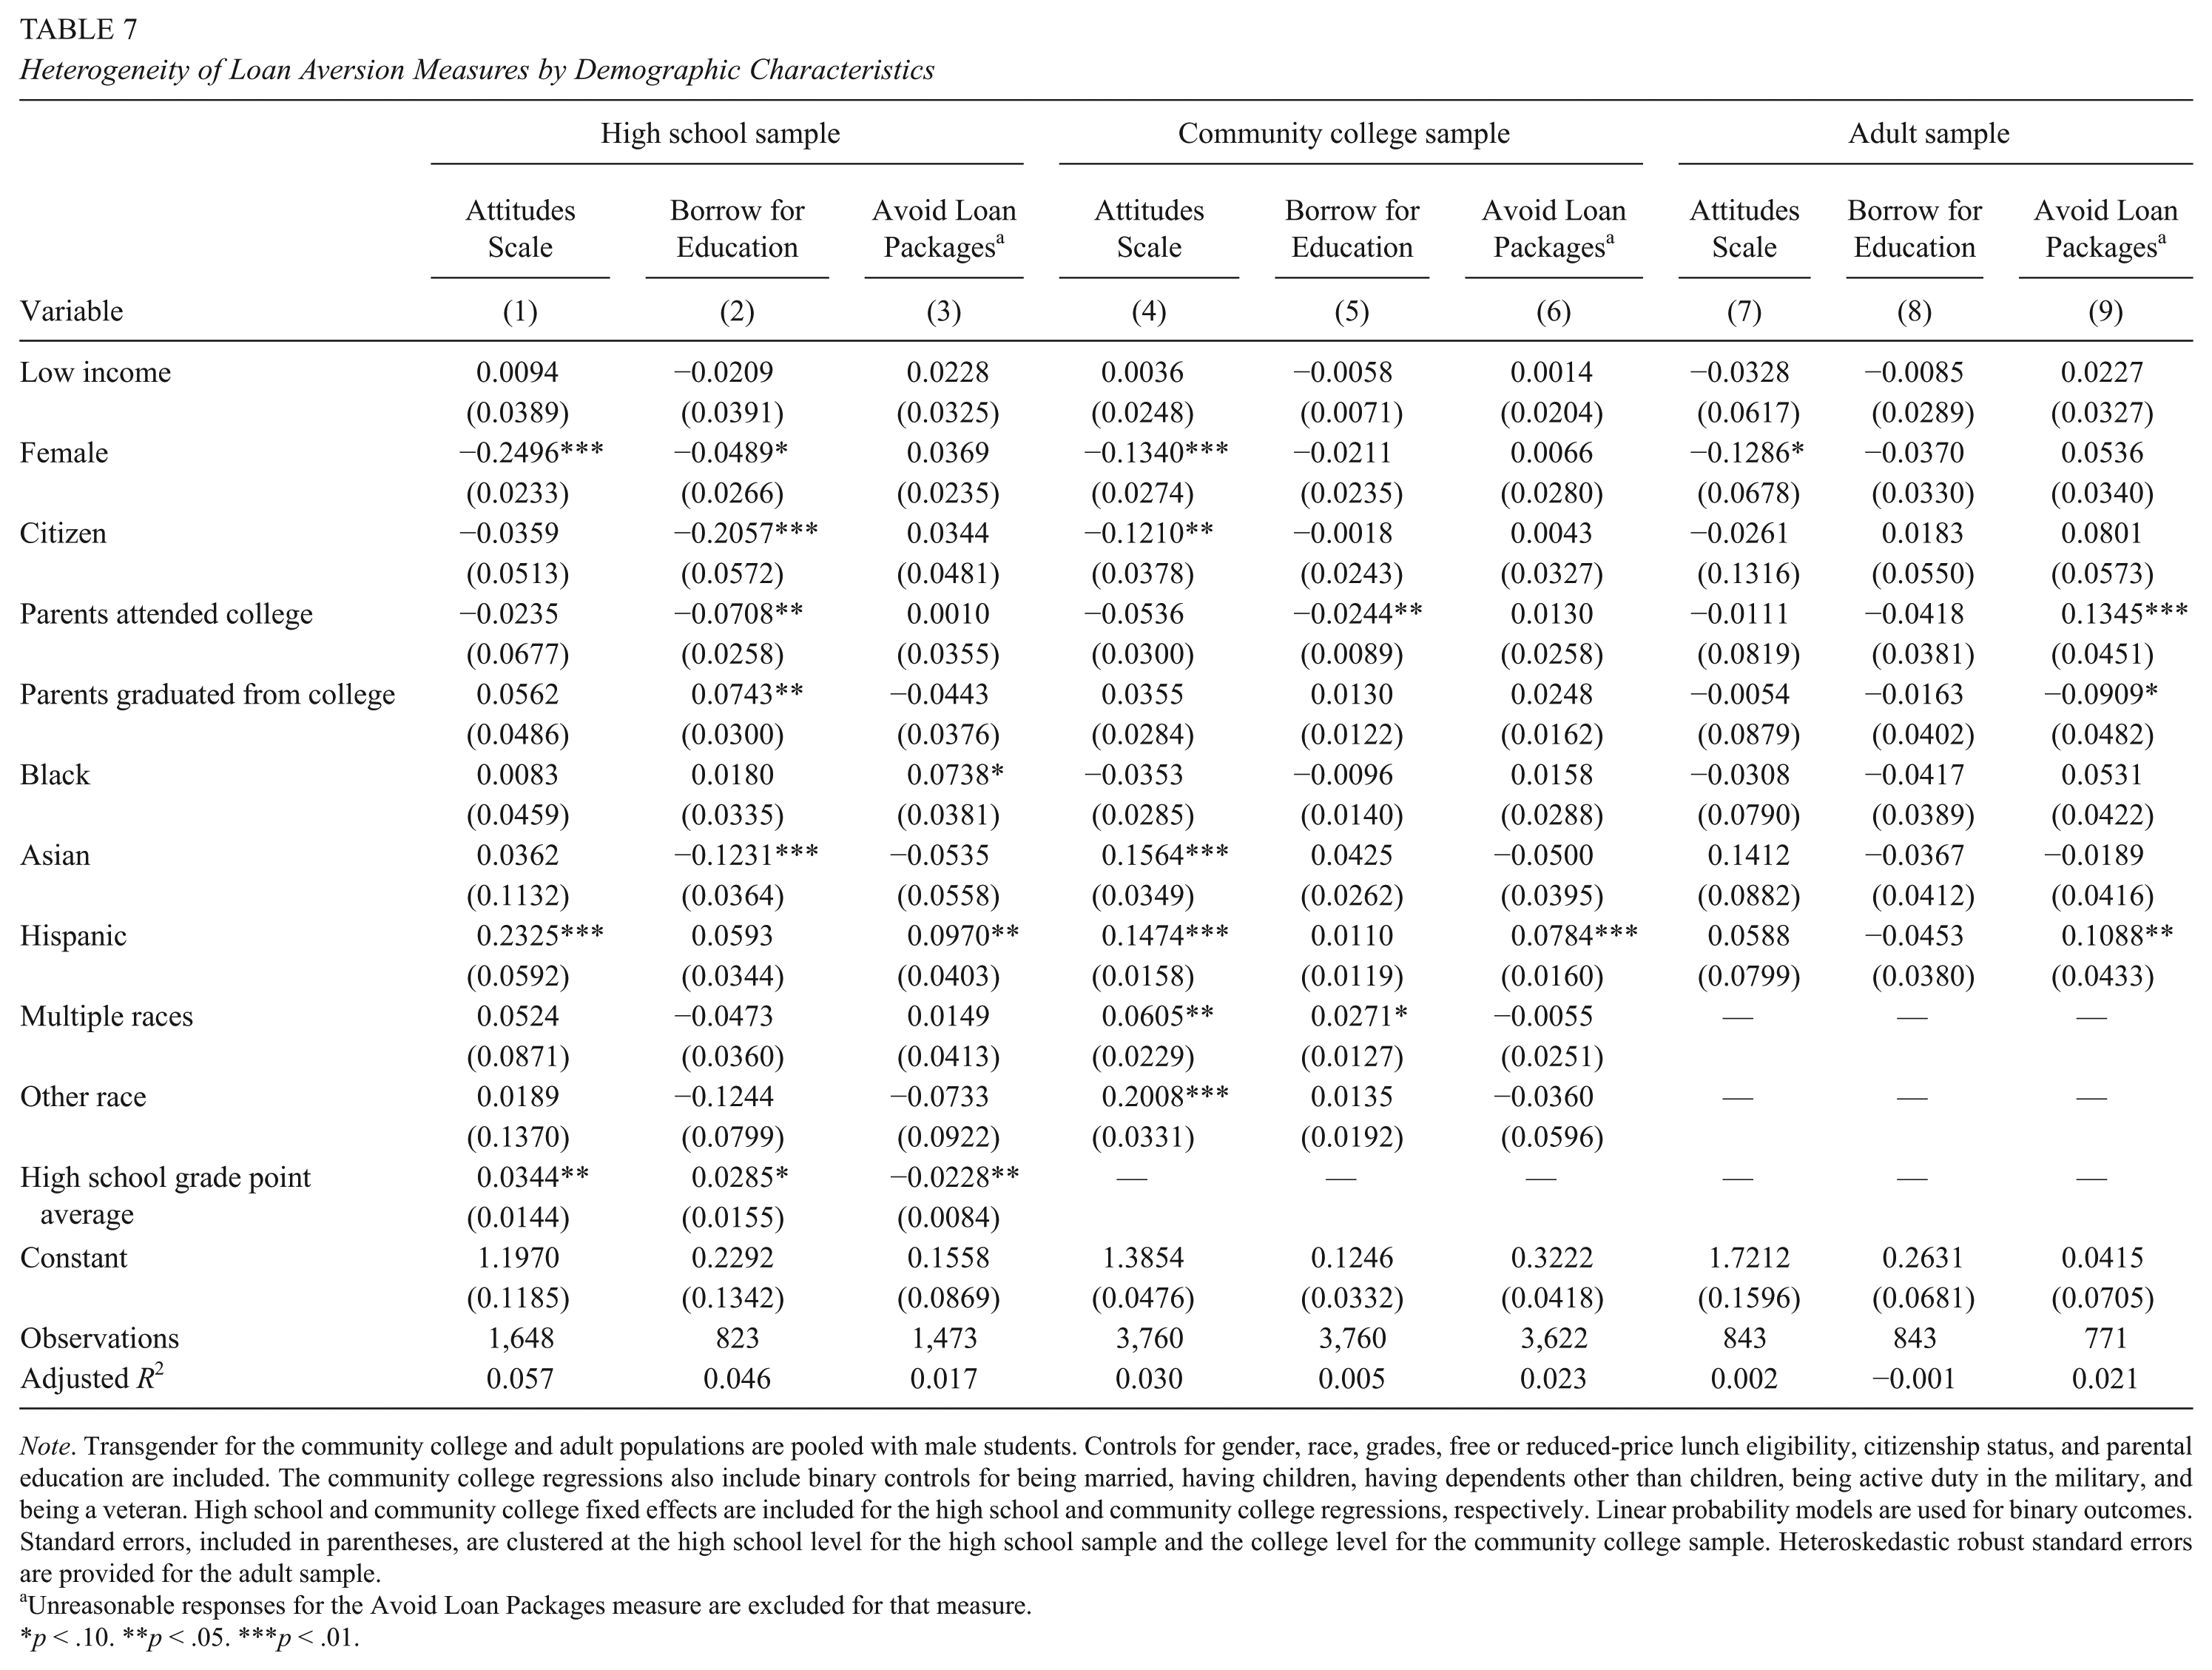
Note. Transgender for the community college and adult populations are pooled with male students. Controls for gender, race, grades, free or reduced-price lunch eligibility, citizenship status, and parental education are included. The community college regressions also include binary controls for being married, having children, having dependents other than children, being active duty in the military, and being a veteran. High school and community college fixed effects are included for the high school and community college regressions, respectively. Linear probability models are used for binary outcomes. Standard errors, included in parentheses, are clustered at the high school level for the high school sample and the college level for the community college sample. Heteroskedastic robust standard errors are provided for the adult sample.
Unreasonable responses for the Avoid Loan Packages measure are excluded for that measure.
p < .10. **p < .05. ***p < .01.
After adding the full set of controls, the conditional mean findings for low-income and citizenship observed for the high school sample are attenuated, and most become insignificant, but other results largely hold with our findings from the t tests. Female respondents are less loan averse than males on the Attitudes Scale, those whose parents attended college appear less loan averse on the Borrow for Education measure in the high school and community college samples, and Hispanic respondents are generally more loan averse than White students. In the high school sample, respondents who report having parents who attended college are approximately 7 percentage points less likely to be loan averse, on average, by the Borrow for Education measure, and in the community college sample, they are approximately 2.5 percentage points less likely to be loan averse, on average. This makes sense if respondents learn about financial aid for college from their parents’ experiences. In the high school sample, we find that Black respondents are approximately 7 percentage points more likely to be loan averse, on average, by the Avoid Loan Packages measure than White students.
Hispanic respondents are more loan averse by the Avoid Loan Packages measure across all three of our samples. Across our samples, Hispanic students are between 8 and 11 percentage points more likely to be loan averse by the Avoid Loan Packages measure than White students, on average. In both the high school and community college samples, Hispanic respondents are also more loan averse by the Attitudes Scale measure. There is no difference in the Borrow for Education measure.
Across samples, females exhibit less loan aversion on the Attitudes Scale than male students. In the high school sample, females are also slightly less loan averse on the Borrow for Education measure. These collective findings suggest women may have less loan averse attitudes, but those do not play out in measures more closely related to actual borrowing (Avoid Loan Packages).
We also broadly note that the adjusted R-squared for each regression is quite low despite the inclusion of institution fixed effects and a host of demographic controls. This suggests that, although we find several important demographic predictors of loan aversion, most of the variation in loan aversion is idiosyncratic and not explained by our observed demographic variables.
Discussion and Conclusion
Although policymakers and researchers speak of the existence of loan aversion and its variation across racial groups (Cunningham & Santiago, 2008), there is little quantitative research on the topic of loan aversion in the United States. In this study, we provide the first large-scale quantitative evidence of levels of loan aversion in three different populations within the United States. We rely on three different measures of loan aversion to assess how measures previously used in the literature relate to one another. We find that loan aversion is prevalent and varies by population and race, with Hispanic respondents more likely to exhibit loan aversion than White respondents. We also find that the three different measures of loan aversion that we examined were not highly correlated with one other, suggesting that loan aversion is a complex construct with multiple dimensions and that it varies by context.
Our findings both extend and add to those in the extant literature. Because we replicated survey questions from Callender and Jackson (2005), our definitions of loan aversion are directly comparable to prior research, albeit in a different context (the United States vs. United Kingdom). The main finding of their study is that students from lower socioeconomic groups in the United Kingdom are more loan averse than middle- and upper-class students. In the United States, we find no evidence that low-income respondents express greater loan-averse attitudes after controlling for other factors. This remains true on both of the other measures of loan aversion we employ as well as across all three of our samples.
Directly replicating the Avoid Loan Packages questions that Palameta and Voyer (2010) used to explore loan aversion among a sample of study participants in Canada allows for another direct comparison. These authors found between 5% and 20% of their sample (Canadian high school students likely to enroll in college) were loan averse. We find a much larger portion of all three populations in our study is loan averse by this same measure (between 23% and 39%). This difference could be attributable to higher loan aversion rates in the United States or higher loan aversion rates among people less likely to enroll in college, although we find high rates among community college students who are already enrolled in college. It is important to recognize the radically different cost and financing structure of attending postsecondary education in the United States relative to both the United Kingdom and Canada, which may explain why American respondents are more loan averse. In addition, for Canadian respondents, the survey was attached to actual financial outcomes, which presumably elicits more accurate responses. However, we think it is unlikely that respondents have an incentive to overestimate their true avoidance of loan packages in our survey.
The domestic study most similar to ours relies on a sample of students currently enrolled in college and measures loan aversion by assessing whether students did not accept a loan offered to them either on a survey or in an actual financial aid package (Goldrick-Rab & Kelchen, 2013). Forty-eight percent of that sample exhibited loan aversion by the authors’ measures, whereas we find high but somewhat lower percentages using a more diverse sample. Thirty-three percent of our sample of enrolled community college students are loan averse by the Avoid Loan Packages measure. This difference could be attributable to regional variation (Wisconsin vs. Tennessee and Texas), 4-year versus 2-year enrollees, low-income versus middle- and upper-income students (although we find no evidence of differences by income), or the slight difference in measures. Regardless, our findings suggest that focusing only on enrolled students underestimates loan aversion. Using our most direct measure, Borrow for Education, about 20% of high school seniors and adults who have not attended college do not believe it is okay to borrow money for education, a rate double that of students already enrolled in community colleges. This attitude likely contributes to some students’ avoiding borrowing and, in some instances, underinvesting in higher education by not enrolling at all.
Although the goal of this paper is not to explain why respondents are loan averse, we can explore a few rationales offered in the prior literature. First, we provide empirical evidence that Hispanic respondents are more likely to be loan averse than White respondents, even after controlling for a host of other observed characteristics. As cited above, the prior literature has frequently hinted that the observed differences in borrowing by race is due to loan aversion, but our study is the first to document this empirically at scale. This finding suggests there is a cultural component to the borrowing decision that deserves further exploration.
One of our most interesting findings is that measures of loan aversion used in previous literature are not highly correlated with one another. This finding that our three measures of loan aversion are not well correlated has implications for loan aversion research. First, it suggests the loan aversion papers in the existing literature may not be directly comparable to one another. It also suggests that future loan aversion studies should assess loan aversion through multiple measures in an effort to sort out the distinctions between this construct’s dimensions and capture the full extent of the phenomenon.
Although this study contributes to our understanding of loan aversion among three populations of students or potential students in the United States, we acknowledge several limitations. First, there were no stakes attached to our survey. As a result, respondents may not have considered each question as carefully as they would have in a high-stakes situation. Although this may incorporate some error into our measures, it is unlikely that it systematically biases any of our estimates. Additionally, our survey may be subject to sources of bias that affect its reliability. For example, students may not have understood all the questions, although we did try to ameliorate this problem with the pilot tests, and there is evidence of only a small percentage of respondents who misunderstood the Avoid Loan Packages question. Another important limitation of this study is that we do not observe actual higher education outcomes for our survey respondents. A promising avenue for future research is to connect loan aversion measures with college outcomes, such as debt load and college enrollment and persistence. Such data would allow researchers to determine whether student loan aversion affects college enrollment and persistence. We also acknowledge that although the community college and adult samples are diverse, they were not randomly selected and may not generalize to the larger population of community college and adults across the United States.
Despite these limitations, our findings have important implications for policies related to financing higher education. To the extent that loan aversion is driven by excessive risk aversion, it may be alleviated by educating students about forms of income-based repayment. Income-based loan repayment programs dramatically reduce the risk of student loan default by limiting the repayment amount to a small portion of disposable income. Although more students are enrolling in forms of income-based repayment, such as the federal government’s Pay as You Earn program, information about these forms of repayment must be presented at the time students are considering the borrowing decision, not only at the time of repayment. Knowing that loan aversion exists among Hispanic respondents, focusing communication efforts on income-based repayment programs could help these prospective student populations make more informed decisions regarding borrowing money for college, potentially leading to higher rates of college-going and degree attainment. Additionally, policymakers and administrators may consider adjusting the framing of student loans by, for instance, removing the principal balance of the loan and relying on income share agreements, such as Oregon’s proposed Pay It Forward plan. Because it no longer requires borrowing in the traditional sense, loan-averse students may prefer income share agreements as a way to finance higher education.
Finally, policymakers may wish to consider alternatives to the growing reliance on student debt to finance higher education. One avenue to reducing the need to borrow is increasing public expenditures on education either through tuition subsidies or grant aid so that a greater proportion of students can finance higher education without needing to borrow. Several wealthy institutions, such as Princeton and Vanderbilt Universities, have endeavored to minimize borrowing through no-loan policies that commit large sums of institutional grant aid to replace loans in financial aid packages. An expansion of this commitment through either public or private financing would simultaneously relieve the growing debt burden and resolve loan aversion.
Footnotes
Acknowledgements
The authors wish to thank Karla Coleman for her outstanding research assistance, and the Lumina Foundation for its financial support of this work. The views expressed in this publication are those of the authors and do not necessarily represent those of Lumina Foundation, their officers, or employees.
Notes
Authors
ANGELA BOATMAN is an assistant professor of public policy and higher education at the Peabody College of Education and Human Development, Vanderbilt University, PMB 414, 230 Appleton Place, Nashville, TN 37203; email
BRENT J. EVANS is an assistant professor of public policy and higher education at the Peabody College of Education and Human Development, Vanderbilt University, PMB 414, 230 Appleton Place, Nashville, TN 37203; email
ADELA SOLIZ is an assistant professor of public policy and higher education at the Peabody College of Education and Human Development, Vanderbilt University, PMB 414, 230 Appleton Place, Nashville, TN 37203; email
References
Supplementary Material
Please find the following supplemental material available below.
For Open Access articles published under a Creative Commons License, all supplemental material carries the same license as the article it is associated with.
For non-Open Access articles published, all supplemental material carries a non-exclusive license, and permission requests for re-use of supplemental material or any part of supplemental material shall be sent directly to the copyright owner as specified in the copyright notice associated with the article.