
Abstract
The shortage of special education teachers (SETs) is a persistent challenge in the United States, but less is known about two other important issues that affect students with disabilities: racial diversity within the SET workforce and the distribution of SETs. Using administrative data on all teachers in California from 1997 to 2014, we examine the racial composition and distribution of teachers with special education credentials. Our results from descriptive and regression analyses show that while teachers with special education credentials remain majority White, the number of teachers of color with special education credentials has increased at a rate more than twice that of general education teachers and special education students of color. We also find that much of the distribution of teachers with special education credentials occurs across districts within the same regional county, while disparities in teacher qualifications are larger by school poverty, racial composition, and student achievement. The results have policy implications for improving diversity and educational equity within the special education workforce.
A concern closely related to students’ access to racially diverse SETs is the availability of SETs with appropriate training and qualifications. Highly effective teachers have been linked to positive long-term outcomes for children overall (Chetty, Friedman, & Rockoff, 2014), and research indicates that children with disabilities achieve higher test scores when taught by teachers with SET certification (Feng & Sass, 2013). Unfortunately, schools characterized by poverty and high rates of racial minorities are less likely to attract qualified teachers (Clotfelter, Ladd, & Vigdor, 2005; Lankford, Loeb, & Wyckoff, 2002). Although these disparities in the distribution of general education teachers have been well documented, the extent of SET sorting across schools, districts, and counties is less clear. An understanding of whether the variation in teacher qualifications exists among schools within districts or simply across districts is critical for improving SET recruitment and hiring policies that can ensure that SETs are distributed equitably at the appropriate school and district levels. The former may require policy change among district leaders, while the latter suggests the need for state-level initiatives to distribute SETs more equitably across regions. Focusing on the distribution of SETs is also relevant for understanding how to improve student access to SETs of color beyond increasing the supply, especially if teachers of color are more likely to select specific geographic areas (Reininger, 2012).
In this study, we investigated changes in the racial composition of the SET workforce in California from 1997 to 2014 and the distribution of SETs by professional characteristics. We focused on SETs in California because the state serves the largest and one of the more racially diverse special education populations in the country. Using data on all teachers with special education credentials over the last 18 years, this study is one of the first to document changes in the racial composition of the SET workforce over an extended period and assess whether calls for SET diversity during previous amendments of IDEA have succeeded (Patton et al., 2003). We also extend previous work that has examined the distribution of SET quality in high-poverty schools (Mason-Williams, 2015), by simultaneously assessing the extent of variation in SET qualifications at the school, district, and county levels. We further link teacher and school records to analyze differences in SET quality by school characteristics. Overall, the state context allows us to probe deeper into the extent to which the degree of inequality in the distribution of SETs may affect the educational opportunities and legal rights of students with disabilities.
Background
Racial Diversity and the SET Workforce
Nearly 83% of all teachers in the United States identify as White, with 7% as Hispanic, 7% as Black, and 2% as Asian (Aud et al., 2011). Research indicates progress in diversifying the teacher workforce, as the total number of teachers of color has doubled over the last 20 years (Ingersoll & May, 2011). However, the workforce remains majority White and contrasts with a student population that has become more diverse. Currently more than 40% of students are students of color (Snyder & Dillow, 2015), but the total number has increased by nearly 75% from 1988 to 2008 (Ingersoll & May, 2011). These trends are also reflected in special education, where students of color are 46% of the population (Snyder & Dillow, 2015), which has increased nationally by 25% from 2000 to 2010. Data from the Schools and Staffing Survey (2011) indicate that about 15% of SETs are teachers of color, slightly less than non-SETs.
The racial disparities in the student and teacher population have led to a push for the increased recruitment of teachers of color (U.S. Department of Education, 2016b), often based on two rationales about equity and learning. The first rationale stems from the view that public institutions should reflect the composition of society. Schools, in this case, “should look like America” (Tyler et al., 2004, p. 23). Social institutions such as schools should also make attempts to include groups that have been historically marginalized and excluded from equal opportunities in the labor market. In special education, this movement was reflected in IDEA amendments of 1990 and 1997 that called for an increase in the number of underrepresented groups in teacher education programs (Patton et al., 2003). Research shows that the percentage of undergraduates who are students of color has increased from 21% in 1990 to 43% in 2014 (National Center for Education Statistics, n.d.), suggesting that more students of color are attending college but not necessarily entering teaching.
The second rationale relates to the benefits of diversity to the teacher workforce and students. The U.S. Department of Education (2016b) argues that “we are stronger as a nation when people of varied backgrounds, experiences, and perspectives work and learn together; diversity and inclusion breeds innovation” (p. 1). Research shows that teachers of color can serve as positive role models who challenge negative stereotypes for all students while improving academic outcomes (Dee, 2004; Egalite, Kisida, & Winters, 2015). Other studies have found that teachers of color are more likely to have higher expectations of students of color (Grissom & Redding, 2016) and develop more trusting relationships (Villegas & Irvine, 2010).
Within special education, more teachers of color may help address the persistent challenges of racial disparities in student referral for services. Indeed, the lack of teachers who understand the cultural backgrounds and behaviors of students has been cited as a potential source of the overidentification students of color in special education (Artiles, Harry, Reschly, & Chinn, 2002) and school disciplinary practices for students with disabilities (Sullivan, Van Norman, & Klingbeil, 2014). However, federal data showing the past and current overrepresentation of students of color in special education (i.e., U.S. Department of Education, 2015b) have been challenged by recent works (Hibel, Farkas, & Morgan, 2010; Morgan et al., 2015). Studies based on richer student-level data have revealed that students of color are underrepresented relative to White peers in special education, when controlling for student background differences. Underrepresentation raises the concern that students of color, when statistically similar to White students, are overlooked for special education services. While it is unclear why students of color are underrepresented in these studies, one possibility is that these students lack cultural advocates within schools who understand their special needs. The debate about whether students of color are under- or overrepresented in special education is an ongoing one (see response from Skiba, Artiles, Kozleski, Losen, & Harry, 2016), but these disparities support the need for more SETs of color to ensure that students of color are appropriately identified for special education.
Distribution of SETs
Although qualified teachers in terms of experience, education, and training are generally recognized as important school-based inputs associated with student achievement, the challenge is ensuring that students have access to such teachers. Unfortunately, research on teacher employment indicates that experienced teachers with higher qualifications tend to select schools with easier-to-serve populations, particularly those where student poverty and racial minority rates are low and achievement levels are high (Clotfelter et al., 2005; Lankford et al., 2002). In special education, an unequal distribution of SETs challenges the provision of a free and appropriate public education to students with disabilities and the requirement that all teachers are highly qualified under IDEA (Yell & Crockett, 2011). Unequal access to qualified SETs may compromise the long-term outcomes for a legally protected student population.
Focusing on the distribution of SETs is also important because policies aimed at solely increasing the supply of SETs will not be able to ensure that students with disabilities have access to qualified teachers (Boe et al., 2013). Studies examining the distribution of SETs have focused mainly on differences in SETs by school or district poverty levels. Using national data from the School and Staffing Survey, Mason-Williams (2015) found that SETs in high-poverty schools were less likely to have teaching experience, a master’s degree or higher, and certification in content areas. Fall and Billingsley (2011) found similar patterns for SETs in high-poverty districts using data from the Study of Personnel Needs in Special Education. However, the extent to which SETs are distributed along other important school characteristics, such as racial composition and achievement level, is unknown. Furthermore, previous studies focusing on schools and districts separately ignore that SETs may be distributed simultaneously at multiple levels, across schools within the same district or across districts within counties. It is important to note that research on the distribution of SETs focuses on describing where they teach, which is separate from addressing what factors contribute to these patterns. The latter is beyond the scope of this study, but a combination of local policies, geography, and individual preferences may influence the distribution of teachers (e.g., Loeb & Reininger, 2004).
California Context
California has played an important role in shaping current national special education policies and the discourse on racial disproportionality. In Diana v. State Board of Education (1974), the court ruled that districts in a California county had disproportionately enrolled more Chicano students in special education classes than in general education. The case led to the development of new measures to assess “significant variance” in the percentage of Chicano students in special education relative to that in the school population. A similar case later that decade, Larry P. vs. Riles (1979), argued that the proportion of African American students in a local district identified for special education was higher than in general education. As part of that settlement, the court ordered the California Department of Education to monitor the overrepresentation of African American students. Both court cases raised national awareness of issues affecting students of color, while concerns from the Diana case were eventually incorporated into Public Law 94-142 in 1975, now known as IDEA. Current national policies and debates about racial disproportionality in special education are a legacy of these legal battles (MacMillan, Hendrick, & Watkins, 1988; U.S. Department of Education, 2016a).
Currently, California is home to more than 6.3 million students from diverse racial, linguistic, and socioeconomic backgrounds. Of the K–12 student population in 2014, more than half (53%) identify as Hispanic, followed by White (25%), Asian (12%), and African American (6%; California Department of Education, n.d.). About 22% of students are considered English learners, most of whom speak Spanish as a primary language (85%). More than half receive free or reduced-priced lunches. In special education, California spends nearly 20% more than the nation as a whole, but the state has one of the lowest special education enrollment rates in the country at 11% (Lipscomb, 2009). The racial composition within special education is similar to the state student population for Hispanics (53%) and Whites (27%), slightly higher for African Americans (10%), and lower for Asians (9%; California Department of Education, n.d.). In part due to the size and demographics of the student population and the history of special education in the state, California presents a strong case to explore diversity and equity in SET trends.
Present Study
In this study, we make several contributions to the research literature on the diversity and distribution of SETs. First, we used rich teacher-level data that allow us to examine the profile of teachers with special education credentials in California over an 18-year period. Whereas other studies analyzed smaller samples of teachers from sources such as the Schools and Staffing Survey for a given year (e.g., Mason-Williams, 2015), this study assessed trends for nearly 35,000 teachers with special education credentials each year. Second, in exploring trends in a state that is home to the largest student population in the country and one of the most racially diverse, the findings are likely to portend trends in other states that are experiencing demographic shifts with more students from culturally diverse backgrounds (Teixeira, Frey, & Griffin, 2015). Third, due to concerns about racial disproportionality in special education and the lack of diversity within the SET workforce, we compared the racial composition of teachers with and without special education credentials and special education students over time. Fourth, we identified how much variation in the qualifications of teachers with special education credentials exists across schools and districts to better inform policies aimed at recruiting SETs. Last, we extended previous work on the distribution of SETs by asking whether teacher quality differs in schools by student poverty, racial composition, and academic achievement level. To summarize, we ask the following research questions:
Research Question 1: What are the trends in the growth of teachers of color with special education credentials from 1997–1998 to 2014–2015?
Research Question 2: To what extent are teachers with special education credentials distributed among counties, districts, and schools in terms of other professional qualifications?
Research Question 3: To what extent are the qualifications of teachers with special education credentials distributed with respect to school poverty, racial composition, and student achievement?
Method
Data Source
Teachers
Our analyses used administrative data sets that contain information on teachers, students, schools, and districts from the California Department of Education. We focused on teacher data sets from the 1997–1998 to 2014–2015 school years, which are the oldest and most recent files publicly available for download from the department. The main file of interest was an individual-level data set that included the information on demographic traits and professional qualifications (i.e., years of teaching and education level) of nearly 350,000 school staff members employed each year in California. We created a subsample of SETs based on whether a staff member was assigned a teacher position, possessed a special education and full teaching credential, and worked a full-time equivalent of 0.50 or higher. This excluded staff members who worked as administrators or for pupil services (i.e., librarians and cooking staff).
Although our definition of SETs based on credentials is similar to other studies examining teacher distributions in other subject fields (e.g., Ingersoll & Perda, 2010), there are limitations. Primarily, it is possible that a teacher possessed a special education teaching credential but did not teach special education that year. Some general education teachers may acquire a special education credential to improve employment chances or earn an extra stipend in some districts (Clotfelter, Glennie, Ladd, & Vigdor, 2008). Since we were unable to identify in the data set whether teachers with special education credentials taught special education, we interpret our estimates in this study as the total supply of teachers with a special education credential in a given year. One advantage of focusing on the supply of teachers with special education credentials is that schools may assign teachers without appropriate credentials for special education positions when there are shortages (Rosenberg & Sindelar, 2005).
Although we were unable to identify teachers’ main teaching assignments in the data, we attempted to assess, using two other resources, the extent to which the number of teachers with special education credentials may be an overestimate of the number of teachers who teach special education. First, according to the national School and Staffing Survey of 2011, nearly 87% of teachers with a special education credential in California also held a special education teaching position. This indicates that a majority of teachers with a special education credential do teach special education in the state. Second, we compared our estimates with those from the Bureau of Labor Statistics, which produces employment data for more than 800 occupations for the nation and individual states based on surveys of industries. In Figure 1, we find comparable trends, with our annual estimates of teachers with a special education credential approximately 2.2% higher than Bureau of Labor Statistics records, particularly in more recent years. Both external data sources suggest that a special education credential is an adequate proxy to examining SET trends in the state. To further address whether trends in this study reflect those unique to SETs, we also conducted similar analyses of teachers without special education credentials where appropriate. The overlap between teachers with special education credentials and teachers with a formal special education position is important for comparison with other SET studies that use the latter. However, to be consistent with the data in this study, we interpret our results as teachers with special education credentials in the remainder of this article.

A comparison of the number of teachers with special education credentials from the California Department of Education (DOE) and the number of teachers in special education positions from the Bureau of Labor Statistics (BLS). DOE data not available for 2009–2011. SETs = special education teachers.
Students
When comparing teachers with special education credentials with student trends, we used annual state records on the total number of students with disabilities in the state, disaggregated by race and ethnicity. For parsimony, we created a category that combines all students of color.
Schools and districts
The remaining files contained demographic data on students at the school and district levels, including student enrollment, free or reduce-priced lunches, and academic achievement on the state assessments. We linked the school files with the teacher data set using a school identification number. Unfortunately, staff identification numbers are not unique across years and cannot be linked to examine employment histories. For analyses focusing on the distribution of SETs across schools and districts, we focused on the most recent year, 2014–2015. This merged data set included 8,331 schools across 868 districts and 57 counties. With the exception of the 2009–2010 to 2011–2012 school years, which did not release special education teacher data, all files can be downloaded from the California Department of Education website or the online tool DataQuest.
Measures
Teacher characteristics
In addition to describing trends in the growth of teachers of color with special education credentials, we examined how they are distributed across schools and districts, by five teacher demographic and professional traits. Although limited by the available measures in the data set, we employed measures of teacher quality similar to those used in Mason-Williams (2015) and Lankford et al. (2002)—including binary indicators for novice teachers who had three years of experience or less (1 = yes, 0 = no), an advanced degree (1 = master’s or higher, 0 = bachelor’s or less), and tenure status (1 = tenured, 0 = probationary, long-term substitute, or temporary employee). Although teachers were identified by whether they possessed a special education credential, the data set indicated whether they possessed credentials in other subject areas. We added a binary indicator for whether these teachers possessed two or more other credentials, as an indirect measure of teacher quality and expertise in other areas. Last, given our interest in examining the racial diversity of the SET workforce, we added a measure of the teacher’s race (1 = minority, 0 = White).
School characteristics
Using the school-level demographic files, we identified three student characteristics to understand how teachers with special education credentials may be distributed across schools. Similar to other studies that examined teacher labor markets (e.g., Clotfelter et al., 2005; Lankford et al., 2002), ours focused on the percentage of students of color in the school, the percentage of students receiving free or reduce-priced lunches (an indicator of school poverty rate), and the average student achievement level (a composite measure from the school’s academic performance index based on student results across grades on the California Standardized Test and Reporting program). We divided each school-level variable into quartiles to summarize the characteristics of teachers with special education credentials in those schools—for instance, the percentage of novice teachers in low-poverty (below first quartile) versus high-poverty (above third quartile) schools.
Analytic Method
For our first research question, regarding trends in the growth of teachers of color with special education credentials over the last 18 years, we used basic descriptive statistics. Specifically, we adopted an approach similar to that of Boe (2006), where the growth in the total number of teachers of color is compared with a baseline 1997–1998 school year. The percentage growth served as a common metric to compare trends for teachers of color with and without special education credentials. We used the same approach when examining changes in the number of special education students of color relative to teachers of color with special education credentials. We also calculated the percentage of special education students and teachers with special education credentials who are racial minorities for each year as a comparison.
In our second research question, we examined the distribution of teachers with special education credentials across schools and districts, using three strategies. The first entailed calculating district averages for each teacher characteristic (i.e., percentage of teachers with special education credentials who have a master’s degree in a district) and summarizing the distribution at the 10th, 50th, and 90th percentiles across all districts. We focused on the district level here since districts averaged about 42.2 SETs, compared with 4.5 at the school level. The second strategy entailed decomposing the variation in each of the five SET characteristics across schools, districts, and regional counties using an intercept-only multilevel logistic regression model that combines teachers (Level 1) nested within schools (Level 2) nested within districts (Level 3) and counties (Level 4) for the 2014–2015 school year file:

This model predicts the log odds of a teacher characteristic (i.e., holding a master’s degree or higher) for teacher i in school j, district k, and county l; pijkl is the probability of that characteristic; β0 is the fixed intercept; and u0jkl, υ0kl, and τ0l are random effects for the school, district, and county levels, respectively. Using the variance components, we estimated intraclass correlations to describe the variation in each teacher characteristic for the following:
Between counties:

Between districts within counties:

Between schools within districts:

For the logistic function,
To address our third research question, about the extent to which the qualifications of teachers with special education credentials are distributed by school poverty, racial composition, and achievement level, we adopt an approach used by Clotfelter, Ladd, Vigdor, and Wheeler (2006) and Mason-Williams (2015), where each school-level characteristic from the 2014–2015 year is first ranked and divided into quartiles. For school poverty, Quartile 4 represents high-poverty schools (more than 86% of students qualify free or reduced-price lunch), while Quartile 1 represents low-poverty schools (less than 38% of students qualify). We created similar quartiles for percentage school minority, where Quartile 4 represents high-minority schools (more than 95% of students are minorities) and Quartile 1 equals low-minority schools (less than 56% of students are minorities). Last, for achievement, we used each school’s average academic performance index score from 2011 to 2013 (the most recent score) and created similar quartiles. We then compared the proportion of teachers with special education credentials with each teacher attribute in the first and fourth quartiles of each school characteristic. For instance, we examined the proportion of teachers with a master’s degree in high- and low-poverty schools using a z test of proportions. Since five teacher characteristics and three school characteristics resulted in 15 statistical tests, we used a conservative Bonferroni correction (0.05/15 = 0.003) to reduce the likelihood of rejecting the null hypothesis by chance. We reported Cohen’s d for the effect sizes. Our analyses were conducted with Stata 14.0 and “melogit” for the multilevel models.
Results
Research Question 1: Trends in Teachers of Color With Special Education Credentials
We start with a display in Figure 2 of trends in the number of teachers of color with and without special education credentials over the last 18 years. In both cases, the pattern in the total number of teachers of color mirrors each other, with a slight increase from 1997 to 2000, followed by a small decrease and then steady rise. However, we begin to see in Figure 3 that teachers with and without special education credentials reflect different trends, which shows the percentage of teachers of color in each group. In general, the representation of teachers of color in both groups is low, particularly for teachers with special education credentials. Yet, while the percentage of teachers of color without special education credentials increased from 21% in 1997 to 33% in 2014, the percentage point increase for those with special education credentials is larger, from 14% to 29%. Both groups are becoming more racially diverse, but this is most apparent in Figure 4, where we plot the growth in the total number of teachers of color with and without special education credentials since 1997. Teachers of color with special education credentials have increased 135%, compared with about 55% for those without special education credentials, showing progress in the diversification of both workforces but especially for the former. As another point of comparison, we examine in Figure 5 changes in the percentage of special education students of color. Because the data records on student enrollment were limited to 2002–2003 and after, we used this year as the baseline. With this new baseline, the total number of special education students of color increased 27% since 2002–2003, compared with 98% for teachers of color in special education. Thus, although currently less than one third of teachers with special education credentials are teachers of color, the state has seen large growth in the diversity of the SET workforce, which has outpaced changes in general education teachers (i.e., those without special education credentials) and students of color in special education.

A comparison of the total number of teachers of color with and without special education (SPED) credentials from the California Department of Education sample. Data not available for 2009–2011.

A comparison of the percentage of teachers of color among teachers with and without special education (SPED) credentials from the California Department of Education. Data not available for 2009–2011.
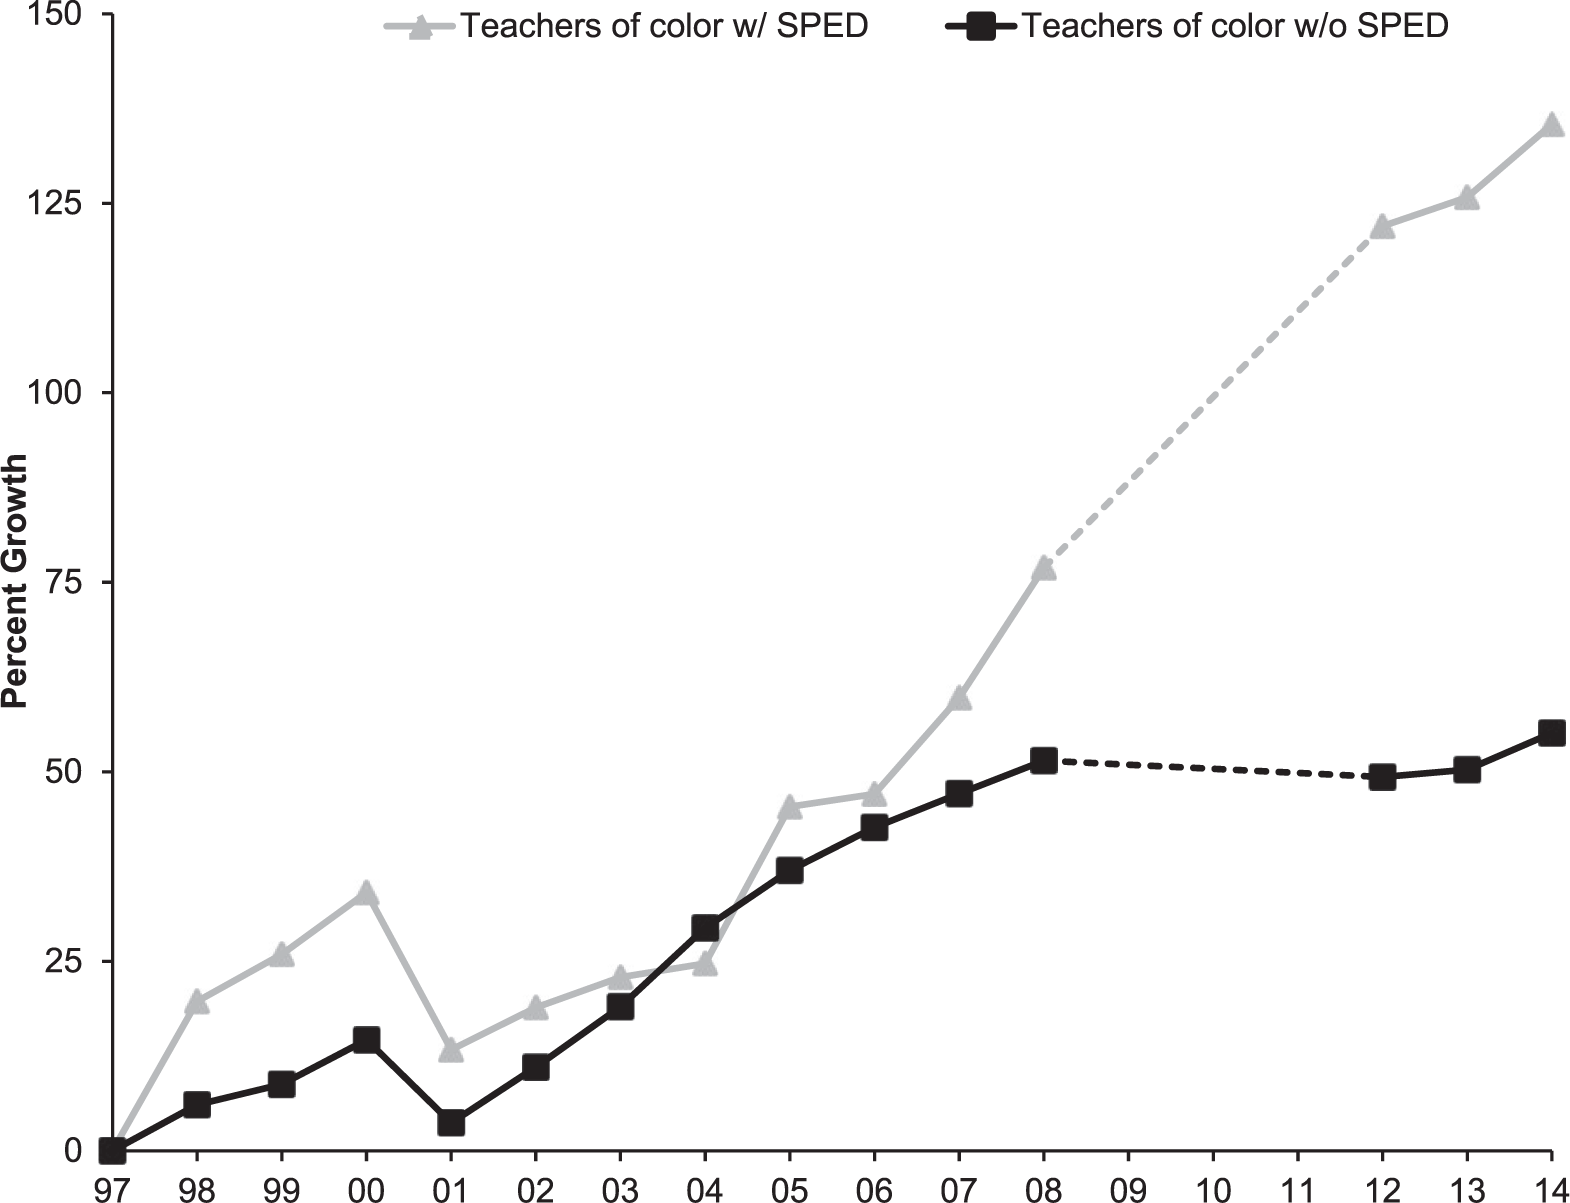
A comparison of the percentage growth in teachers of color among teachers with and without special education (SPED) credentials from the California Department of Education. Data not available for 2009–2011.

A comparison of growth rate of teachers of color with special education (SPED) credentials and students of color in SPED, relative to 2002 base year, from the California Department of Education. Data not available for 2009–2011.
Research Question 2: Distribution of Teachers With Special Education Credentials
Uneven distribution
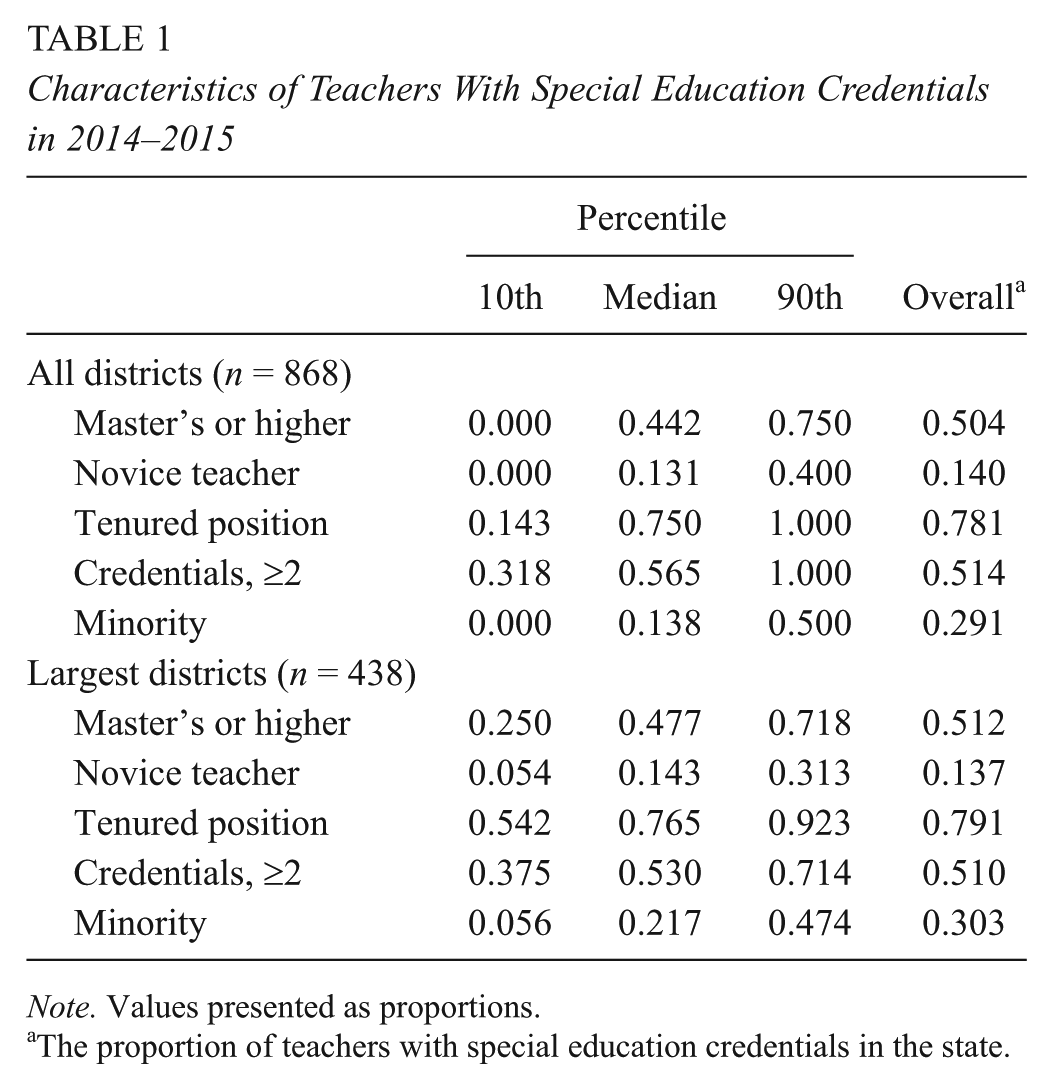
In Table 1, we present the 10th, 50th, and 90th percentiles for measures of SET qualifications and characteristics across all districts in the state. The results show that the qualifications of teachers with special education credentials are unevenly distributed across districts. For instance, some districts employed no teachers with a special education credential who have a master’s degree and none in nontenured positions (10th percentile of all districts). At the upper end are districts where 75% of teachers with a special education credential also held a master’s degree and all were employed in tenured positions (90th percentile of all districts). As a point of comparison, 50% of all teachers with a special education credential in the state had a master’s degree, and 78% were employed in tenured positions. In some districts, nearly 40% were novice teachers with 3 years of experience or less, while other districts had no novice teachers. We see the same pattern for teachers with a special education credential who have multiple subject credentials, but most noticeable is the distribution of teachers by race. At the 90th percentile or above, there are districts where nearly half the teachers with a special education credential are teachers of color, compared with only 14% of teachers in districts at or below the median. Because district size may skew the number of teachers with a special education credential, we also present results limited to larger districts that are above the median in total student enrollment (see bottom half of Table 1). The results show less extreme but similar patterns of districts employing teachers with special education credentials who have fewer qualifications as compared with other districts.
Characteristics of Teachers With Special Education Credentials in 2014–2015
Note. Values presented as proportions.
The proportion of teachers with special education credentials in the state.
Variance decomposition
In Table 2, we present the decomposition of the variation in teacher characteristics of those with special education credentials by school, district, and county, using intraclass correlations. Although the variation in teacher characteristics was relatively low at the different levels of clustering, the results indicate that a larger percentage of the variation in teacher characteristics was among districts within counties. For instance, we found that about 21% of the variation in teachers’ education level was among districts within counties; 18% was among counties; and 5% was among schools within districts. The level of sorting across districts within counties suggests that district practices may affect where teachers work. The pattern is fairly consistent for the other teacher characteristics, except whether the teacher is a racial minority. In the last row, we see that the variation in the racial background of teachers with special education credentials is either among counties (45%) or among districts within counties (50%). This suggests that the distribution of teachers of color with special education credentials appears related to geography rather than differences across schools.
Variance Decomposition of Select Qualifications and Characteristics of Teachers With Special Education Credentials in 2014–2015

Note. Results based on intraclass correlations with unconditional multilevel logistic regression models. n = 35,736 teachers.
Changes in the distribution of SET attributes over time
In Figure 6, we summarize the percentage of teachers with special education credentials for three teacher attributes at the state level for each available year. The results indicate that the percentage of teachers with special education credentials in tenured positions fluctuated from 60% to 75% over the last 18 years. The percentage with master’s degrees or higher dropped from 55% to 46% from 1997 to 2001 but remained fairly consistent since then. In contrast, the percentage of novice teachers with special education credentials each year is low, ranging from 12% to 16% during that period. Overall, Figure 6 suggests little change in these professional characteristics, except that more teachers with special education credentials hold tenured positions.

A comparison of select special education teacher attributes from 1997 to 2014 from the California Department of Education. Data not available for 2009–2011.
Research Question 3: Sorting Teachers With Special Education Credentials by School Characteristics
To better understand the sorting of teachers with special education credentials, we examined the extent to which the qualifications of these teachers are sorted with respect to the economic, racial, and achievement levels of students within schools. In Table 3, we divide these teachers according to whether they taught in high- or low-poverty schools, high- or low-minority schools, and high- or low-achievement schools based on the upper and lower quartiles of each student characteristic at the school level. We then present the proportion of teachers with special education credentials with a given attribute for each school type. The results show that teachers in high-poverty schools were less likely to have a master’s degree or hold multiple teaching subject credentials than those in low-poverty schools. The differences are statistically significant but with small effect sizes (d = 0.06–0.09). One notable finding is that teachers of color with special education credentials were much more likely to teach in high-poverty (42%) than low-poverty schools (18%; d = 0.54). In high-minority schools, teachers with special education credentials were less likely to have a master’s degree (48% vs. 50%) and possess multiple teaching credentials (57% vs. 47%) than in low-minority schools. We also see that teachers of color with special education credentials were more likely to teach in high-minority schools (43% vs. 12%). In our last panel, we found similar results in that teachers with special education credentials in low-achieving schools were less likely to have master’s degrees (48% vs. 56%) and hold multiple credentials (47% vs. 54%) than those working in high-achieving schools. The last row indicates that teachers of color with special education credentials were more likely to teach in low- than high-achieving schools (37% vs. 19%).
Comparison of Qualifications and Characteristics of Teachers With Special Education Credentials by School Composition in 2014–2015
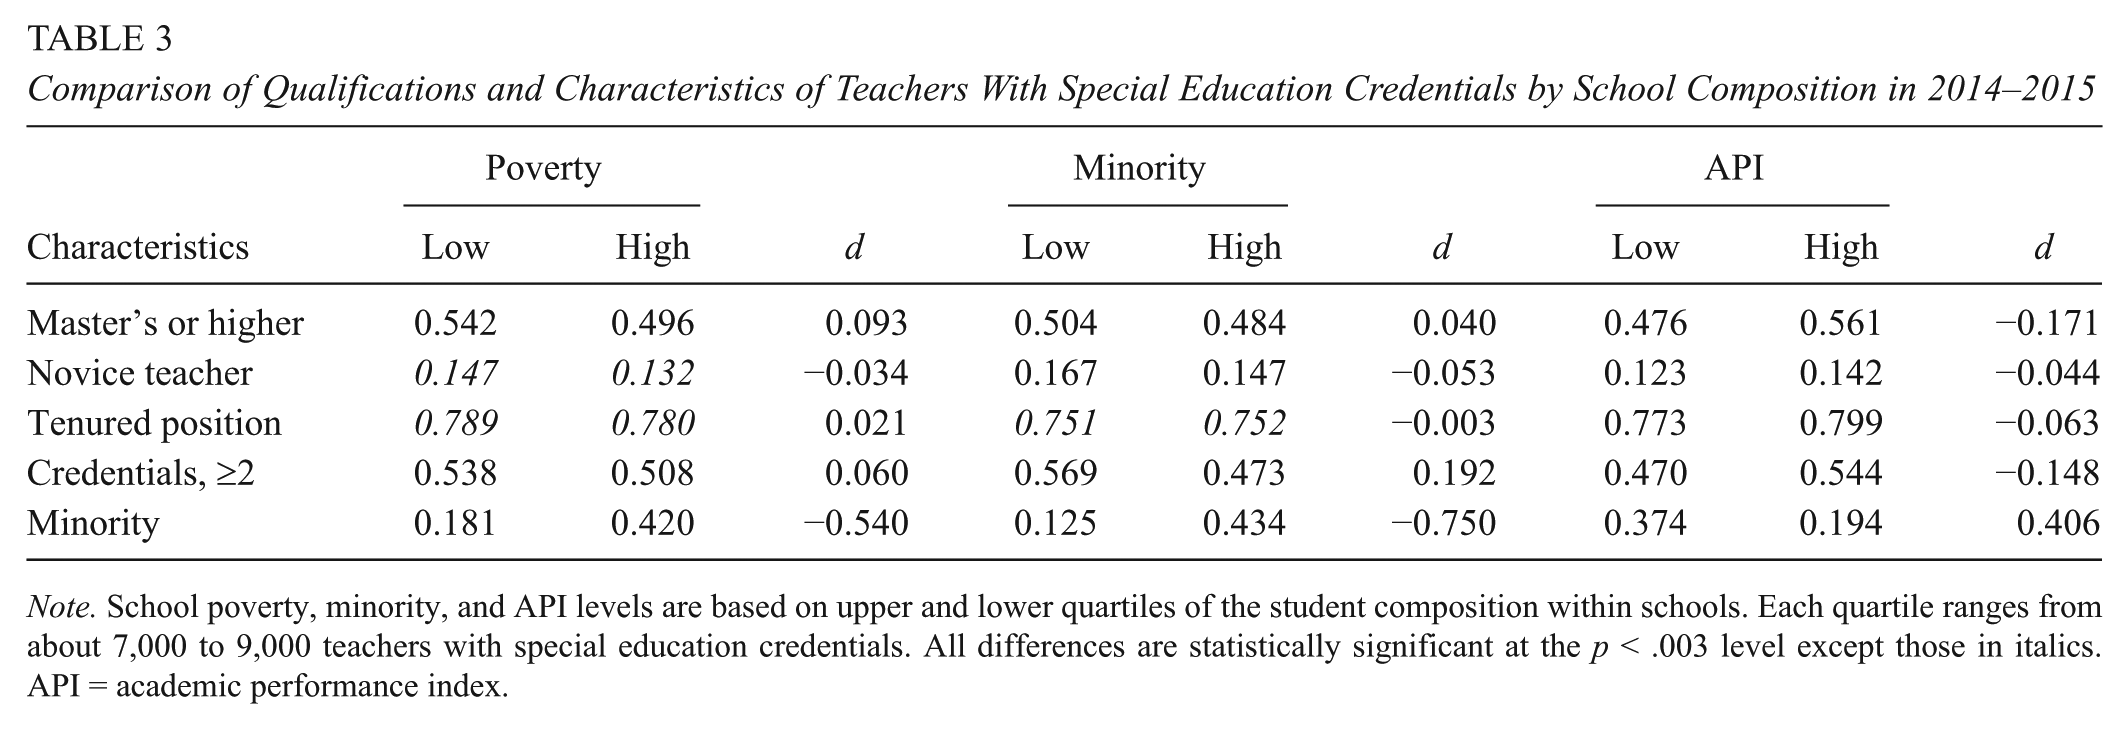
Note. School poverty, minority, and API levels are based on upper and lower quartiles of the student composition within schools. Each quartile ranges from about 7,000 to 9,000 teachers with special education credentials. All differences are statistically significant at the p < .003 level except those in italics. API = academic performance index.
Discussion
Shortages in the supply of teachers have been well documented in the United States, but few studies have examined diversity within the SET workforce and the distribution of SETs. Unlike previous studies, ours examined trends in the composition and unequal sorting of all teachers with special education credentials in California. We extended the literature by describing trends at the school and district levels and how teachers are distributed in terms of school poverty, racial composition, and achievement level.
Diversity in SETs
Cultural and racial diversity within the SET workforce is important given demographic changes in the school population and the persistent racial disparities in special education enrollment (Tyler et al., 2004). Our results indicate that while the percentage of teachers of color with special education credentials (29%) is still much lower than the minority special education student population (74%), this gap is a reflection of the concurrent decrease in the number of White special education students and increase in minority special education students, rather than a failure to increase teachers of color in special education. Indeed, the number of teachers of color with special education credentials has nearly doubled from 2002 to 2014, compared with 27% for the minority special education student population. These findings indicate a workforce that is becoming more racially diverse in California, and they show signs of approximating the need for more minority adult role models and teachers who understand the cultural perspectives of students in general and special education (Artiles et al., 2002). The growing diversity in the California SET workforce also mirrors national trends for all teachers. Using the School and Staffing Survey, Ingersoll, Merill, and Stuckey (2014) found that the total number of minority teachers in the country doubled from 1987 to 2007. Overall, the results indicate that the push toward diversifying the SET workforce has improved.
Distribution of Teachers
In addition to concerns about the diversity of teachers, a related challenge for students is access to qualified SETs. We found wide disparities across districts in terms of the professional backgrounds of teachers with special education credentials in the state. A number of districts, for instance, had no teachers with a master’s degree, while others had generally novice teachers. Although few studies focus on SET qualifications, research on the distribution of general education teacher quality indicates similar disparities across schools (e.g., Clotfelter et al., 2005). When examining how teachers with special education credentials were distributed across schools, districts, and counties, we found that much of the variability in teacher quality is among districts within counties. This contrasts with Lankford and colleagues’ (2002) study of all teachers in New York State, which showed that much of the variability in teacher quality is among schools within districts. One possible reason for the discrepancy is that the current study is based on the 58 regional counties in California as the highest unit of analysis, which is conceptually different from the eight regional labor markets that Lankford et al. used in New York State. Thus, our results may be more generalizable to other studies that examine geographic county regions. Our main findings suggest that district policies, such as hiring practices and salaries, are likely a more important factor than school-specific conditions in the sorting or preferences of teachers with special education credentials. Another key finding is that minority teachers were more likely to be distributed by counties and districts within counties, rather than schools. This indicates that geography may play a more influential role in the employment preferences of minority teachers who are in special education.
Sorting of Teachers by Schools
In our last analyses, we examined the extent to which disadvantaged schools may have less access to quality SETs. In general, schools characterized by high poverty, high minority, and low student achievement tended to employ teachers with special education credentials who have fewer other professional qualifications, which is consistent with other studies (e.g., Lankford et al., 2002; Mason-Williams, 2015). One new finding in this study is that teachers of color with special education credentials overwhelmingly taught in schools serving high-poverty and high-minority student populations with low average achievement. Given the challenges that these schools face in recruiting teachers in general (Allensworth, Ponisciak, & Mazzeo, 2009), the findings suggest that nationwide efforts to recruit SETs of color in hard-to-staff schools have been successful and that the characteristics of schools appear influential in minority SETs’ employment decisions. Combined with our earlier finding about the overall increase in teachers of color, these trends are promising for not only diversifying the field but also addressing schools in need. These trends also reflect a larger pattern of diversity across all public school teachers. Ingersol and May (2011) found that, nationally, 50% of teachers of color taught in high-poverty schools, compared with 20% of White teachers. One important caveat is that this pattern of teachers of color with special education credentials teaching in high-poverty and high-minority schools may also be indicative of systemic racial issues in the hiring process of minority teachers. That is, it may be more difficult for teachers of color to obtain jobs in low-minority schools due to biases in school or district policies.
Limitations
This study contains several limitations related to the data source. Primarily, the California staffing data limited our identification of SETs to whether a teacher possessed a credential in special education. Previous national studies, however, identified SETs based on whether a teacher’s main assignment was in special education, which is a more accurate assessment of the current supply of SETs. Since our definition of SETs includes teachers who possess a special education credential but may not necessarily be teaching special education at the time, our estimates should be interpreted as the total number of teachers qualified to teach special education in a given year. State databases are needed that can link teacher histories and main teaching assignments. While the number of teachers identified here is likely higher than the actual number of SETs working in special education positions, the majority of teachers with special education credentials do appear to teach special education, according to other data sets (Bureau of Labor Statistics, n.d.; School & Staffing Survey, 2011).
Our analysis of SET quality was also limited by the available variables in the data set. Studies examining teacher education levels have included measures of whether a teacher graduated from a competitive college and degree major (e.g., Lankford et al., 2002), which were not available in our California data set. Test scores on state teaching exams and subject-specific assessments are potential indicators of aptitude and teacher quality. The extent that SETs may be sorted by these measures of aptitude and achievement across schools or districts is unclear. Although we used similar measures of teacher quality as other studies, research indicates that common qualifications (e.g., degrees) are weak predictors of student achievement (Feng & Sass, 2013). We were unable to use more direct measures of teacher quality related to instruction and pedagogy or value-added models linked to student test scores. In addition, the data set did not contain information on teacher salary and other work conditions, which likely influence school choice and attrition for SETs and those with special education credentials (Fall & Billingsley, 2011). Given that teacher salary is probably correlated with teaching experience, the distribution of teachers with special education credentials by salary may be reflected in the results.
Another limitation of the study is that the data could not be linked at the individual level across years. This prevented an analysis of trends related to attrition and turnover (e.g., Billingsley, 2004), such as the number of teachers in California who remained at their school from year to year. For policies aimed at recruitment and retention, it is critical to know whether teachers leave a school but remain in the district or leave the profession all together. Analyzing attrition and turnover is especially important for SETs of color, who are also more likely to leave the profession within the first three years (Ingersoll & May, 2011). Longitudinal data are needed to examine how these employment trajectories of SETs may change over time.
Last, this study focuses on the supply of teachers with special education credentials in a state that is unique in its student and teacher demographics. However, the generalizability of the findings is relevant to other highly populated states, such as New York and Texas, where minority students make up nearly half of the school population and teachers in general remain majority White (Aud et al., 2011). The results are also pertinent to states and communities that have in recent years experienced increases in terms of overall population and racial diversity (Teixeria et al., 2015) and may encounter similar challenges with staffing special education positions or providing special education students with qualified teachers.
Implications for Policy and Future Research
In response to national calls for more SETs of color over the last decade (Cambell-Whatley, 2003; Tyler et al., 2004), schools in California have seen an increase in the supply of teachers of color with special education credentials that exceeds the growth in special education students of color. While our results indicate that efforts to diversify the SET workforce have been successful, concerns still remain about how teachers are distributed. Policies may need to adopt a two-prong approach that addresses the general sorting of SETs that occurs across districts and at the same time target larger disparities in access to SETs by school poverty, race, and achievement. Such policies can help alleviate the unequal distribution of teachers at multiple levels. Districts and schools may need to consider expanding alternative preparation programs, which are sometimes associated with lower teacher quality. However, alternative programs have been found to be cost-effective in producing SETs with similar skill levels as SETs from traditional programs (Sindelar, Daunic, & Rennells, 2004). Furthermore, many of these alternative programs are provided through colleges and major universities that offer a traditional degree program and have been effective in recruiting teachers of color and men (Sindelar et al., 2012). SETs from these programs also tend to remain in special education longer than those from traditional programs, which can help develop a more stable and experienced workforce (Sindelar et al., 2012). In short, developing ways to improve alternative programs should be considered a part of larger efforts to address the distribution and quality of SETs.
Changes to policies will depend on other areas for future research. First, as the supply of SETs becomes more racially diverse, an important question is how this trend may affect students with disabilities. One rationale for a more diverse SET workforce is the assumption that cultural mismatch between teachers and students in terms of teaching and learning styles is a contributing factor to current racial disparities in special education (Artiles et al., 2002). Thus, future research on whether racial disparities continue to persist in districts or communities with a more diverse SET population is important for policy decisions and teacher recruitment. A related question is whether academic achievement for students with disabilities may be affected with a more diverse SET staff due to similar theories about cultural mismatch and support. In terms of cost-effectiveness, district decisions to increase the diversity in the SET workforce may need to be evaluated in relation to training teachers in culturally responsive teaching.
Another area for research relates to better understanding why teachers of color with special education credentials are selecting schools that serve high-minority student populations. School preferences have implications for not only creating a more diverse SET workforce but also ensuring that this diversity is distributed across schools. While teachers of color may have a personal interest in assisting children from similar cultural backgrounds, research shows that teachers tend to work in schools that are, on average, 15 miles away from the districts in which they graduated (Loeb & Reininger, 2004). If proximity to home is a factor in school preference for SETs of color, then this will likely affect how they are distributed to schools and districts. Furthermore, if few students of color from these communities become SETs, then this will affect both the supply and the distribution (Reininger, 2012). External incentives may be needed to recruit SETs of color from outside the community in these cases. More research is needed to distinguish geographic preferences from other intrinsic considerations for SETs of color. Future studies should also examine whether current district and school policies may be excluding SETs of color from consideration for recruitment and hiring. As noted earlier, teachers may select schools according to personal preference, but districts and schools also play role in what opportunities are available. More research is needed in disentangling personal preference from structural issues within districts and schools that limit professional choices for SETs of color.
Third, more research should focus on the employment history of SETs of color, particularly early in their careers. Overall, teachers of color are entering teaching at a higher rate than White teachers, but they are also switching schools or leaving the profession altogether at a higher rate. Research shows that teachers’ attrition appears related to the workplace conditions of their schools (Ingersoll & May, 2011). More studies are needed on whether this pattern of turnover is similar for SETs of color or potentially higher, given some of the additional challenges of teaching in special education. Future research should also explore whether the predictors of attrition for general teachers are similar for SETs.
Fourth, to further understand the distribution of SETs, better administrative data are needed that link information on students with disabilities at the individual level to their teachers. This can help address whether students with disabilities are more likely than students without disabilities to have access to qualified teachers. Furthermore, this discussion of students in special education acknowledges but overlooks the range of disability categories. State databases that link individual-level data to teachers can address whether students with learning disabilities, as compared with students with speech language impairment, are taught in classrooms with qualified teachers. Such data can disentangle the influence of student disability, race, and home poverty on the sorting of teachers and help answer what contributes to the variance in teacher qualifications among schools, districts, and counties found in this study.
Finally, this study documents the extent of teacher sorting, but there is much to learn about why this occurs and for developing effective policy interventions. High-poverty and low-achieving schools are less likely to employ more teachers with special education credentials who have more qualifications, a pattern that is also consistent in general education. In California, studies have found evidence that economic incentives can be effective in attracting talented and new teachers to work in hard-to-staff schools and districts (e.g., Strunk & Zeehandelaar, 2011). Whether such policies extend to SETs and can remain viable in the long term without consistent state funding are critical questions for ensuring that all students with disabilities have access to an equitable education. This analysis of teachers in California serves as a reminder that efforts to improve educational outcomes for children with disabilities will require researchers and policy makers to address both the composition and distribution of SETs.
Conclusion
Growing changes in student demographics across schools in the United States have led to calls for a more diverse teaching workforce. In special education, racial disparities in representation between students and teachers are magnified given the concerns about the overidentification of some student groups (Artiles et al., 2002). Challenges with increasing diversity within the SET workforce are further influenced by the unequal distribution of qualified SETs. This study provides new insight into changes within the SET workforce in the most populous state in the country over the last 13 years. Despite improvements in increasing the diversity of the SET workforce, we show that equity in the distribution of teachers with special education credentials remains a problem at multiple institutional levels. The findings provide avenues that policy makers and researchers can explore to ensure that children with disabilities have access to perhaps the most important school-based resource in their educational experience.
Footnotes
Acknowledgements
We would like to thank Inheok Lee and Micheal Sandbank for helpful comments on earlier drafts.
1.
We use “teachers of color” and “minority teachers” interchangeably.
Authors
NORTH COOC is an assistant professor of special education at The University of Texas at Austin (1 University Station, Stop 5300, Austin, TX 78712;
MAN YANG is a doctoral student of special education at The University of Texas at Austin (