
Abstract
This study examined the effects of the Success for All (SFA) whole-school reform approach on student reading achievement. The data were collected for the Study of Instructional Improvement by the University of Michigan, which did not previously report the achievement outcomes in detail but did make the data available online. Using propensity matching, we matched 27 SFA with 27 comparable schools based on several key demographic variables. The evaluation used hierarchical linear modeling with students nested within schools. Results showed that SFA students significantly outperformed their counterparts in the matched schools on reading achievement, with an effect size of +0.26 for students in a 3-year longitudinal comparison. Effect sizes were similar for 2-year cohorts (mean effect size = +0.31). Policy implications are discussed.
I
These policy developments are increasing the importance of large-scale, especially third-party, evaluations of educational programs. Rigorous, replicated experiments are gradually becoming the gold standard for impact on policy and practice.
One program central to the discussions of evidence-based reform is Success for All (SFA), a whole-school reform model focused on improving reading outcomes in high-poverty Title I elementary schools (Slavin, Madden, Chambers, & Haxby, 2009). SFA provides reading materials, software, and extensive professional development to all teachers in Title I elementary schools. The professional development focuses on building teachers’ skills in implementing cooperative learning and providing effective instruction in phonics, metacognitive strategies in reading comprehension and writing, classroom management, and other approaches. It also provides professional development to tutors to work with struggling readers as well as family support and leadership approaches.
SFA is composed of elements proven effective in research, and the program itself has been extensively evaluated. Evaluations include a randomized longitudinal study in 35 schools by Borman et al. (2007) and another third-party randomized study in 37 schools by MDRC (Quint et al., 2015). These, and numerous first-party and third-party quasi-experiments, have clearly established the effectiveness of SFA in increasing reading achievement in the early grades (see Slavin, Lake, Chambers, Cheung, & Davis, 2009). However, the largest study ever done to evaluate SFA has never been fully reported. This was a study carried out by Brian Rowan, Richard Correnti, and their colleagues at the University of Michigan from 1999 to 2004. The study, called the Study of Instructional Improvement (SII), compared SFA and two other whole-school reform models, America’s Choice (AC) and Accelerated Schools Plus (ASP), to each other and to a control group. The full study involved 115 high-poverty schools across the United States.
Rowan, Correnti, Miller, and Camburn (2009) and Correnti (2009) reported the procedures and findings of the SII in terms of teachers’ behaviors, derived from teacher logs (Rowan & Miller, 2007; Correnti & Rowan, 2007). However, they never reported achievement outcomes in any detail, only estimating that SFA students gained more than students in the other three programs on TerraNova reading tests, with an effect size of +0.43 at the end of 3 years, moving the average child from the 30th to the 50th percentile. Even these findings were presented only in a technical report and an American Educational Research Association paper and were never published. Insufficient detail was provided to enable the achievement findings to be confirmed according to today’s standards of rigor for experimental evaluations. The studies examining teacher logs noted that teacher behavior in SFA and AC (but not ASP) changed in directions consistent with these models’ emphases (see below), but reading outcome data have not been adequately reported.
The Present Paper
The analyses reported in the present paper involved a secondary analysis of data from the SII. They compare students in SFA schools to best-matched comparison schools throughout the sample, using propensity matching. The purpose is to use the large and rich SII data set to investigate impacts of SFA on achievement outcomes.
The Importance of SFA for Evidence-Based Policy Today
The SII, though completed more than a decade ago, has particular relevance to policy issues today. Anyone who follows the What Works Clearinghouse or other summaries of research on educational interventions is aware that few programs are finding consistent positive impacts on achievement outcomes in rigorous, large-scale evaluations. Many of the programs that have shown positive effects are one-to-one or one–to–small group tutoring models, not whole-school or even whole-class interventions with potential for broader impact. If evidence of effectiveness is to become increasingly important in federal, state, and local policy, it is essential to have a broad array of proven programs meeting the highest standards of rigor in their evaluations (see Slavin, 2013; Cohen & Moffitt, 2009).
The SII happened to have evaluated two programs that did make substantial differences in achievement and one that did not. Further, it collected and analyzed detailed teacher logs that made it possible to quantify what teachers were doing differently in the different whole-school designs. It also commissioned studies of the organizations that created each of the programs, making possible comparisons at that level (Cohen, Peurach, Glazer, Gates, & Goldin, 2014; Peurach, 2011).
The only one of the programs evaluated by SII that is still in widespread use today is SFA. SFA has had positive reading achievement outcomes in the great majority of its evaluations, averaging an effect size of +0.31 (Slavin, Madden, et al., 2009). For example, in Social Programs That Work (http://evidencebasedprograms.org), SFA in Grades K–2 is one of just two whole-school or whole-class programs to meet “top-tier” standards (the other is career academies for high schools). The What Works Clearinghouse (2009) accepted seven studies evaluating SFA, one “without reservations” and six “with reservations.” The weighted mean effect sizes across the seven studies were +0.25 for letter-word identification, +0.39 for word attack, +0.20 for comprehension, and +0.27 for general reading.
One reason SFA may have had relatively consistent positive effects for reading in the primary grades is that the program provides a clear structure for teachers and extensive professional development and on-site coaching for all school staff, which lead to significant changes in daily instruction, aligned with the program’s theory of action (Peurach & Glazer, 2012). Summaries of teacher log data reported by the SII research make this point repeatedly for SFA with respect to early elementary reading (and with respect to writing for AC; Rowan & Miller, 2007). These are the areas in which each program produced significantly greater gain than the other programs and the control group. For example, Correnti and Rowan (2007) reported that SFA teachers taught reading comprehension in 65% of lessons, in comparison to 50% in comparison schools. SFA teachers reported spending significantly more time than controls on reading comprehension and word analysis, the very areas in which program impacts were strongest. During reading comprehension instruction, SFA teachers were significantly more likely to have students discuss text with each other in cooperative groups, to focus on literal comprehension, and to check students’ comprehension by eliciting brief answers from students. They were no less likely than control teachers to focus on advanced reading strategies or to have students write extended text about what they read, but they provided much more direct instruction on comprehension strategies. Further, teachers in SFA schools showed much less variability in instruction than did teachers in other schools.
Focusing at the school level, Rowan and Miller (2007) reported that teachers in SFA schools (and in AC schools) felt they had greater levels of instructional guidance than did teachers in ASP or control schools. They also reported that their improvement efforts were more closely monitored.
Teachers in ASP reported higher autonomy, values-based decision making, and strength of professional community. However, these same teachers’ logs did not reveal any actual change in daily teaching behaviors, in comparison to controls. Based on their logs, teachers’ behaviors in ASP were indistinguishable from those of teachers in control schools. As a likely consequence, the ASP did not show any greater gains in student learning in comparison to controls.
The comparisons in emphases and outcomes among the three whole-school reform models are crucially important for understanding the situation of evidence-based reform today. The SII researchers concluded from their data that in order for whole-school reform models to have significant impacts on student learning, especially in often-chaotic and stressed high-poverty schools, they must have a clear plan for reform and implement it with sufficient specificity, professional development, and classroom supports to ensure that teachers’ behaviors change in directions likely to improve student outcomes.
Today, SFA represents the main surviving example of a whole-school reform with a strong emphasis on providing high-poverty schools with specific, well-structured strategies; supportive classroom materials and software; and extensive professional development and on-site coaching. The present study reaches back in time to explore data from the SII to better understand the impacts of SFA and implications for evidence-based reform and educational policies of today. Our hope is that the lessons of SFA derived both from the unreported achievement outcomes and from previously reported teacher logs and institutional analyses (Correnti & Rowan, 2007; Peurach, 2011; Rowan & Miller, 2007) will help current and future designers create additional whole-school approaches as effective as SFA to serve the many disadvantaged children in need of higher-quality instruction and better learning outcomes.
In the Rowan et al. (2009) report was a URL for a website containing all of the data from the SII. We obtained these data in order to carry out a summative evaluation of this major third-party evaluation in an attempt both to confirm the reported findings and to add depth to them, examining different program durations available from the data files.
The present analysis used a propensity-matching strategy in which SFA schools were matched based on multiple demographic variables with schools not using SFA across the entire SII sample, regardless of which non-SFA approach was in use. Hierarchical linear modeling (HLM) was used to deal with the clustered nature of the data.
Confirmatory Hypothesis
The principal hypothesis for this secondary analysis is that students in SFA schools over the entire 3-year period, from kindergarten to second grade, would show greater gains on TerraNova Reading than students in propensity-matched schools who had also been in their schools for 3 years.
Exploratory Hypothesis
We hypothesized that students who received fewer than 3 years of SFA would also show greater gains on TerraNova Reading than would students in matched schools but that the longer students were in SFA schools, the greater their gains relative to matched controls. To test this hypothesis, we evaluated all possible 1-year and 2-year cohorts, in comparison to their matched controls.
Method
Data
As noted earlier, the data used in the current study were collected for the SII, conducted by the University of Michigan in collaboration with the Consortium for Policy Research in Education. The SII was a large-scale quasiexperimental study that examined the effectiveness of three widely disseminated comprehensive school reform (CSR) programs on instruction and student achievement in high-poverty elementary schools between 1999 and 2004. As indicated in Table 1, the SII sample consisted of 115 elementary schools, including 30 SFA, 31 AC, and 28 ASP. In addition to following schools that adopted these three CSR programs, the study also followed 26 control schools (Correnti, 2009). The data were made publicly available and were downloaded through the Inter-University Consortium for Policy and Social Research website (http://www.icpsr.umich.edu/).
Participating Schools in the Study of Instructional Improvement

Demographic Characteristics of Participating Schools
Background information on participating schools in the SII is summarized in Table 2. It is clear that the majority of the participating schools served very disadvantaged minority students from high-poverty communities. Forty percent of students were from single-parent homes, and 70% of them qualified for free lunch. Approximately 70% of students were ethnic minorities, mostly African Americans. In terms of academic achievement, only 30% of students met state proficiency standards in reading and mathematics.
Demographic Characteristics of Original Sample of SII Schools by CSR Program (in percentages)

Source. Correnti (2009).
Note. SII = Study of Instructional Improvement; CSR = comprehensive school reform; SFA = Success for All; AC = American’s Choice; ASP = Accelerated Schools Plus.
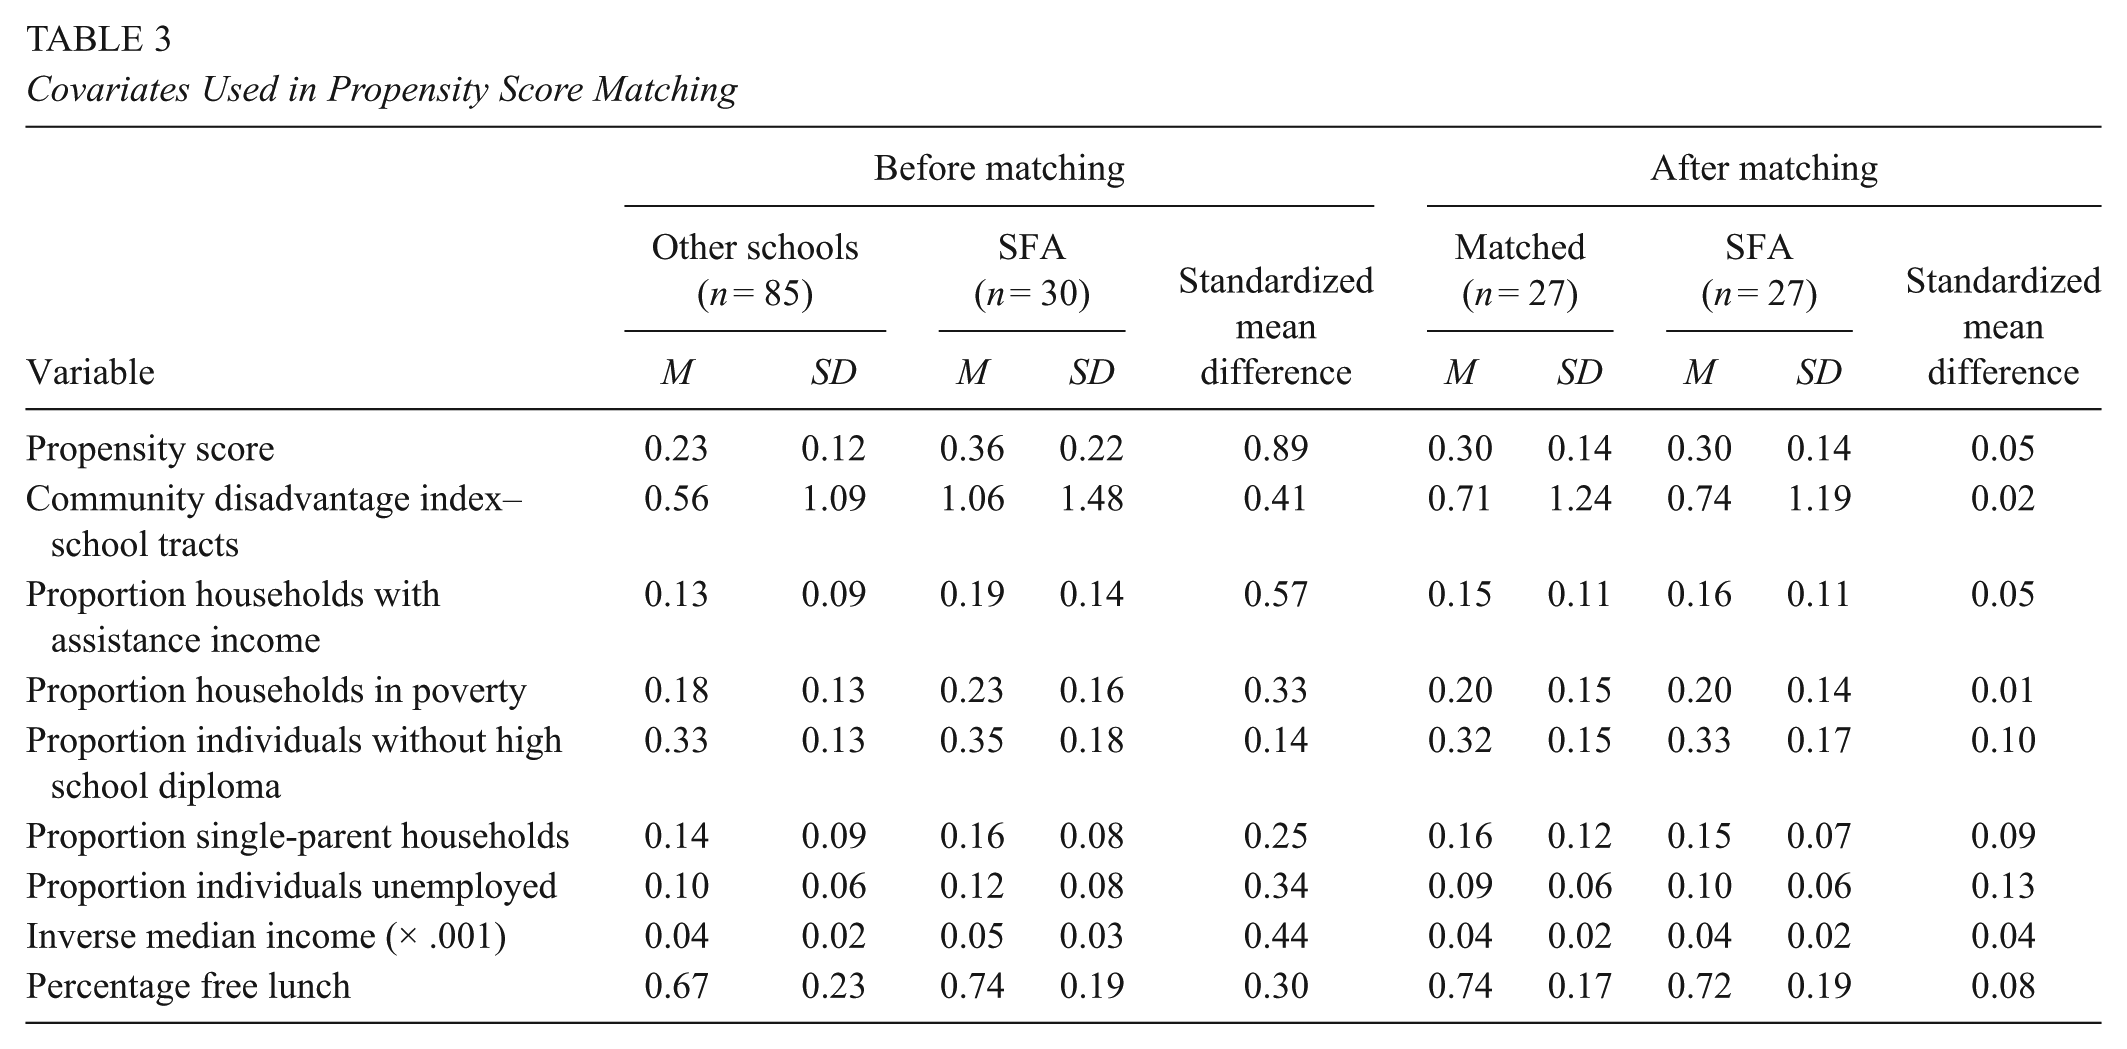
There were some key differences among the three sets of CSR program schools and the comparison schools in terms of school characteristics. For instance, SFA and AC schools served more disadvantaged students (75%) and had a higher percentage of minority students (75%) than ASP (63%) and the comparison schools (65%). Students in SFA and ASP schools had lower reading scores at pretest (in kindergarten) than those in AC and comparison schools on the Woodcock-Johnson assessments. AC (30%), SFA (30%), and ASP (31%) schools had lower percentages of students meeting state proficiency standards in reading at pretest than comparison schools (36%). As indicated in Table 3, before matching, the SFA schools and the other schools showed considerable imbalance on various covariates.
Covariates Used in Propensity Score Matching
Propensity Score Matching Method
Given the fact that participating schools in the SII were not randomly assigned and key differences existed between the SFA schools and other schools in the sample, we decided to use propensity matching to locate better-matched schools from the other two CSR programs and the comparison group. The problem with nonrandomized designs is that the treatment group and the comparison group may systematically differ from each other based on school characteristics or covariates (Fan & Nowell, 2011; Rosenbaum & Rubin, 1983). Propensity score matching was employed to control for demographic or pretest differences by excluding participating schools that could not be well matched, so that systematic error could be reduced (Rosenbaum & Rubin, 1983). As Lane, To, Henson, and Shelley (2012) argued, nonrandom sampling may introduce bias when comparing treatment effects between groups given an unequal and unknown probability of group assignment. Propensity score matching is an approach to tackle this problem by using regression techniques to generate predicted scores for each school regarding the likelihood of a school to be assigned to the treatment group given theoretically relevant covariates. A matching method is applied subsequently to the schools in treatment and comparison groups by those predicted scores (i.e., propensity score) so that schools of both groups would have an equal likelihood of receiving the treatment (Guo & Fraser, 2015).
We calculated the propensity score as follows:
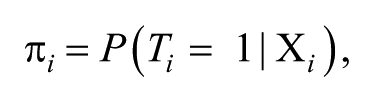
where π i is the propensity score for school i, which is the conditional probability (P) of assigning a school to treatment group (T = 1) give a set of covariates (X) of school i.
The four major steps for performing propensity score analysis in this study were as follows:
A list of eight relevant covariates was selected.
The probabilities or propensity scores were calculated for each school by using logistic regression (Thoemmes, 2012).
A one-to-one nearest-neighbor matching method with a caliper .25 standard deviations of the propensity score (Stuart, 2010) was adopted in this study. The aim was to pair each SFA school with a non-SFA school in the sample with the nearest propensity score.
An examination of the balance of covariates was conducted for the newly matched sample.
With the balance introduced by propensity score matching, we expected that there would be no systematic differences between the SFA schools and matched schools, and the treatment effect could be tested for the matched sample.
SPSS custom dialog psmatching3.03, provided by Thoemmes (2012), with the R plug-in Matchit package (Ho, Imai, King, & Stuart, 2007) was used to perform propensity score matching. The program generated 27 SFA schools matched with 27 non-SFA schools, which included schools using various CSR programs in the SII sample (see Table 4). According to Rubin (2001), the absolute standardized difference in the mean of propensity score between two groups should be less than .20, and ratio of propensity score variances of both groups should be close to 1 for the matched sample. In our matched sample, the absolute standardized difference in the mean propensity score between two groups was reduced from a prematching of d = .89 to a postmatching of d = .05 (Table 3). The difference in propensity scores between the two postmatched groups were not statistically significant, t(52) = –.20, p = .841. The variance ratio dropped from 3.55 (prematching) to 0.99 in the postmatched sample. Thus, distribution of propensity scores of both groups was similar.
Result of Propensity Score Matching

A multivariate test generated from the SPSS R plug-in program was used to evaluate covariate balance. A balance test developed by Hansen and Bowers (2008) that was analogous to Hotelling’s T2 statistic tested overall covariate balance. In this study, the nonsignificant test result suggested a balance of covariates, χ2(8) = 2.255, p = .972. Standardized mean differences for each covariate between the two groups were examined, and no covariate exhibited a large imbalance (i.e., |d| > .25). Given the results of multivariate and univariate tests, we assumed that covariate balance was established in the matched-schools sample. Thus, tests of the treatment effect could proceed with the matched sample.
Final Sample
The final sample consisted of 54 matched schools: 27 SFA schools and 27 matched control schools (16 AC schools, five comparison schools, and six ASP schools). 1 Key demographic variables, such as a community disadvantage index, proportion of households with assistance income, proportion of households in poverty, free lunch, and so on, were used as covariates in the propensity-matching method.
There were two phases in the data collection of SII. The first cohort of students began the study during the 2000–2001 academic year; the rest began the study during the 2001–2002 academic year. Both cohorts were followed from kindergarten to second grade. There were also replacement students entering the study in the beginning of each academic year. For the purpose of our analysis, we treated the beginning year of the longitudinal study as Year 1 regardless of the phase of study, the following year as Year 2, and so on. For the longitudinal sample, that is, those who entered the program at Time Point 1, 842 kindergarten students (SFA = 411) took TerraNova tests in spring Year 1, 568 students (SFA = 246) of the same cohort took tests in spring Year 2, and 453 (SFA = 181) took tests in spring Year 3. Of those who entered the study at Time Point 2 (mostly first graders), 292 (SFA = 149) took the tests in the spring of same academic year, and 191 (SFA = 104) took the tests in the spring of the following year. There were 191 students, mostly second graders, who entered the program at Time Point 3 and took the tests in the spring of the same academic year.

Description of the sample. Students retained in grade were included in the analysis.
Measures
The primary outcome of interest was reading achievement. Participants were assessed on reading outcome measures in the fall as pretests and in each spring thereafter as posttests. Two measures were used for the current study: The Woodcock-Johnson III (WJIII) Tests of Achievement by Riverside Publishing and the TerraNova Tests and Assessments by McGraw-Hill. The Letter/Word Identification scale of the WJIII subtest was used as a pretest for those students who started in kindergarten in the fall of Year 1. The internal reliability coefficient for the Letter/Word Identification subtest used was 0.92 (Woodcock, McGrew, & Mather, 2001). The Reading/Language Arts subtest of the TerraNova Assessment was used for all other grades as pretests and posttests. The internal reliability coefficient for the TerraNova Reading and Language Arts section was 0.87 (CTB/McGraw-Hill, 2001). For ease of interpretation, all scores were standardized.
Analyses
Due to the nested nature of the data, we employed HLM with the school as the unit of analysis (Raudenbush & Bryk, 2002) for all comparisons. The pretests were used as the covariate. The HLM approach was the optimal design for the current study because it addressed the practical problems of accounting for the effects of attending a given school, using degrees of freedom associated with the number of schools rather than students. HLM allows us to simultaneously model both student- and school-level sources of variability in the outcome (Raudenbush & Bryk, 2002). Specifically, a two-level hierarchical model that nested students within schools was developed to analyze the data collected. The fully specified Level 1, or within-school, model nested students within schools. The linear model for this level of the analysis is written as

This represents the post-test achievement for student i in school j regressed on the Level 1 residual variance, rij. We also included a grade indicator as a predictor in the Level 1 model. We treat the within-school grade-level gap—the difference between the posttest scores of different grades in school j—as fixed at Level 2 because it is intended only as a covariate.
At Level 2 of the model, we estimate SFA treatment effects on the mean posttest achievement outcome in school j. We included a school-level covariate, the school mean pretest score, to help reduce the unexplained variance in the outcome and to improve the power and precision of our treatment effect estimates. The fully specified Level 2 model is written as


where the mean posttest intercept for school j, β0j, is regressed on the school-level mean pretest score, the SFA treatment indicator, plus a residual, u0j. The within-school posttest difference between grades, β1j, is specified as fixed, predicted only by an intercept.
In the previous description of the sample, we concluded that the analysis of the baseline data showed few important differences between the SFA and the matched control schools.
Results
Pretest Differences
As indicated in Table 5, after matching, the SFA schools scored nonsignificantly higher than matched comparison schools at pretest for the 3-year longitudinal sample and the 1-year sample, with effect sizes of +0.13 and +0.10, respectively. However, there was a significant difference at pretest for the 2-year longitudinal sample, with an effect size of +0.12.
Comparison of Standardized Pretest Reading Scores of Success for All (SFA) Schools and Matched Comparison Schools at the Student Level

p <.05.
Outcomes for the 3-Year Longitudinal Sample
The confirmatory multilevel models, shown in Table 6, assessed student- and school-level effects on their posttest scores. In Year 1, the treatment students scored nonsignificantly higher than the controls on the posttest, with an effect size of +0.12 (p < .25). In Years 2 and 3, students in the treatment condition significantly outperformed the controls, with effect sizes of +0.34 (p < .01) and +0.26 (p < .05), respectively.
3-Year Longitudinal Results

Note. SFA = Success for All.
p < .05. **p < .01. ***p < .001.
Outcomes for 2-Year Longitudinal Samples
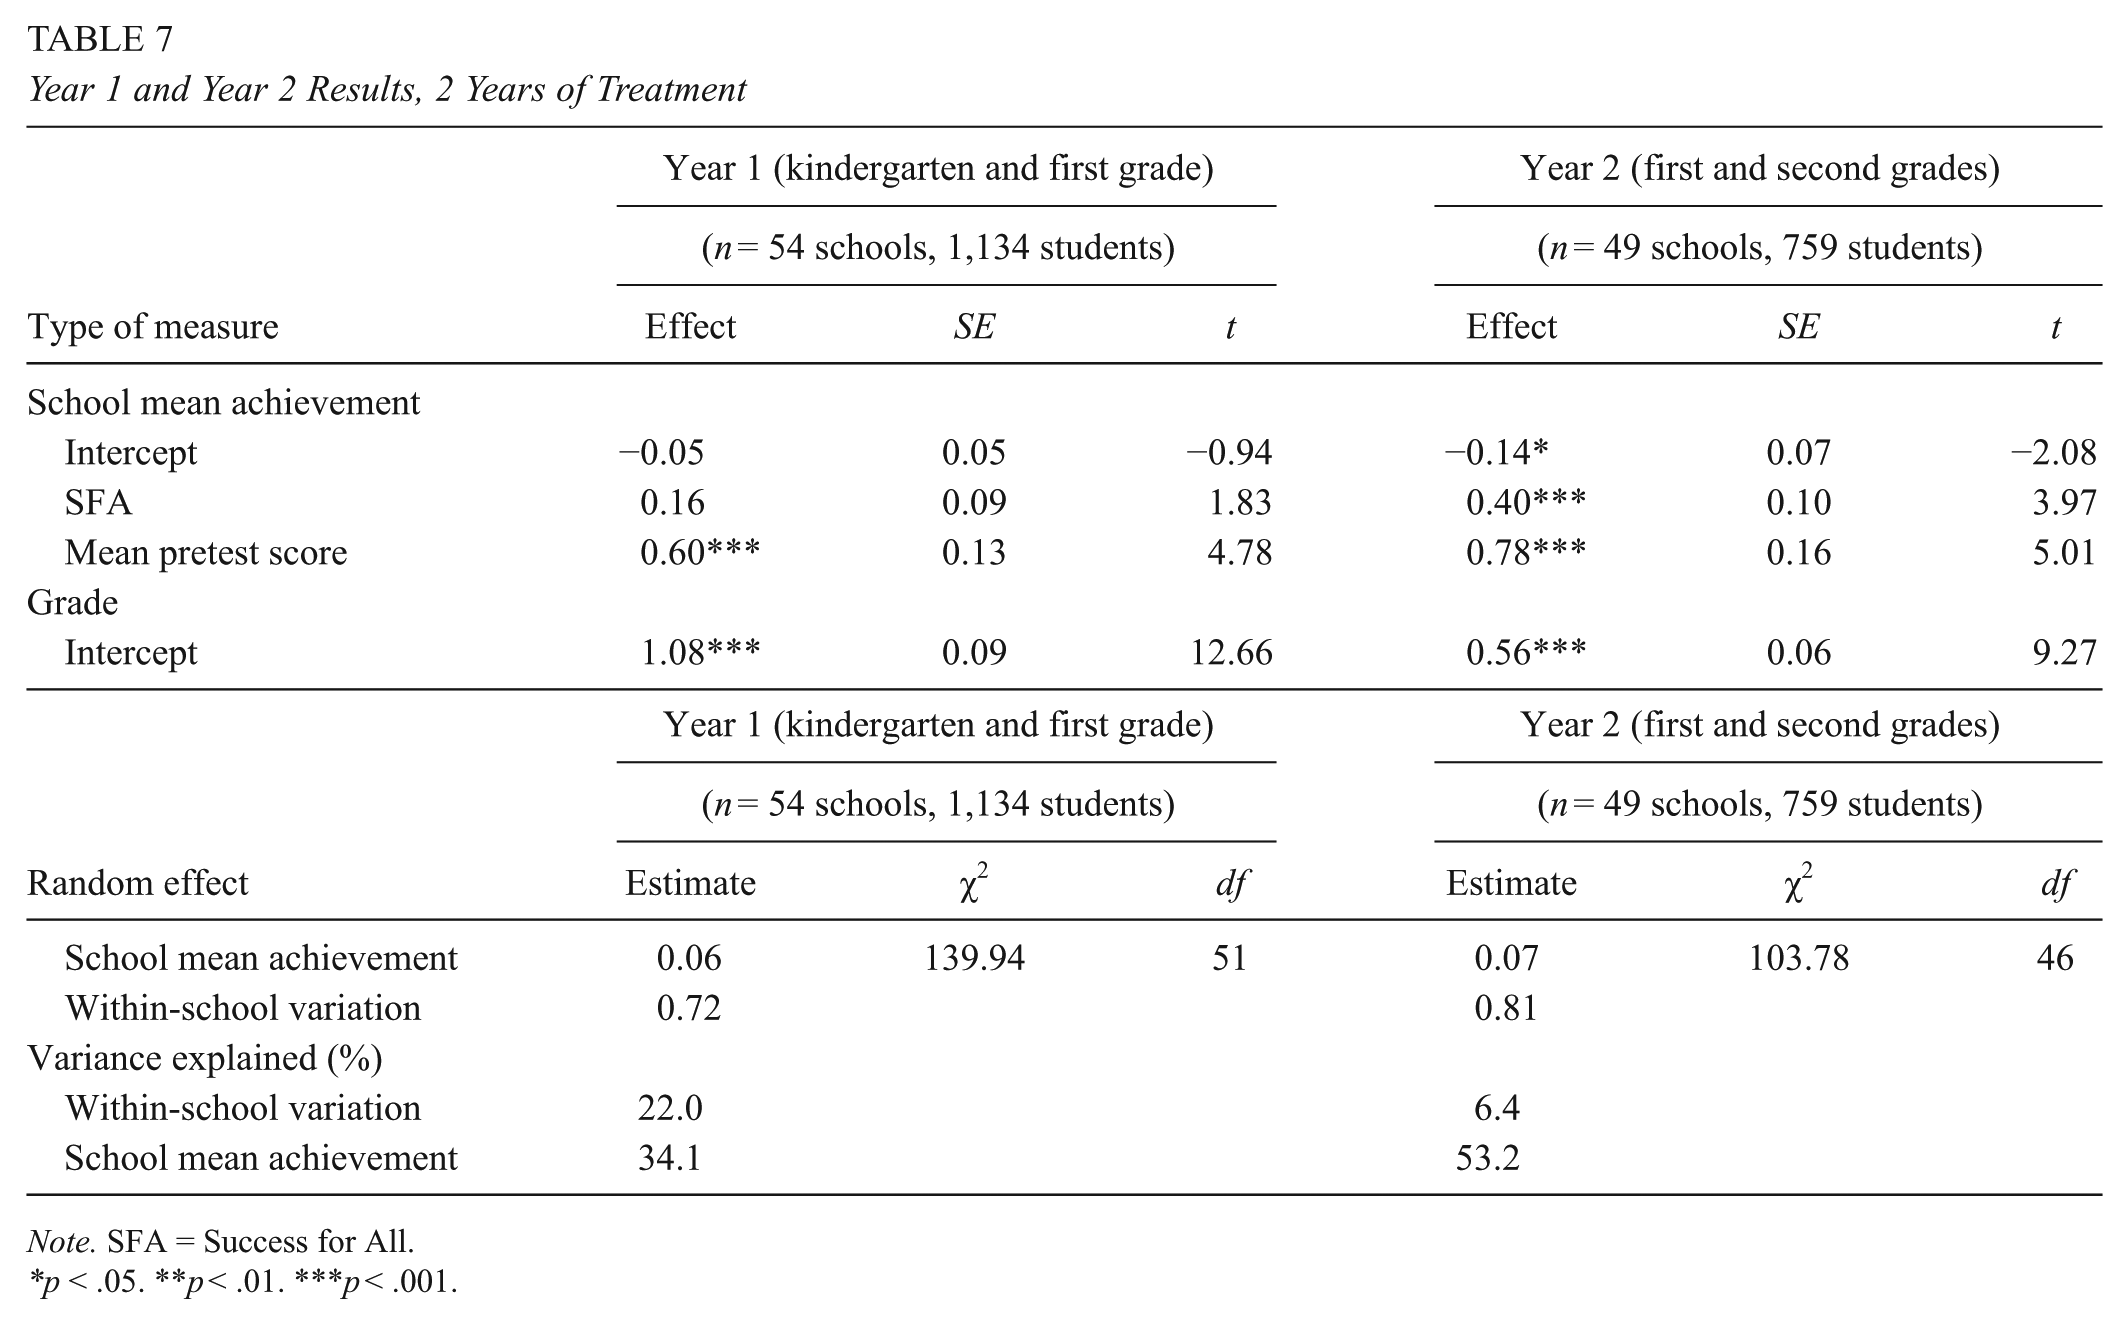
As exploratory analyses, we also examined the effects of experimental schools that had experienced 1 year and 2 years of treatment on posttest achievements. As indicated in Table 7, the average 1-year effect was +0.16 (p < .08). The 2-year effect size was +0.40 (p < .001).
Year 1 and Year 2 Results, 2 Years of Treatment
Note. SFA = Success for All.
p < .05. **p < .01. ***p < .001.
1-Year Outcomes
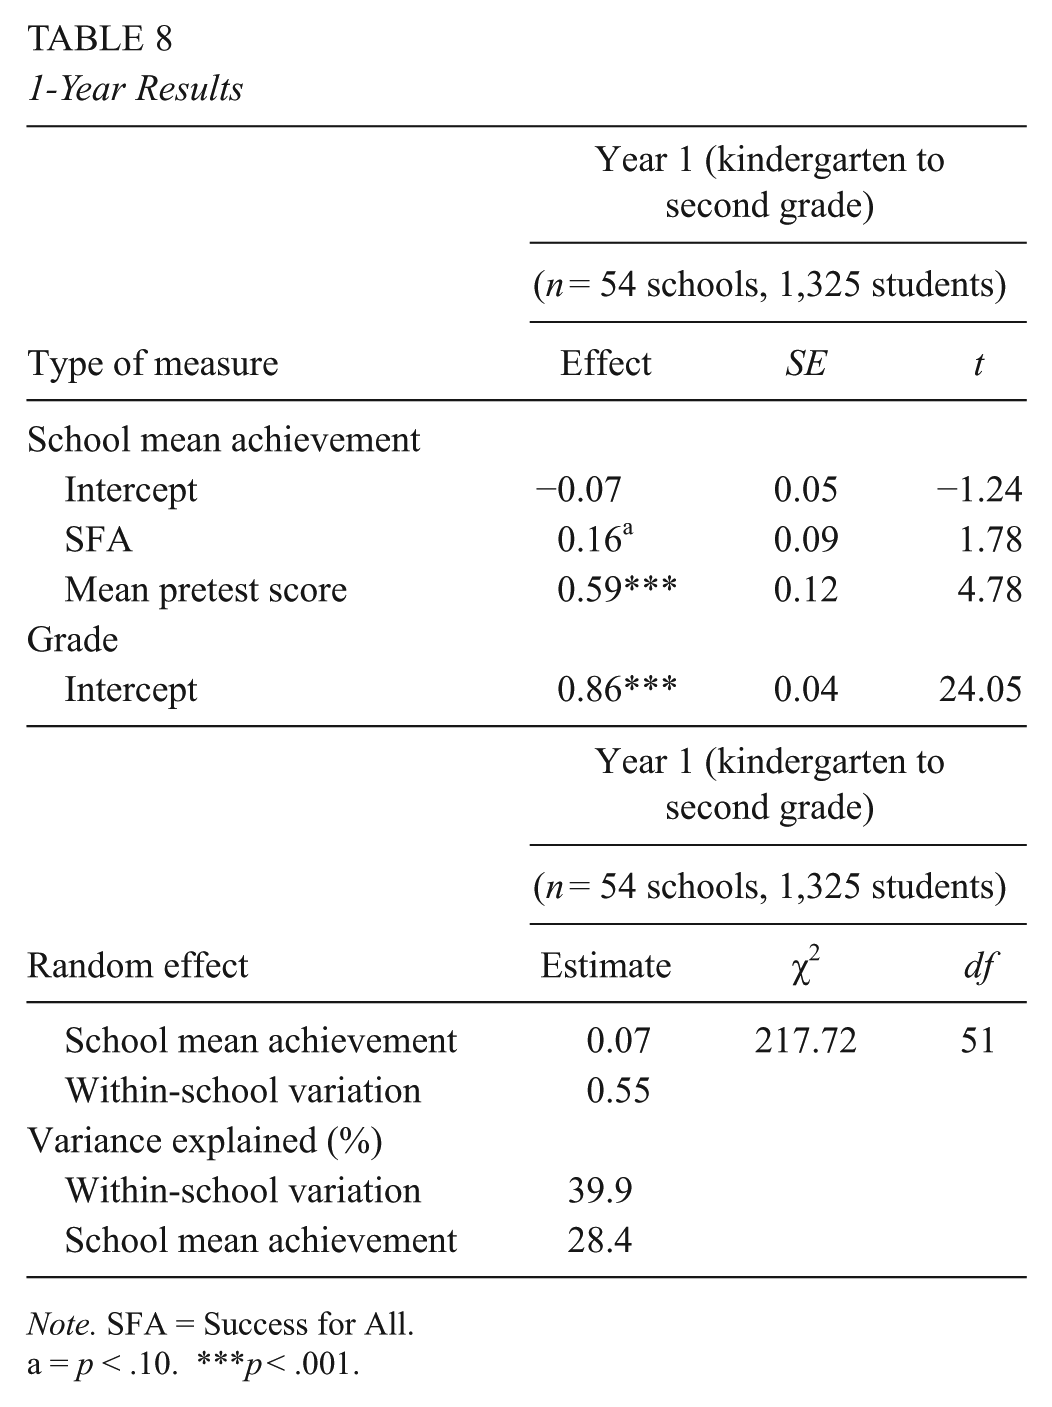
The sample in the 1-year outcome included a total of 1,325 kindergarteners and first- and second-grade students who had been in the study for only 1 year. The 1-year impacts were summarized in Table 8. At posttest, the SFA schools scored marginally higher than the controls, with an effect size of +0.16 (p < .08).
1-Year Results
Note. SFA = Success for All.
a = p < .10. ***p < .001.
Discussion
The purpose of this secondary analysis of data from the SII was to provide well-supported achievement data for the study only partially reported by Correnti (2009) and Rowan et al. (2009). Effect sizes after the confirmatory 3-year longitudinal comparison in the present analysis were statistically significant in a rigorous HLM analysis. Correnti (2009) estimated an effect size of +0.43 for the cohort that received 3 years of SFA, whereas the current analysis found an effect size of +0.26, still an educationally meaningful effect.
Exploratory 2-year impacts of SFA were similar to 3-year impacts, with an effect size of +0.36 for students in the 2nd year of the 3-year longitudinal sample, +0.16 (p < .08) for the K–1 sample, and +0.40 (p < .001) for the Grades 1–2 sample. The mean effect size for students who received 2 years of treatment was +0.31. For students who received 1 year of treatment, effect sizes averaged +0.16 (p < .08) in the HLM analysis. The substantial increase in effect sizes from 1 year to 2 or 3 years of SFA experience matches findings from Borman et al. (2007) and Quint et al. (2015), although the 3-year Borman et al. (2007) study found that effect sizes continued to increase in the 3rd year of SFA.
The observation that it takes 2 years or more to make comprehensive school reforms show their full effects has also been made by Fullan (2001); Borman, Hewes, Overman, and Brown (2003); and others.
The findings provide further confirmation of the effectiveness of SFA in improving reading, though (as in previous studies) the program had to be provided for at least 2 years to show its full effect (Borman et al., 2007). Because the data come from a very large national study carried out by third-party researchers, the SII adds confidence that SFA can be effective at substantial scale, an increasingly important issue in a policy climate of increasing focus on evidence of effectiveness in education.
Policy Implications
The findings of the SII, both as originally reported and as largely confirmed in the secondary analysis, have broad implications for educational policy. From reports on large-scale, mostly randomized experiments evaluating educational interventions, it is becoming apparent that most innovations do not consistently improve students’ achievement outcomes. Most of the exceptions involve one-to-one or one–to–small group teaching. For whole schools and major subjects, there are few clear examples of programs that are shown to be effective in comparison to control groups on measures that fairly assess what was taught in experimental and control groups.
SFA is one of few examples of whole-school reforms that have had such positive impacts in two large, cluster randomized experiments (Borman et al., 2007; Quint et al., 2015) and in the SII reported here as well as in many smaller experiments (Slavin, Lake, et al., 2009).
At this point in time, it is important to ask why this particular program has been so consistent in its impacts. One potential answer is provided by the original SII, which obtained detailed teacher logs to characterize program implementation. The teacher log data reported by Correnti and Rowan (2007) and Rowan and Miller (2007) showed a clear impact of SFA on teachers’ reported behaviors, which were in line with the SFA theory of action and emphasis. Similarly, the logs reported in the evaluation of AC also documented teaching in line with the program’s theory of action and emphasis. In both cases, outcomes mirrored the programs’ emphasis, with the main outcomes of SFA seen in early elementary reading whereas those of AC were seen in upper elementary writing. ASP, whose teachers did not report much change in behaviors, also did not find any effects on achievement. These findings suggest the possibility that many attractive-sounding interventions, such as ASP, may be failing to show positive effects on achievement measures because they are not achieving major changes in teachers’ behaviors.
SFA places a substantial emphasis on extensive and explicit coaching to help teachers change their daily teaching behaviors (Slavin, Madden, et al., 2009). It provides all 1st-year schools at least 26 person-days of on-site coaching, an in-school facilitator to work with all staff, a week of training for principals and facilitators, an annual conference, and constant electronic communications and sharing of data, ideas, and feedback. To bring about profound changes in teachers’ daily behaviors, it might be argued that nothing less is likely to be effective.
The Success for All Foundation (SFAF), which developed and supports the program, has an institutional culture focused on leaving as little as possible to chance. In fact, as part of the SII project, Peurach (2011) studied SFAF over more than a decade and documented this cultural focus as well as ongoing attempts to learn from its own network of schools to incorporate best practices in its training, coaching, and materials (see also Cohen et al., 2014; Peurach, 2011).
It is entirely possible that many whole-school reform approaches starting from very different theoretical or philosophical bases could be effective in improving student achievement. However, the experience of SFA, especially as revealed in the SII, suggests that educational interventions are most likely to achieve their desired outcomes if they make certain to provide the professional development and schoolwide supports necessary to bring about meaningful changes in instructional practices throughout the school. If evidence-based reform is to transform America’s schools, we need many whole-school approaches with strong evidence of effectiveness from rigorous evaluations. The Study of Instructional Improvement and the broader experience of SFA suggests that whatever these approaches may be, ensuring quality of implementation is essential.
If federal education policies are to make substantially greater impacts on student outcomes, they must sooner or later embrace policies promoting the use of federal resources to implement proven, replicable programs (Cohen & Moffitt, 2009). However, this shift is unlikely to take place if there are too few proven programs for schools to choose. The lessons of the SII, emphasizing the need to ensure that programs do whatever it takes to see that teachers embrace and regularly utilize innovative strategies, support the idea that systematic, school-by-school reform can amount to important changes in outcomes.
Footnotes
Notes
Authors
ALAN C. K. CHEUNG, PhD, is currently a professor in the Department of Educational Administration and Policy and director of the Centre for University and School Partnership (CUSP) at The Chinese University of Hong Kong. His research areas include educational technology, school reform, and research reviews.
ROBERT E. SLAVIN, PhD, is the director of the Center for Research and Reform in Education at Johns Hopkins University, and chairman of the board of the Success for All Foundation. His research interests include evidence-based reform in education, research reviews, and cooperative learning.