
Abstract
This study compares the early life experiences of kindergarteners in 1998 and 2010 using two nationally representative data sets. We find that (a) young children in the later period are exposed to more books and reading in the home, (b) they have more access to educational games on computers, and (c) they engage with their parents more, inside and outside the home. Although these increases occurred among low- and high-income children, in many cases the biggest changes were seen among the lowest-income children. Our results indicate narrowing but still large early childhood parental investment gaps. In addition, socioeconomic gaps in preschool participation grew over this period, despite substantial investments in public preschool. Implications for early socioeconomic achievement gaps are discussed.
E
It is not clear, however, to what extent increased public investment in early childhood, as well as parents’ heightened understanding of the importance of early childhood interactions, has had a meaningful impact on children’s early life experiences and, in turn, led to narrowed school readiness gaps. For example, it may be that growing public investments in preschool have helped low-income children enter kindergarten more ready than they did two decades ago. Or perhaps the importance of talking and reading to young children is now more widely recognized, and low-income children experience more language-rich environments than they once did.
Yet, the United States experienced notable demographic shifts over the past decade and a half. Poverty rose, particularly child poverty, as did income inequality (DeNavas-Walt, Proctor, & Smith, 2014). In addition, the Great Recession of 2007–2009 led to a doubling in unemployment (Bureau of Labor Statistics, 2012). These demographic shifts may have counteracted, at least in part, policy efforts aimed at improving children’s early life experiences.
To date, there has been no systematic examination of whether and to what extent children’s early experiences have changed in recent decades. The current study aims to fill that gap by using two large, nationally representative data sets of kindergarten entrants from 1998 and 2010. Importantly, these are the same two data sets in which studies have documented narrowing school readiness gaps among incoming kindergarteners (Bassok & Latham, 2016; Magnuson & Duncan, 2014; Reardon & Portilla, forthcoming). Our analysis seeks to determine how children’s home and preschool experiences have changed for those two cohorts.
We begin by examining how demographic factors that likely relate to early life experiences and children’s readiness have changed. We then turn to children’s early childhood experiences—with and away from their parents—and describe changing levels and changing socioeconomic gaps. Specifically, the article documents changes over time in five aspects of children’s early life: child care experiences, home technology, home literacy environment, enrichment activities (e.g., participation in clubs or excursions to museums), and parental beliefs about school readiness.
We document striking changes in many of the dimensions examined. For instance, the data indicate increases in children’s access to home technology, books and home reading practices, enrichment activities, and parents’ beliefs about the importance of school readiness practices. Nearly all of these changes are in the direction hypothesized to improve children’s development. Furthermore, we find evidence that many, though not all, of these changes are in a direction that would suggest narrowing socioeconomic status (SES) gaps. In particular, we document a striking narrowing of the SES gap with respect to access to home technology and also find diminishing gaps with respect to parent-child enrichment activities inside and outside the home.
However, not all gaps have narrowed, and our findings about child care participation provide the most surprising counterexample. In particular, despite heightened public investment in public preschool, low-income children in 2010 were less likely than their counterparts in 1998 to attend formal child care or preschool in the year before kindergarten and more likely to be cared for solely by their parents, perhaps reflecting the effect of the Great Recession and the concomitant increase in unemployment. In contrast, formal care use for middle- and high-income children increased slightly or stayed constant. Counter to our predictions then, our results indicate growing gaps between low- and high-income children with respect to preschool participation.
Background
Large SES gaps in “school readiness” at kindergarten entry have been widely documented. Isaacs (2012), for example, showed that in 2006, <50% of poor children in the United States entered kindergarten “school ready,” as reflected by a composite measure including direct assessments of early literacy and math knowledge, teacher-reported measures of behavior, and parent-reported measures of health. In contrast, 75% of children from moderate- or high-income families entered kindergarten “ready.” Reardon and Portilla (forthcoming) similarly showed that in 2010, kindergarteners whose family income was at the 10th percentile were more than a standard deviation behind on math and reading assessments relative to peers with family income at the 90th percentile.
These early SES gaps mirror substantial differences in the early home experiences of low- and high-income children. Hart and Risley (1995) provided the seminal example documenting that young children of welfare recipients heard approximately 616 words per hour, as compared with roughly 2,153 words per hour heard in the homes of higher-income children. The authors of this very small but highly influential study extrapolate from the hourly discrepancy to suggest that by age 4 years, children in high-income homes have likely heard roughly 30 million more words than their low-income peers have.
While the original Hart and Risley study is now nearly two decades old, recent studies continue to document stark SES differences with respect to a range of parental investments and childhood experiences, including language environments, reading practices, extracurricular activities, and exposure to engaging out-of-home settings (Bradley, Corwyn, McAdoo, & Coll, 2001; Gilkerson & Richards, 2009; Lareau, 2003). For instance, Kaushal, Magnuson, and Waldfogel (2011) highlighted sizable gaps across SES quintiles in dollars spent on child care, preschool participation, and access to a home computer, among others. Similarly, Phillips (2011) documented substantial gaps in exposure to “novel places” (playgrounds, museums, errands, etc.), hours per week engaging in joint literacy activities, and the primary caregiver’s verbal responsiveness.
Although existing studies provided evidence of striking gaps in early childhood experiences, we know relatively little about how young children’s early life experiences have changed since the late 1990s. The goal of this article is to move beyond cross-sectional descriptions of early childhood experiences to provide an examination of changes in early experiences. In particular, it aims to measure to what extent SES gaps in early experiences have broadened or narrowed over a 12-year period.
Our work is the first to examine trends in parenting practices, specifically for young children, during a period where public investment and interest in early childhood education have grown rapidly. However, existing studies, focusing on a wider age range of children and an earlier period, suggest that parents’ spending on children has been on the rise since the 1970s and that the increase has been pronounced among high-income families (Duncan & Murnane, 2011; Kornrich & Furstenberg, 2013). There is also evidence that parents’ time with children has been increasing since the mid-1990s, with the sharpest increase among highly educated families (Ramey & Ramey, 2010). While these accounts do not focus specifically on early childhood, one plausible hypothesis is that similar patterns have emerged in children’s early years.
Indeed, in a recent essay, Reardon (2013) described “the growing perception that early childhood experiences are central to winning a lifelong educational and economic competition.” He hypothesized that families are increasingly investing in young children and that higher-income families may be doing so at rates that outpace middle- and low-income families. Consistent with Reardon’s claim that early childhood experiences are seen as uniquely important points in children’s lives, Kornrich and Furstenberg (2013) demonstrated that before the 1990s, parents invested most heavily in their teenage children but, in more recent years, have invested the most when children are <6 years old.
Taken together, the existing research on parental investment, as well as growing socioeconomic achievement gaps among older school-age children, provides support for the notion that early childhood parental investments also increased between 1998 and 2010 and that gaps in these investments between rich and poor children have also broadened.
At the same time, we also know that “school readiness gaps” have narrowed over this period (Magnuson & Duncan, 2014). Between 1998 and 2010, the gap in reading skills at kindergarten entry between children at the 90th and children at the 10th percentile with respect to income narrowed by 16%, and the math gap narrowed by about 10% (Reardon & Portilla, forthcoming). Bassok and Latham (2016) provided similar evidence of narrowing gaps in teacher-reported measures of school readiness and showed that low-income children are entering school with stronger preliteracy and prenumeracy skills than they were 12 years earlier.
These trends, which coincided with substantial public and private investments in early childhood development, lead us to hypothesize narrowing early childhood gaps with respect to preschool participation and parental involvement. In particular, we expect to see increases in public preschool participation, leading to a narrowing in the income gap in formal preschool participation. We also hypothesize across-the-board increases in home literacy practices and parent-child interactions, with particularly large increases among lower-income families.
Leveraging rich data from two large, nationally representative samples of kindergarten children, we examine changes over time across a host of parent-reported measures about their investments in and interactions with their young children. In each case, we consider changes in levels and in gaps. We consider five key dimensions of children’s experiences: child care experiences, home technology, home literacy environment, enrichment activities (e.g., participation in clubs or excursions to museums), and parental beliefs about school readiness. As described further, most of these dimensions have been the subject of considerable research and are associated with children’s development. Although no set of survey items can fully capture children’s early life experiences, the extensive measures considered here provide an unusually rich look at changes over time in young children’s lives.
Early Childhood Experiences and Children’s Development
Measuring the causal relationship between parental investments and practices and child outcomes is challenging. Families with higher incomes may invest more time and resources in their young children, and their children may perform better on a variety of school readiness measures. It is notoriously difficult to disentangle, however, whether the time and resources spent cause child outcomes to improve or whether the positive association between parental investments and child outcomes is explained through other mechanisms. Here we briefly summarize what is known about the link between various forms of parental investments and child outcomes, emphasizing the most rigorous evidence available and noting when the existing evidence is largely correlational.
Child Care Arrangements
A large body of experimental and nonexperimental evidence demonstrates that high-quality preschool experiences can meaningfully affect children’s short- and long-term learning trajectories (Campbell et al., 2012; Cunha & Heckman, 2010; Deming, 2009; Yoshikawa et al., 2013). Many studies have shown that, with respect to academic and cognitive outcomes, children who have formal or classroom-based early learning experiences outperform those who are in informal settings, such as family child care homes or babysitters, as well as those who are home with a parent (Bernal & Keane, 2011; Loeb, Bridges, Bassok, Fuller, & Rumberger, 2007; Magnuson, Ruhm, & Waldfogel, 2007).
At the same time, there are substantial differences by SES in access, take-up, and quality of formal care arrangements (Bassok & Galdo, 2016; Fuller & Liang, 1996; Magnuson, Meyers, & Waldfogel, 2007; Magnuson & Waldfogel, 2005). Families with the most resources disproportionately send their 3- and 4-year-old children to formal care arrangements, followed by very low-income children, who have historically benefited from access to highly targeted and regulated public preschool programs. Families whose income level exceeds the bar for targeted programs often struggle to find affordable, formal care arrangements (Fuller, Loeb, Strath, & Carrol, 2004).
Over the past two decades, policy interest and investment in early childhood education have been on the rise. For instance, state spending for preschool more than doubled between 2002 and 2014, from $2.4 billion to $5.6 billion (Barnett, Carolan, Squires, Clarke Brown, & Horowitz, 2015), and the number of children enrolled in public early childhood programs rose from 1.2 million to 2.6 million from 1990 to 2013 (Current Population Survey, 2015). One plausible hypothesis is that this investment in public preschool has narrowed socioeconomic gaps in formal care utilization since the late 1990s. Increases in public programs may have also served to alter the distribution of children across types of formal care settings (e.g., private child care settings, public prekindergarten programs, and Head Start).
Exposure to Home Technology
Disparities in access to enriching learning materials for children within their homes are also pronounced (Bradley et al., 2001). There is ample empirical evidence, for instance, of a “digital divide” between lower- and higher-income children with respect to access to and use of home computers (Calvert, Rideout, Woolard, Barr, & Strouse, 2005). Using nationally representative data, Rathbun, West, and Hausken (2003) found that in 1998, only 18% of kindergarteners in the bottom SES quintile had and used a home computer, as compared with 83% of kindergarteners in the top SES quintile. Data about the U.S. population as a whole suggests that large gaps remained as recently as 2013. For instance, among householders with less than a high school degree, 56% had a home computer and 43% had high-speed Internet, as compared with 96% and 89%, respectively, among householders with a bachelor degree or higher (File & Ryan, 2014).
Nevertheless, given the reduced cost and increased prevalence of computers, tablets, and mobile devices, we hypothesize that gaps in home computer exposure among kindergarteners have narrowed. A recent study of 350 children aged 6 months to 4 years in one high-poverty urban community showed that access to digital devices was nearly ubiquitous (Kabali et al., 2015). In 2014, 83% of households in this low-income community had tablets, and 77% had smartphones. Nearly all the children (97%) used mobile devices, and most 4-year-olds had their own mobile devices. Relatedly, a nationally representative survey of about 1,400 parents of 0- to 8-year-olds found no difference in the amount of time that low- and high-income children spent using computers for games, educational software, homework, or other activities (although it did document substantial gaps in the use of educational apps on mobile devices; Rideout, 2011).
The evidence is mixed regarding the impact that access to home computers and the Internet has on children’s school success. Not surprising, correlational evidence suggests a positive link between access to a home computer or home Internet and children’s academic achievement (Borzekowski & Robinson, 2005; Fiorini, 2010; Jackson et al., 2006). The experimental and quasi-experimental evidence about the impact of a home computer for school-age children suggests modest, null, or negative impacts with respect to children’s academic achievement and cognitive skills (Beuermann, Cristia, Cueto, Malamud, & Cruz-Aguayo, 2015; Malamud & Pop-Eleches, 2011; Vigdor, Ladd, & Martinez, 2014). However, there has been relatively little research about the effects of home computers and apps for young children. Two recent reports indicate that media use and educational technology has expanded and changed so rapidly that it has completely outpaced the research base (Christakis, 2014; Rich, 2014). More evidence is needed to understand the potential benefits of recent forms of technology use.
Home Literacy Environment
A much more expansive literature has documented socioeconomic disparities in children’s home literacy environments, measured in a variety of ways (e.g., books in the home, frequency of shared book reading, child’s independent play with books, trips to the library). Espinosa, Laffey, Whittaker, and Sheng (2006) reported that in 1998, kindergarteners in the bottom quintile of SES had 34 books, as compared with kindergarteners in the top quintile who had >3 times as many.
As already discussed, it is difficult to disentangle the causal relationship between home literacy environment and child outcomes because the number of books that a family has in the home and the amount of time that parents spend reading to their children are highly correlated with a host of other factors, such as family resources and family preferences around learning. A number of studies have documented meaningful associations between various measures of the “home literacy environment” and children’s literacy development (Bus, van Ijzendoorn, & Pellegrini, 1995; Evans, Shaw, & Bell, 2000; Payne, Whitehurst, & Angell, 1994; Roberts, Jergens, & Burchinal, 2005; Storch & Whitehurst, 2001; Weigel, Martin, & Bennett, 2006).
Although the causal evidence is mixed, several recent meta-analyses of experimental and quasi-experimental studies suggested that interventions aimed at improving access to books in the home generally yielded positive impacts (Kim & Quinn, 2013; Lindsay, 2010). Allington et al. (2010), for example, showed that first- and second-grade children who were randomly selected to receive a dozen free books of their choice per year for 3 years outperformed children in the control group on a high-stakes literacy assessment and that the impact was even more pronounced among low-income children. Furthermore, recent experimental evidence suggests that changes in home literacy practices are associated with improvements in children’s early literacy outcomes (York & Loeb, 2014).
Advocacy around the importance of early reading has increased substantially over the period examined in the study. For instance, Reach Out and Read, which provides families with books and early literacy guidance through pediatricians, has grown substantially. In 1997, it distributed just over a half million books through 261 programs nationwide. By 2010, the organization distributed 6.4 million books through 4,654 programs and served more than a third of U.S. children living in poverty.
Enriching Activities
Home literacy practices capture only one relatively narrow way that parents may engage with their children. Other common ways that researchers examine parental investment is through measures of parental time use (Kalil, 2015) and children’s participation in structured enrichment activities, such as music lessons and athletic teams or clubs (Kaushal et al., 2011). Recent studies demonstrated substantial SES differences in the amount of time that parents spend interacting with their children and in the type of activities that they do together (Altintas, 2013; Cheadle & Amato, 2010; Guryan, Hurst, & Kearney, 2008; Kalil, Ryan, & Corey, 2012; Lareau, 2003). Participation in extracurricular activities also varies substantially across low- and high-SES children (Covay & Carbonaro, 2010; Kaushal et al., 2011).
There is extensive evidence that parental interactions with their children, particularly their time spent doing engaging activities, are associated with children’s achievement and partially explain socioeconomic achievement gaps (Bodovski & Farkas, 2008; Price, 2010; Waldfogel & Washbrook, 2011). The research examining the relationship between participation in these types of lessons, clubs, and activities and children’s developmental outcomes suggests a positive but modest association (Bodovski & Farkas, 2008; Dumais, 2006). The best quasi-experimental evidence currently available suggests that time spent in engaging activities, particularly with parents, has meaningful benefits for children’s cognitive development (Fiorini & Keane, 2014; Kalil & Mayer, 2016).
School Readiness Beliefs
We use parents’ beliefs about school readiness as a measure of their educational orientation. Existing studies showed that parents’ beliefs about the skills necessary to enter school are correlated with their parenting practices as well as their children’s developmental outcomes (Barbarin et al., 2008; Kim, Murdock, & Choi, 2005; Stipek, Milburn, Clements, & Daniels, 1992). Between 1998 and 2010, kindergarten classrooms in the United States have changed substantially, with longer school days, a greater emphasis on advanced academic content, and increased use of textbooks, worksheets, and teacher-directed activities (Bassok, Latham, & Rorem, 2016). These changes likely influenced parents’ beliefs about school readiness as well as their approaches to supporting their children’s preparation for school entrance.
Demographic Shifts and Early Life Experiences
The United States experienced notable demographic shifts over the period that we examine in the current study. Hispanic children made up 23% of all U.S. children in 2010, up from 16% in 1998, and growth in the Hispanic population accounted for more than half of the population growth in the country between 2000 and 2010 (Federal Interagency Forum on Child and Family Statistics, 2014; Passel, Cohn, & Lopez, 2011). As already noted above, the period that we study saw increases in child poverty and rising income inequality (DeNavas-Walt et al., 2014). Furthermore, the study period straddles the Great Recession of 2007–2009. Over this period, unemployment doubled from 5% to 10%, and long-term unemployment was pronounced (Bureau of Labor Statistics, 2012). These demographic shifts likely had their own direct and indirect impacts on children’s early experiences. For instance, recent research indicated that reduced work hours during the Great Recession were replaced, in part, by increases in parental time in child care (Aguiar, Hurst, & Karabarbounis, 2013). Therefore, we examine how demographic factors have shifted for our nationally representative samples of kindergarteners. We hypothesize that the rising levels of poverty, inequality, and unemployment from 1998 to 2010 would have exacerbated, rather than narrowed, many measures of parental investment, particularly those costing cost money (e.g., enrichment classes, private child care). It is possible, however, that unemployment or reduced work hours led parents to spend more time interacting with their children.
Method
Data and Sample
The data used in this study are drawn from two large studies conducted by the National Center for Education Statistics: the original Early Childhood Longitudinal Study–Kindergarten Class of 1998–1999 (ECLS-K:98) and the ongoing Early Childhood Longitudinal Study–Kindergarten Class of 2010–2011 (ECLS-K:10). The ECLS-K:98 collected data on a nationally representative sample of approximately 21,400 children who were in kindergarten in fall 1998 (representing a cohort born in 1992–1993; Tourangeau et al., 2001). Similarly, the new ECLS-K:10 collects data from a nationally representative sample of about 18,170 children who were in kindergarten in fall 2010 (representing a cohort born in 2004–2005; Tourangeau et al., 2013). 1 Both studies surveyed the children’s parents and teachers and assessed children’s skills multiple times during kindergarten and elementary school. In both data sets, a multistage probability sample design was used to choose primary sampling units first (i.e., counties or groups of counties), then schools from the selected primary sampling units, and then children from the selected schools (Tourangeau et al., 2001; Tourangeau et al., 2013).
For the analysis, we used data from the fall and spring of children’s kindergarten year (i.e., fall 1998 and spring 1999 in the ECLS-K:98 and fall 2010 and spring 2011 in the ECLS-K:10). Parent interviews at these two waves provided detailed information about children’s demographic characteristics and early childhood experiences. Children who were repeating kindergarten were excluded (850 and 840 children in the ECLS-K:98 and ECLS-K:10, respectively). 2 Children without a valid sample weight were also excluded, leaving a final analytic sample of 18,940 in the ECLS-K:98 and 14,850 in the ECLS-K:10.
We conducted multiple imputation employing chained equations to address missing information on socioeconomic measures as well as on measures of children’s demographic characteristics and early childhood experiences. The missing rate of the measures ranged from 0.01% for child gender to 33% for paternal employment in the ECLS-K:98 and from 0.4% for child gender and age to 38% for paternal employment in the ECLS-K:10. The imputation model included all the variables described below and generated 20 imputed data sets through the MI command in Stata, which resulted in the expected relative efficiency ranging from 98.4% to 99.9% in the ECLS-K:98 and from 98.2% to 99.9% in the ECLS-K:10 (Royston, 2005; Rubin, 1987).
Measures
As described in greater detail below, this study considered five aspects of children’s early childhood experiences: child care arrangements, home technology, home literacy environment, enrichment activities, and parental beliefs about school readiness. Because the Early Childhood Longitudinal Study parent surveys included many of the same questions across cohorts, most measures of early childhood experiences were identical across the cohorts (exceptions noted below). Gaps in early childhood experiences by SES, based on family income, were defined consistently in the two data sets. In addition, a consistent set of children’s demographic characteristics was examined.
Child Care Arrangements
Using a set of parent-reported questions from the fall kindergarten survey, this study created indicators for four mutually exclusive types of child care arrangements in the prior year: publicly funded center-based care, private center-based care, relative/nonrelative care, and only parental care. It is important to note that parents were asked about care arrangements in a different way across the two data sets. Categories were defined as consistently as possible, as detailed below.
First, this study categorized all children who attended any “formal” center-based care on a regular basis as having center-based care regardless of whether it was their primary care arrangement. We then distinguished children who attended publicly funded center-based care from children whose parents reported that their children attended private center-based care. 3
Children who attended center-based care but were not participants of public prekindergarten, Head Start, or subsidized center-based care were defined as participants in private center-based care.
Finally, among the rest of the sample, a group was identified who received relative or nonrelative care for at least 8 hours per week. These children received care from relatives (e.g., siblings and grandparents) or nonrelatives (e.g., babysitters, home child care providers, and neighbors). Any remaining children were categorized as experiencing exclusively parental care.
Home Technology
We constructed a computer composite (α = .625 in 1998, α = .691 in 2010) defined as the average score across three binary indicators of computer use: (a) Child uses a home computer at least three times in a typical week; (b) child uses computer programs that teach reading or math; and (c) child uses a home computer to access the Internet.
Home Literacy Environment
We use two measures of home literacy environment. The first is the number of children’s books, including library books, currently in the home at the fall kindergarten survey. Because the number of books may have a decreasing association with school readiness, we report the average logarithm of the number of books as well as the average number of books. The second is a composite measure to capture literacy activities in the home (α = .581 in 1998, α = .635 in 2010), which is defined as the average of four binary indicators drawn from the fall kindergarten survey: Child read to parents (or others) outside of school; child looked at picture books outside of school; parents read books to child; and parents told stories to child. Each of these was dichotomized to indicate whether parents did the literacy activity at least three times per week.
Enrichment Activities
We consider two broad measures of parental investment in engaging activities for their children, inside and outside the home. The composite measure of learning activities in the home (α = .627 in 1998, α = .644 in 2010) is the average of seven binary indicators drawn from the fall kindergarten survey in which parents reported the frequency with which they sang songs to child, helped child do arts/crafts, involved child in household chores, played games/did puzzles with child, talked about nature/doing science projects, built something with child, and played a sport or exercised together. Again, these were dichotomized to indicate whether parents did each at least three times per week.
The composite measure of out-of-home enrichment activities (α = .594 in 1998, α = .580 in 2010) is the average of 12 binary items from the spring kindergarten survey that indicate whether children took part in excursions with their parents or in enriching lessons or clubs in the past month. The following items were included: went to a library, concert, zoo, or museum; participated in dance lessons, organized athletic activities, organized clubs, music/singing lessons, drama lessons, art classes/lessons, craft classes/lessons, or organized performing arts.
Parental Beliefs About Skills for Kindergarten
Six binary items indicate whether parents believe that the following skills are “essential” for kindergarten readiness: counting to 20, sharing with others, sitting still/paying attention, knowing letters, communicating verbally, and holding/using a pencil. A composite score of parental beliefs about skills for kindergarten (α = .793 in 1998, α = .844 in 2010) was created as the average of these six binary measures.
Household Income
Household income (i.e., the total income of all persons in the household over the past year, including salaries/other earnings, interest, retirement) was self-reported by parents during the spring kindergarten interview. In the ECLS-K:98, household income was measured on a continuous scale, but following Reardon and Portilla (forthcoming), this study converted the continuous income values into 18 categories, as measured in the ECLS-K:10. 4 Analyses compare the experience of children whose families are at the 10th, 50th, and 90th percentiles of these distributions. In describing family income, this study sometimes refers to these ranks as low, middle, and high income, respectively.
Demographic Characteristics
To contextualize the changes in parental investment practices and children’s early experiences, this study documents changes over time in several key demographic characteristics of children and their families. First, we included an indicator for marital status as married when the focal child was born. Maternal and paternal work status was measured with three categories in the fall kindergarten survey: not working/looking for work, working <35 hours per week, and working ≥35 hours per week. Two binary indicators were created for parental immigration status (i.e., whether either parent was an immigrant) and for parental language use (i.e., whether parents regularly spoke any language other than English at home). Children’s race was defined as one of five mutually exclusive categories: non-Hispanic Asian, Hispanic, non-Hispanic Black, non-Hispanic White, and other. Finally, this study included a summary measure of parental education based on three categories: high school diploma or less, some college or vocational/technical program, and bachelor’s degree or more.
Analytic Approach
This study estimated socioeconomic gaps in children’ early childhood experiences based on a method described in Reardon (2011). Using a cubic regression model, we regress each indicator of children’s experiences on family income percentile. From this function, we compute the estimated average value of the indicator for children at the 10th, 50th, and 90th percentiles of the income (or education) distribution. Gaps were estimated separately for the ECLS-K:98 and ECLS-K:10 samples. For each explanatory variable, we conducted t tests to compare predicted values (i.e., each value at the 10th, 50th, and 90th percentiles of family income and then each of the 90/10, 50/10, and 90/50 income gaps) between the two Early Childhood Longitudinal Study–Kindergarten Class data sets. Although the article focuses on income gaps, for completeness analogous analyses showing socioeconomic gaps based on parents’ educational attainment are presented in Appendix Tables A–D.
Results
We begin by documenting changes between 1998 and 2010 in children’s demographic characteristics (Tables 1 and 2) and then present our main results about changes in children’s early experiences (Tables 3 and 4).
Demographic Characteristics at the 10th, 50th, and 90th Percentiles of Income: 1998 and 2010
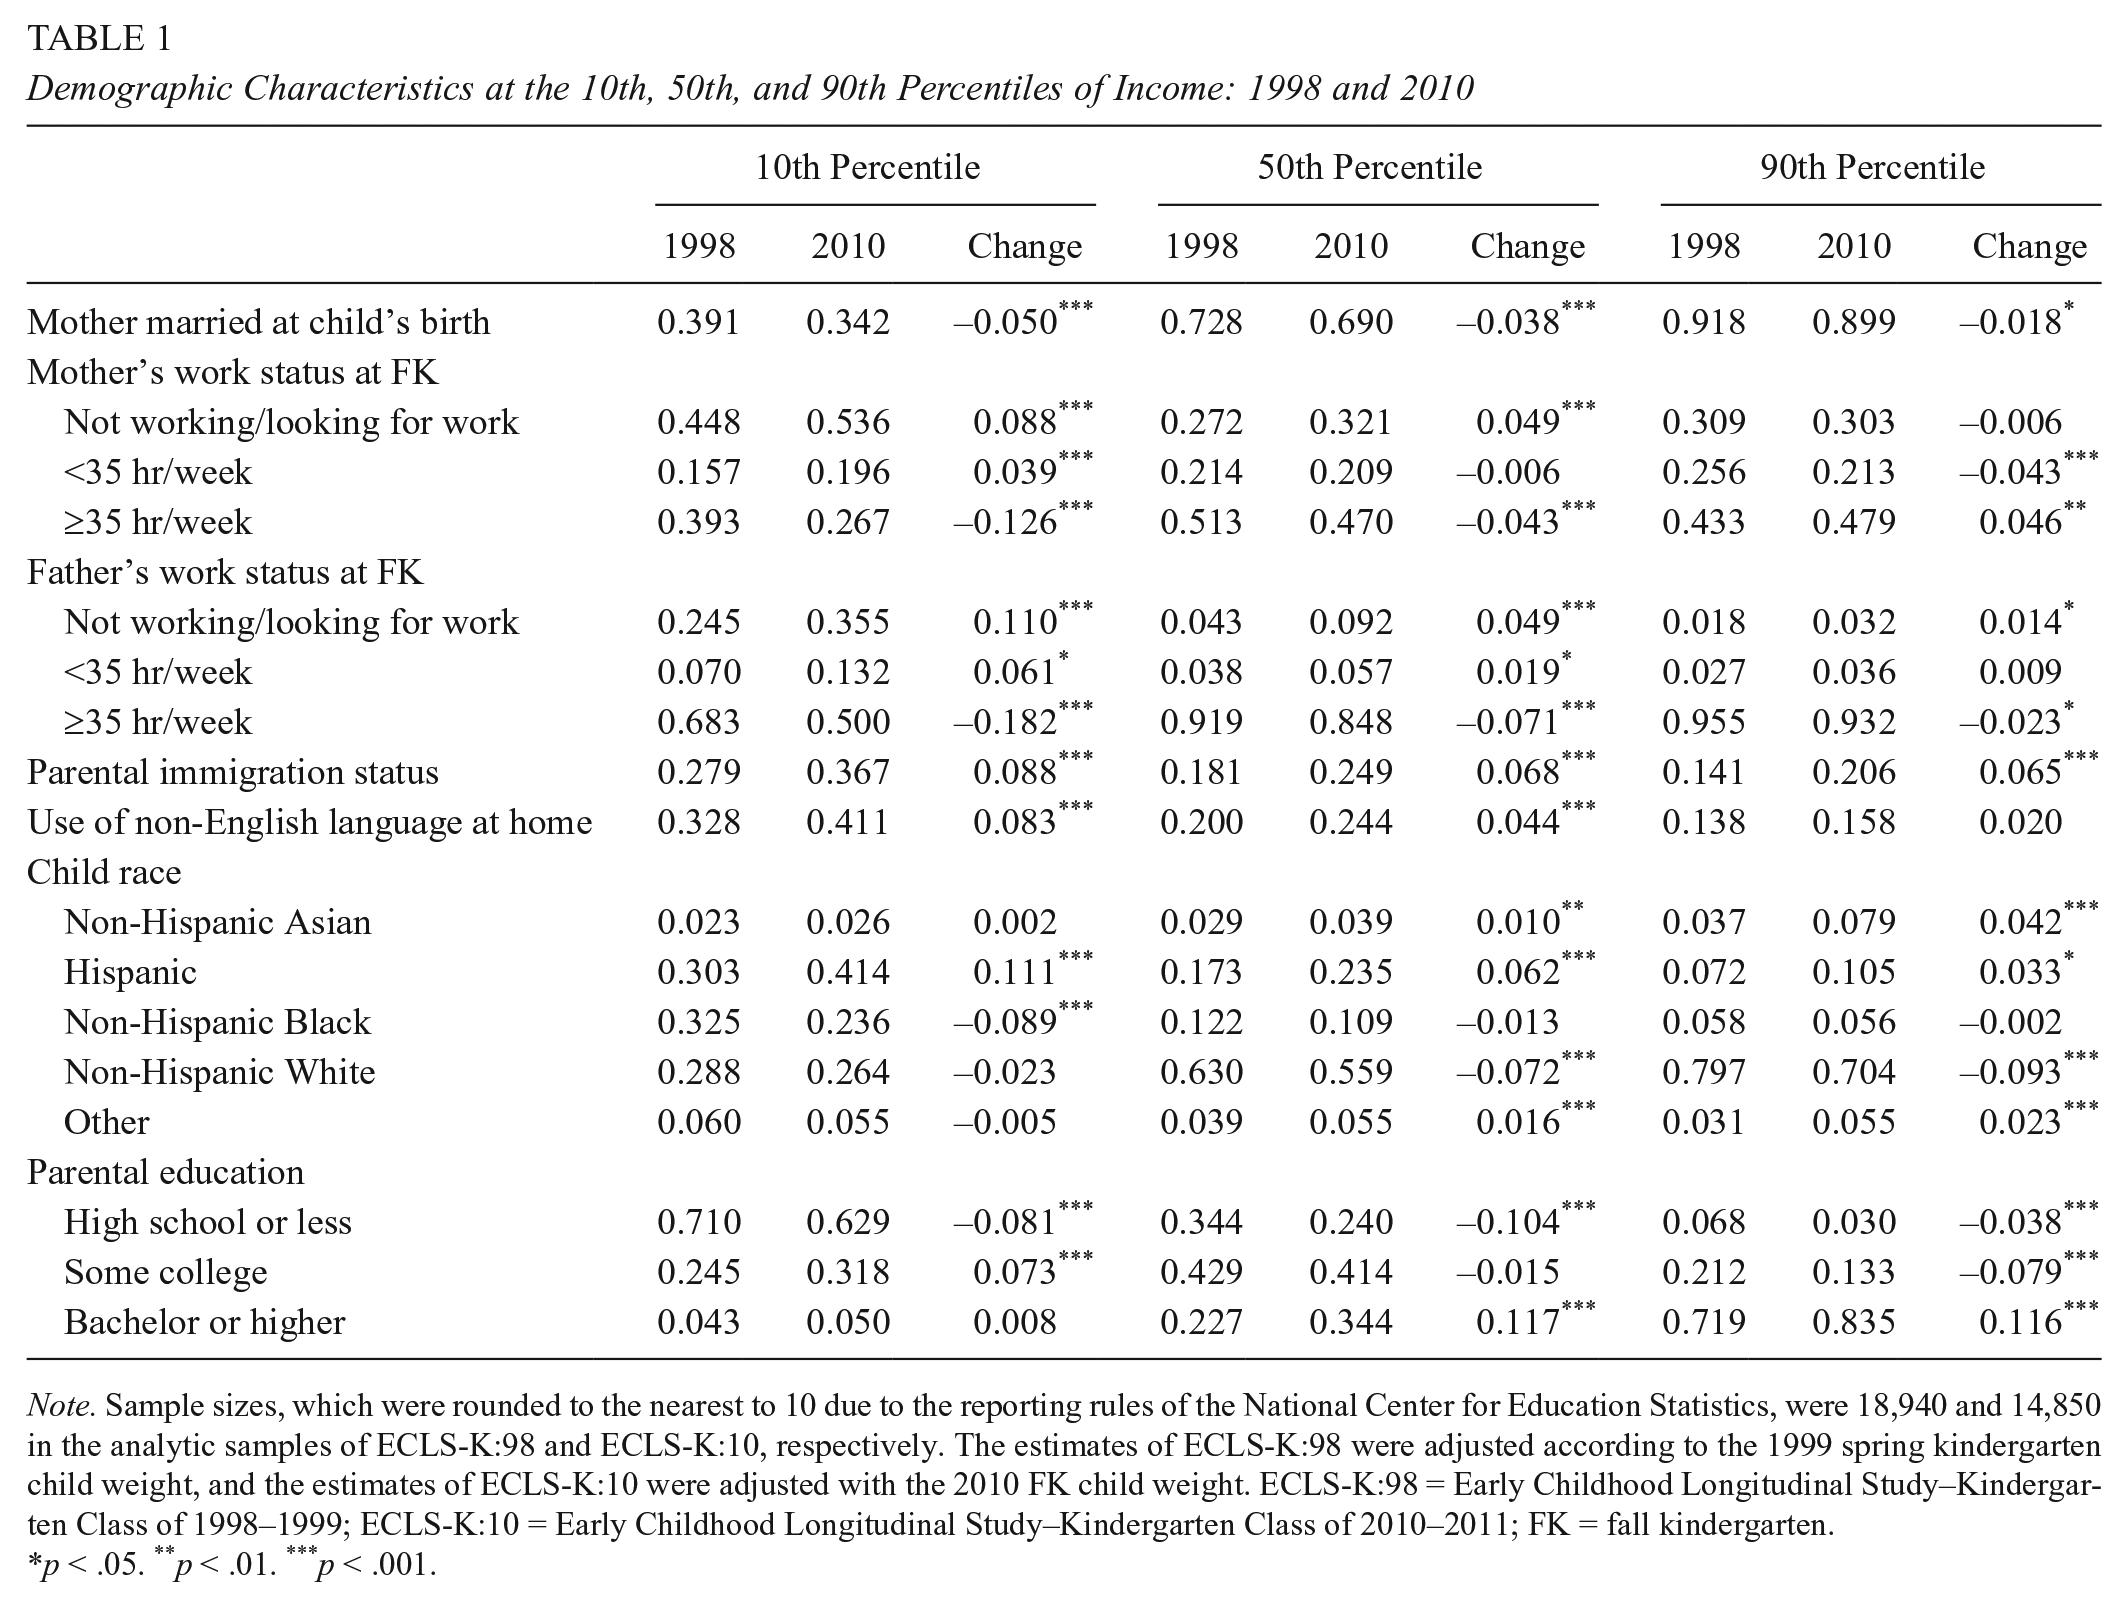
Note. Sample sizes, which were rounded to the nearest to 10 due to the reporting rules of the National Center for Education Statistics, were 18,940 and 14,850 in the analytic samples of ECLS-K:98 and ECLS-K:10, respectively. The estimates of ECLS-K:98 were adjusted according to the 1999 spring kindergarten child weight, and the estimates of ECLS-K:10 were adjusted with the 2010 FK child weight. ECLS-K:98 = Early Childhood Longitudinal Study–Kindergarten Class of 1998–1999; ECLS-K:10 = Early Childhood Longitudinal Study–Kindergarten Class of 2010–2011; FK = fall kindergarten.
p < .05. **p < .01. ***p < .001.
Income Gaps in Demographic Characteristics: 1998 and 2010

Note. Sample sizes, which were rounded to the nearest to 10 due to the reporting rules of the National Center for Education Statistics, were 18,940 and 14,850 in the analytic samples of ECLS-K:98 and ECLS-K:10, respectively. The estimates of ECLS-K:98 were adjusted with the 1999 spring kindergarten child weight, and the estimates of ECLS-K:10 were adjusted with the 2010 FK child weight. ECLS-K:98 = Early Childhood Longitudinal Study–Kindergarten Class of 1998–1999; ECLS-K:10 = Early Childhood Longitudinal Study–Kindergarten Class of 2010–2011; FK = fall kindergarten.
p < .10. *p < .05. **p < .01. ***p < .001.
Early Childhood Experiences at the 10th, 50th, and 90th Percentiles of Income: 1998 and 2010

Note. Sample sizes, which were rounded to the nearest to 10 due to the reporting rules of the National Center for Education Statistics, were 18,940 and 14,850 in the analytic samples of ECLS-K:98 and ECLS-K:10, respectively. The estimates of ECLS-K:98 were adjusted with the 1999 spring kindergarten child weight, and the estimates of ECLS-K:10 were adjusted with the 2010 FK child weight. ECLS-K:98 = Early Childhood Longitudinal Study–Kindergarten Class of 1998–1999; ECLS-K:10 = Early Childhood Longitudinal Study–Kindergarten Class of 2010–2011; FK = fall kindergarten.
p < .10. *p < .05. **p < .01. ***p < .001.
Income Gaps in Early Childhood Experiences: 1998 and 2010
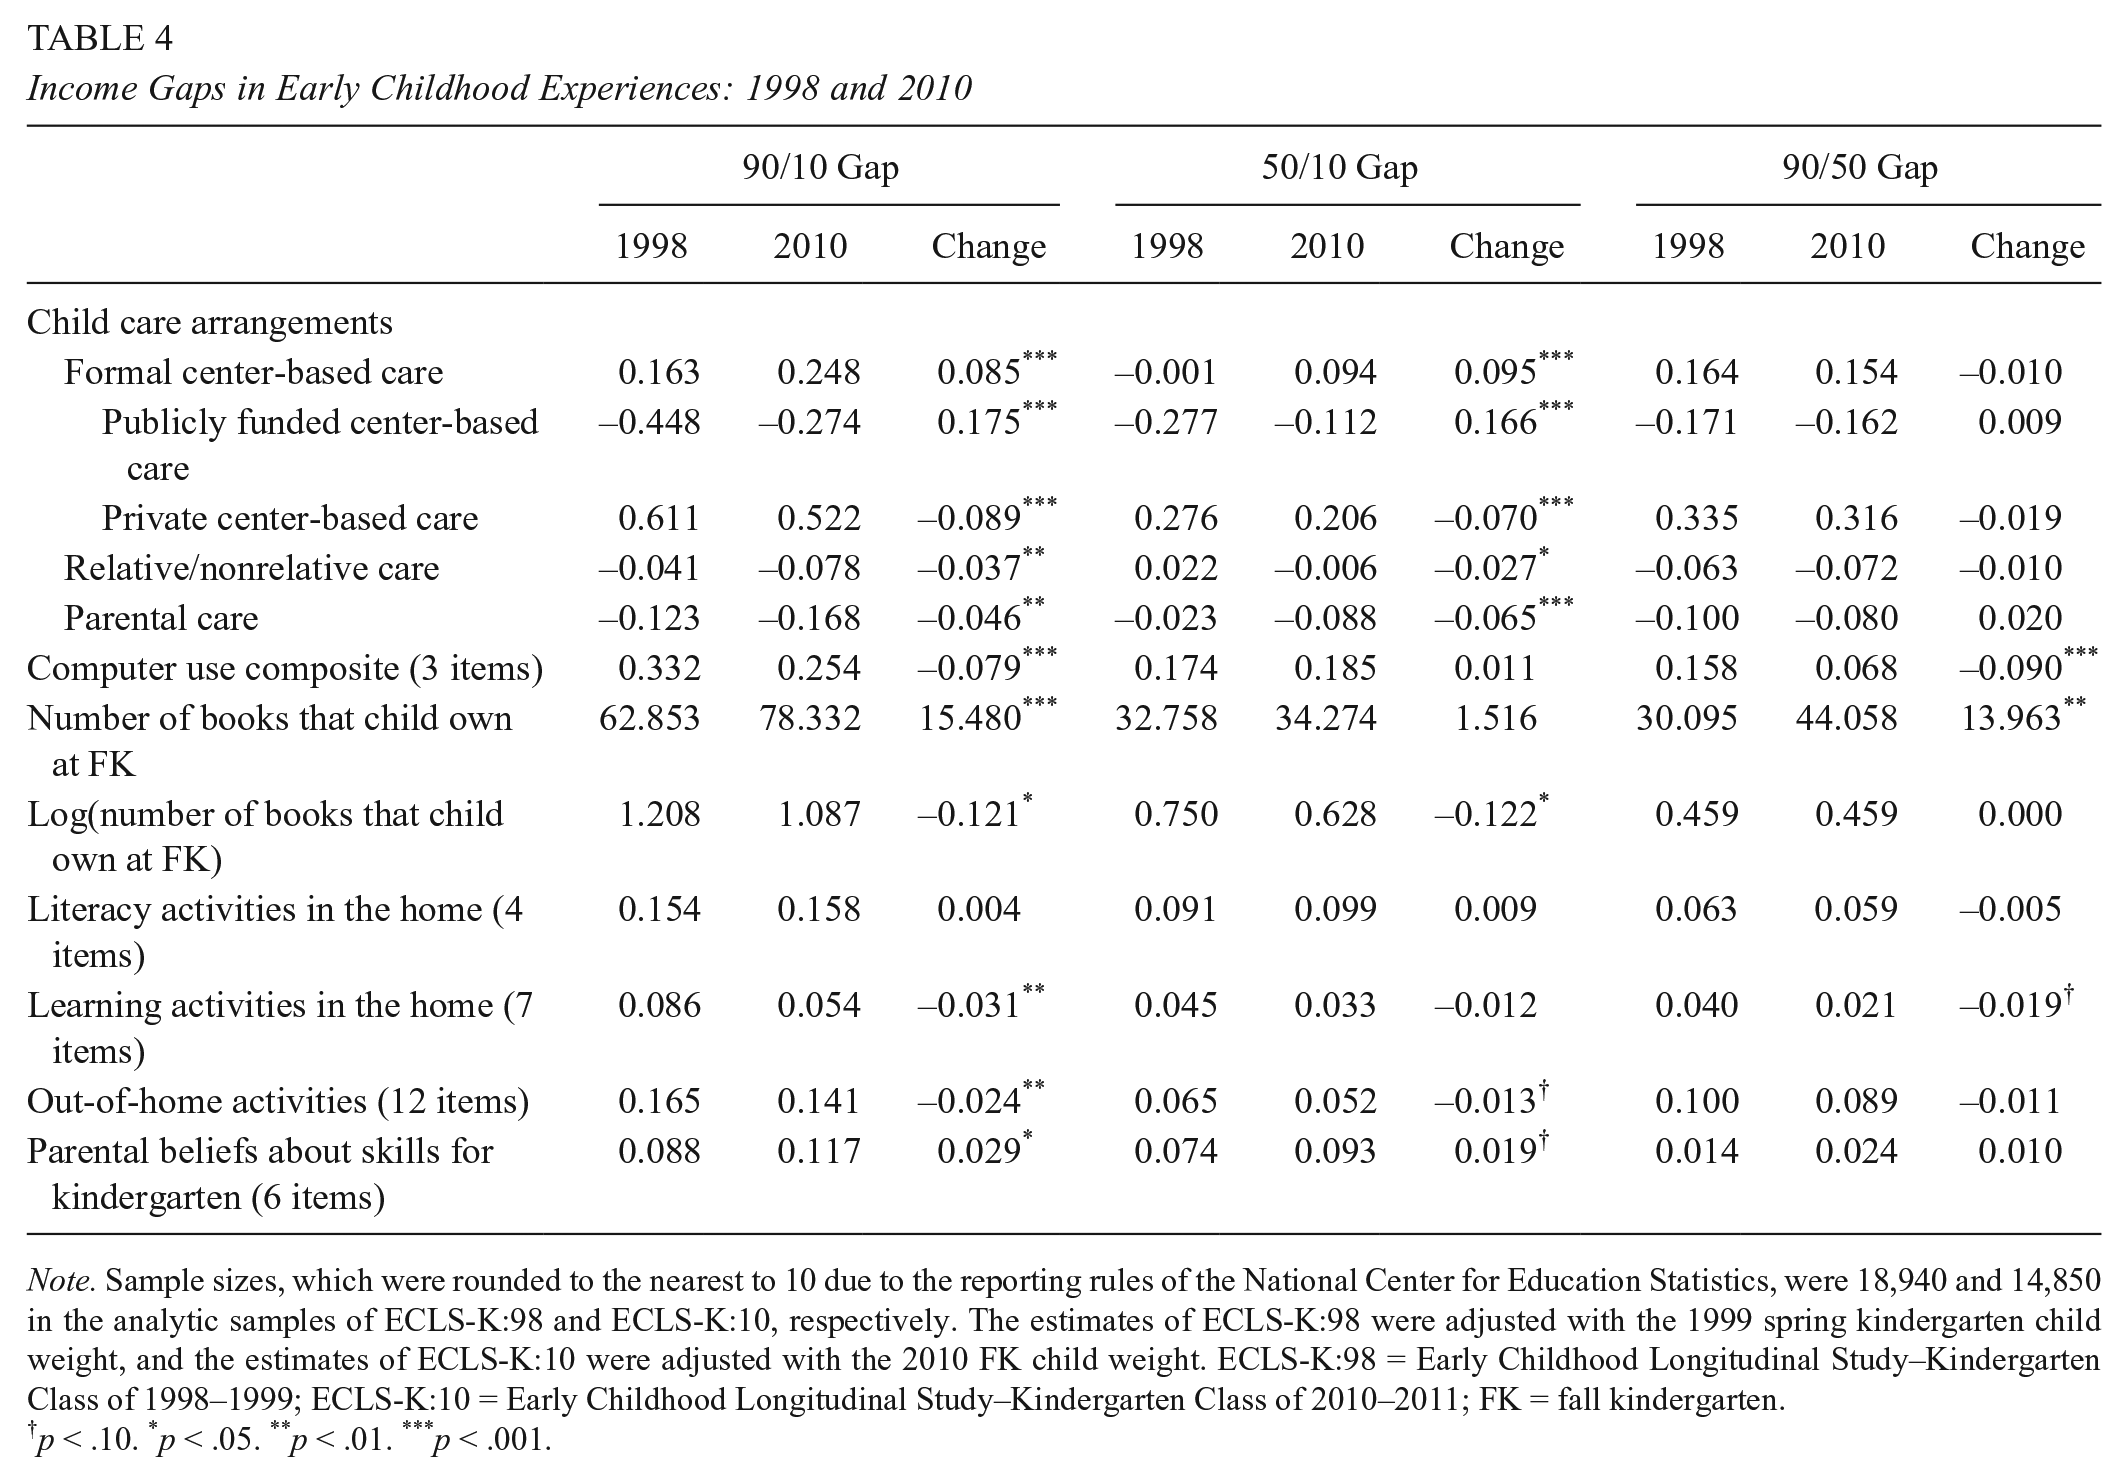
Note. Sample sizes, which were rounded to the nearest to 10 due to the reporting rules of the National Center for Education Statistics, were 18,940 and 14,850 in the analytic samples of ECLS-K:98 and ECLS-K:10, respectively. The estimates of ECLS-K:98 were adjusted with the 1999 spring kindergarten child weight, and the estimates of ECLS-K:10 were adjusted with the 2010 FK child weight. ECLS-K:98 = Early Childhood Longitudinal Study–Kindergarten Class of 1998–1999; ECLS-K:10 = Early Childhood Longitudinal Study–Kindergarten Class of 2010–2011; FK = fall kindergarten.
p < .10. *p < .05. **p < .01. ***p < .001.
Demographic Characteristics
Table 1 highlights several major shifts in child and family characteristics from 1998 to 2010. To clarify the extent to which changes are happening differentially according to family income, Table 2 presents the changing 90/10, 50/10, and 90/50 gaps in each demographic factor shown in Table 1. Notably, gaps in nearly all these demographic characteristics change in the direction that would be hypothesized to exacerbate gaps in parental investments and child outcomes.
For example, the first row of Table 1 shows that among families at the 10th income percentile, the likelihood that mothers reported being married at the time of the child’s birth dropped 5 percentage points from 39% to 34% between 1998 and 2010. We also document statistically significant drops in this measure among families at the 50th and 90th percentile; however, they are somewhat smaller. Thus, when we turn to the first row of Table 2, we see a slight but statistically significant broadening (3 percentage points) of the 90/10 gap in this measure.
Employment trends are striking. Not surprising, men at all points of the income distribution had lower rates of full-time employment on the heels of the Great Recession in 2010 than they did in 1998. Fathers in the lowest-income families saw the largest declines in full-time work (18 percentage points) and the largest increases in nonwork (11 percentage points) as compared with fathers in the highest-income group, where the changes were just 2 and 1 percentage points, respectively. Among mothers at the bottom and middle of the income distribution, there was also a notable shift away from full-time work and toward nonwork. For instance, among low-income mothers, the likelihood of full-time employment dropped 13 percentage points, while the likelihood of not working rose 9 percentage points, from 45% to 54%. In contrast, among mothers at the top of the income distribution, there was no change in nonwork, a decline in part-time work, and an increase in full-time work. Table 2 summarizes the implications of these patterns for employment gaps. It shows that the 90/10 gap in full-time employment grew by 16 percentage points for men and 17 percentage points for women.
The share of children whose parents are immigrants rose, though not significantly more at the bottom of the income distribution (8.8 percentage points) than at the middle (6.8 percentage points) or the top (6.5 percentage points). The increase in the share of families speaking a foreign language at home at the bottom of the income distribution (8 percentage points) significantly exceeded those at the middle and top (4 and 2 percentage points, respectively).
Finally, education differences across income groups, already stark in 1998, grew even wider. Families at the 10th income percentile did not make any gains in college completion. In contrast, families at the middle and top of the income distribution experienced 12–percentage point gains in college attainment.
That said, it is worth noting a narrowing between low- and high-income families in the probability of parents having only a high school degree or below. The percentage of low-income parents with a high school degree or less dropped by 8 percentage points, as more parents attended at least some college; at the 50th income percentile, there was a 10–percentage point drop. This one pattern notwithstanding, the results in Tables 1 and 2 indicate that over our study period, gaps with respect to many demographic factors, including employment and educational attainment, broadened between low- and high-income families. These growing gaps, we hypothesize, are likely to exacerbate rather than narrow school readiness gaps.
Children’s Early Experiences
We consider five dimensions of children’s early experiences. Main results are shown in Tables 3 and 4 (with analogous results by parental education in Appendix Tables C and D and further disaggregated results shown in Appendix Tables E and F).
Child Care Arrangements
Results in Tables 3 and 4 point to several notable changes in child care utilization. First, among low-income children, the most striking change is a significant (7 percentage point) drop in formal center-based care attendance and a nearly equal (6 percentage point) increase in parental care. There was not a similar drop in formal center-based care utilization among middle- and high-income families, where participation rates were fairly stable.
However, the lack of change overall masks a sizable shift out of privately-funded center-based care and into publicly- funded center-based care. Among families at the 50th percentile, participation in private center-based care dropped by 9 percentage points, and public center-based care participation rose by 11%. Similarly, among families at the 90th percentile, there was a 10–percentage point drop in private care use and a 12–percentage point increase in public participation. This apparent crowd-out between private and public care is highlighted in Figure 1, which emphasizes that use of publicly funded center-based care increased for all families except those in the bottom fifth of the income distribution, for whom it dropped.

Proportion of children in publicly funded and private formal center-based care: cubic fit models, 1998 and 2010.
Table 4 shows that the 90/10 gap in formal care participation grew by about 50% over this period. Furthermore, the 50/10 gap in formal care utilization—which was nonexistent in 1998—was 10 percentage points by 2010. In both periods, low-income children were more likely to be enrolled in public center-based care, but that gap narrowed substantially.
Home Technology
Our index of home computer usage increased across the board but particularly among low- and middle-income families, who saw their 1998 composite scores triple and double, respectively. Item-level results for the three underlying computing measures are highlighted in Figure 2 (also in Appendixes E and F). The figures highlight that the likelihood that low-income kindergarteners used a computer three or more times a week almost doubled, from 12% to 22%. Similarly, the likelihood these children used a computer to learn reading or math skills rose from 18% to 44%. Increases were less pronounced among middle-income families, and there are slight drops among families at the 90th percentile. These patterns indicate a substantial narrowing of the “digital divide.”

Proportion of children (a) using a computer three or more times per week, (b) using a computer for learning reading or math skills, (c) using a computer for the Internet: 1998 and 2010.
Yet, gaps with respect to kindergarteners utilizing the Internet actually grew. Note that in 1998, almost no low-income kindergarteners used a home computer to access the Internet (2%). By 2010, this figure rose to 30%. Despite this notable increase in exposure, however, the overall gap in home Internet access grew because among the high-income sample, the likelihood of children accessing the Internet from home rose even more (48 percentage points).
Home Literacy Environment
We measure the home literacy environment based on the number of books in the home and the frequency with which parents reported engaging with children around shared book reading. There were sizable, across-the-board increases for both. Although all income groups report an increase in the number of books from 1998 to 2010, this increase was largest among the high-income families, who reported an average of 26 additional books in the home, as compared with increases of about 11 and 12 for the low- and middle-income families, respectively. It is worth noting, however, that when we examine the natural log of books in the home, to measure percentage rather than percentage point shifts in book ownership, we actually observe the reverse: greater changes among low-income families and, in turn, a narrowing gap.
The composite measure of home literacy practices combines four dichotomous variables, each capturing whether a parent-reported literacy practice (e.g., reading books to child) happened three or more times a week. This composite measure increased across the board over the period examined, with no differences by SES. There were some differences by SES in the underlying items (shown in Appendixes E and F). For instance, low-income parents reported greater increases in the likelihood of reading books to their children, while high-income families reported more frequent storytelling.
Enriching Activities
In addition to home literacy practices, we considered two other measures of parental engagement that aim to capture in-home and out-of-home enrichment activities. Recall that our in-home measure captures the frequency with which parents report doing a variety of activities with their children at home (e.g., singing, crafts, games, science projects). In 2010, parents across the income distribution reported doing these types of in-home activities more frequently, but the increase was most pronounced among low-income children.
The measure of out-of-home enrichment activities includes measures of engaging excursions (e.g., trips to the library or zoo) as well as participation in enriching lessons or clubs (e.g., dance lessons, sports activities). As with the in-home enrichment, here too we observe narrowing gaps, driven in large part by low-income families reporting more frequent enriching excursions (see Figure 3). For instance, the low- versus high-income gap in library trips narrowed by about 12 percentage points (see Appendix F). High-income families reported almost no changes in their out-of-home enrichment activities. Taken together then, the findings suggest meaningful increases in children’s engagement in enriching activities, and the overarching pattern is consistent with narrowing disparities.

Proportion of children visiting (a) a library, (b) a zoo, (c) a museum in the past month: 1998 and 2010.
Parental Beliefs About School Readiness
As hypothesized, parents in 2010 thought that children needed to have more skills to be ready for kindergarten than did parents in 1998, as evidenced by our composite index of six readiness skills (shown in the final row of Table 3). Appendix E, which disaggregates the index into the individual items, shows increases in the likelihood that parents indicated that all six readiness skills were “essential” and that these patterns occurred across the income distribution. In addition, for low-, middle-, and high-income groups, the largest increases were with respect to academic skills, such as counting to 20 or knowing letters. Overall, we observe greater increases in these readiness beliefs among middle- and high-income parents than among the low-income parents, leading to widening gaps in school readiness beliefs.
Discussion
This study compared the early life experiences of kindergartners in 1998 and 2010, with a focus on the kinds of experiences that may affect children’s cognitive and socioemotional development and educational outcomes. The evidence suggests that over this period parents at all income levels increasingly structured their kindergarteners’ lives to be more explicitly focused on engaging learning experiences. As compared with their peers in 1998, kindergarteners in 2010 had more books and greater access to educational games on their computers. Children spent substantially more time interacting with their parents—not only at home (reading books, doing art projects, and playing games) but also through enriching outings. Relatedly, parents believed that more skills were needed to be ready for school, particularly around letter and number recognition.
As average exposure to engaging learning experiences has risen, socioeconomic disparities in many of these experiences have narrowed. For instance, gaps have narrowed in overall access to a home computer, as well as use of computer games to learn reading and math. So has the frequency with which parents interact with their children at home or take them on enriching excursions.
These trends are striking, especially in light of the many demographic shifts that might be expected to work against such a narrowing. For example, over the period that we consider, gaps between low- and high-income families grew with respect to factors such as marital status at birth, use of a non-English language at home, attainment of a 4-year degree, and full-time employment. At the same time, it is important to note that the magnitude of the narrowing observed here is generally dwarfed by the very large income-based gaps observed in nearly every measure considered.
Furthermore, several aspects of children’s early experiences have become increasingly divergent. Most surprising, given the rise in public investment in preschool over this period, we observe growing gaps in formal child care participation. Among lower-income children, there was a shift out of formal child care and into parental care. This shift may have been driven by the economic recession. Unemployment levels rose among low-income parents, and parents who were out of work may have pulled their children out of formal care settings. This may be a case where adverse economic circumstances counteracted the potential benefits of policy investments aimed at improving early childhood opportunities. Yet, it is also possible that the increases that we find in certain parent-child interactions among low-income families (e.g., reading books to children) are driven by increases in parents serving as their children’s sole caregiver in the year before school entry. Further research is needed to better understand the effect of unemployment on parental investments in their children.
One notable finding is that among middle- and high-income families, there is no evidence of a similar shift out of formal care. Rather, middle- and high-income families shifted out of private center-based care and into public settings. The shift away from private care may reflect some states’ recent efforts to universalize access to public preschool programs or to broaden eligibility beyond the most at-risk children. These public investments in preschool may be crowding out participation in private programs. This finding is consistent with recent studies suggesting that public early childhood initiatives crowd out existing programs (Baker, Gruber, & Milligan, 2008; Cascio, 2009). Cascio and Schanzenbach (2013) found that universal preschool programs in Oklahoma and Georgia led to drops in private preschool enrollment among children whose mothers had some college education or more. Similarly, universal preschool in Florida led to a shift from private to public preschool among 4-year-olds (Bassok, Miller, & Galdo, 2016).
The current study provides a detailed analysis of changes in young children’s lives over a period characterized by expanded interest and investments in early childhood. Our study has several notable limitations. First, it relies on parent-reported measures of parental investment. Parental reports of many of the measures examined in the current study may suffer from social desirability bias. To the extent that social norms have changed between 1998 and 2010—and we posit that they have—the changes reported in the current study may partially capture those changing norms rather than true changes in parental engagement. Furthermore, if social norms have changed differentially across the income distribution, then our estimates of changing gaps will likely be biased as well.
A second limitation of the current study is the timing of the second cohort, just at the end of the recession. Information from more recent cohorts would be beneficial, especially because patterns in 2010 may reflect temporary responses to the economic downturn. In particular, formal care participation among low-income families may have bounced back in the years since the recession. Similarly, data on changes in parental practices among even younger children (0–4 years old) would be illuminating, as the current study tracks children after they enter elementary school.
Finally, although our data provide an unusually rich window into the early lives of young children in the United States, they do not provide information on all aspects of early lives hypothesized to change over this period. As an example, the quality of child care that children experience likely affects their school readiness gaps, and public policy aimed at improving such quality increased over the study period. Unfortunately, the current data provide no measures of child care quality. Relatedly, the composite measures that we constructed to capture parental investments were theoretically driven and had Cronbach’s alphas ranging from .58 to .84. Because some of these were lower than is typically recommended, future analyses should revisit whether the underlying items might be better grouped differently.
The study also leaves two questions unanswered: What led to the substantial changes in children’s lives documented here? and What are the implications of these changes for children’s development and for SES gaps in school readiness?
Changes over time, particularly the increases observed in parent-child interactions, may be a response to (a) parents’ heightened awareness of the importance of early childhood as a critical developmental period and/or (b) the sharp increase in academic expectations for kindergarteners. The popular press has increasingly published articles—with titles such as “Tutoring Tots?” or “Kindergarten Cram”—which document the pressure that families feel to give their toddlers and preschool-age children a competitive edge before school entry (Orenstein, 2009; Stenson, 2010). Between 1998 and 2010, there have also been dramatic increases in teachers’ expectations for incoming kindergarteners with respect to academic knowledge (Bassok, Latham, & Rorem, 2016). Corresponding to these changes, in the current study we find across-the-board increases in parents’ beliefs about the skills needed for school readiness.
Notably, however, the heightened expectations for school readiness are pronounced among high-income parents, even though the changes that we observed in parental investments were often more pronounced among low-income families. It may be the case that among higher-income families there are “ceiling effects” in these measures, as parents in the earlier period were already investing quite heavily in their children’s development. It also may be that our measures fail to capture the type of changes that high-income families are making (e.g., enrolling young children in tutoring programs, reading them more advanced books).
In recent years, there has been heightened investments in home visitation programs (Stoltzfus & Lynch, 2009) as well as “public information” campaigns centered on improving children’s home learning environments (Zuckerman, 2009). Further research to isolate the drivers of changes in parental investment will be useful for designing future interventions.
Similarly, documenting the implications of the changes noted in the current study for children’s developmental trajectories and for school-entry SES achievement gaps will be informative. We posit that changes in children’s environments will affect SES achievement gaps under several conditions. If a particular form of parental investment (e.g., reading to a child) is beneficial for children’s school readiness and if disparities between low- and high-income families in the prevalence of this behavior have narrowed over time, then we would anticipate gaps in school readiness to narrow as well.
Notably, even if disparities in parental investments stay fixed (or even broaden), we still might observe a narrowing in school readiness gaps. Across-the-board increases in certain parental investments may lead to a narrowing of achievement gaps if the impact of these changes is more pronounced for low-income children. For example, increasing the number of books in the home may be meaningful for children who currently have very few but negligible for children who exceed some threshold of book ownership.
Overall, the implications of the patterns documented in the current study depend on which factors are most consequential for child development and whether changes in experiences matter equally or differentially at various points in the income distribution. 5 Our results suggest that the answers are likely to be complex. To the extent that gaps in school readiness may be narrowing for the most recent cohort of kindergartners (as found by Bassok & Latham, 2016; Magnuson & Duncan, 2014; Reardon & Portilla, forthcoming), this seems to be occurring in spite of some widening of gaps in at least some of children’s early experiences. Perhaps these early experiences are not very consequential for children’s school readiness, or perhaps the widening on these dimensions is offset by narrowing on other dimensions. There may be other factors that matter but are not included in our analysis (e.g., expansions in child health insurance). The results presented here suggest that there is much still to learn about the sources of gaps in children’s school readiness and the factors that might bring about changes in them.
Footnotes
Appendices
Income Gaps in Early Childhood Experiences With Disaggregated Composite Items: 1998 and 2010

| 90/10 Gap |
50/10 Gap |
90/50 Gap |
|||||||
|---|---|---|---|---|---|---|---|---|---|
| 1998 | 2010 | Change | 1998 | 2010 | Change | 1998 | 2010 | Change | |
| Child care arrangements | |||||||||
| Publicly funded center-based care | −0.448 | −0.274 | 0.175 *** | −0.277 | −0.112 | 0.166 *** | −0.171 | −0.162 | 0.001 |
| Private center-based care | 0.611 | 0.522 | −0.089 *** | 0.276 | 0.206 | −0.070 *** | 0.335 | 0.316 | −0.019 |
| Relative/nonrelative care | −0.041 | −0.078 | −0.037 ** | 0.022 | −0.006 | −0.027 * | −0.063 | −0.072 | −0.010 |
| Parental care | −0.123 | −0.168 | −0.046 ** | −0.023 | −0.088 | −0.065 *** | −0.100 | −0.080 | 0.020 |
| Computer use composite | 0.332 | 0.254 | −0.079 *** | 0.174 | 0.185 | 0.011 | 0.158 | 0.068 | −0.090 *** |
| Use of computer ≥3 times/week | 0.316 | 0.178 | −0.138 *** | 0.177 | 0.118 | −0.059 *** | 0.139 | 0.060 | −0.079 *** |
| Use of computer for learning reading/math skills | 0.599 | 0.306 | −0.293 *** | 0.301 | 0.243 | −0.058 ** | 0.298 | 0.063 | −0.235 *** |
| Use of computer for the internet | 0.082 | 0.277 | 0.195 *** | 0.046 | 0.196 | 0.150 *** | 0.036 | 0.080 | 0.045 * |
| Number of books that child own at FK | 62.853 | 78.332 | 15.480 *** | 32.758 | 34.274 | 1.516 | 30.095 | 44.058 | 13.963 ** |
| Log(number of books that child own at FK) | 1.208 | 1.087 | −0.121 * | 0.750 | 0.628 | −0.122 * | 0.459 | 0.459 | 0.000 |
| Literacy activities in the home | 0.154 | 0.158 | 0.004 | 0.091 | 0.099 | 0.009 | 0.063 | 0.059 | −0.005 |
| Frequency that child reads to others | 0.051 | 0.089 | 0.038 * | 0.028 | 0.044 | 0.016 | 0.023 | 0.045 | 0.022 |
| Frequency that child looks at picture books | 0.181 | 0.173 | −0.009 | 0.118 | 0.109 | −0.009 | 0.064 | 0.064 | 0.000 |
| Reading books to child | 0.268 | 0.185 | −0.082 *** | 0.163 | 0.118 | −0.045 * | 0.105 | 0.067 | −0.037 ** |
| Telling stories to child | 0.118 | 0.185 | 0.067 *** | 0.054 | 0.129 | 0.074 *** | 0.064 | 0.057 | −0.007 |
| Learning activities in the home | 0.086 | 0.054 | −0.031 ** | 0.045 | 0.033 | −0.012 | 0.040 | 0.021 | −0.019 † |
| Singing songs with child | 0.051 | 0.012 | −0.040 † | 0.031 | 0.020 | −0.011 | 0.021 | −0.008 | −0.029 |
| Helping child do arts/crafts | 0.120 | 0.053 | −0.067 ** | 0.063 | 0.019 | −0.045 * | 0.056 | 0.034 | −0.022 |
| Involving child in household chores | 0.081 | 0.060 | −0.021 | 0.077 | 0.043 | −0.034 * | 0.004 | 0.017 | 0.013 |
| Playing games/doing puzzles with child | 0.124 | 0.092 | −0.032 † | 0.058 | 0.047 | −0.011 | 0.066 | 0.044 | −0.022 |
| Talking about nature/doing science projects | 0.122 | 0.053 | −0.070 *** | 0.053 | 0.027 | −0.026 | 0.070 | 0.026 | −0.044 * |
| Building something with child | 0.030 | 0.055 | 0.025 | 0.013 | 0.039 | 0.026 | 0.018 | 0.016 | −0.001 |
| Playing a sport or exercise together | 0.072 | 0.057 | −0.015 | 0.022 | 0.040 | 0.018 | 0.050 | 0.016 | −0.033 † |
| Out-of-home activities | 0.165 | 0.141 | −0.024 ** | 0.065 | 0.052 | −0.013 † | 0.100 | 0.089 | −0.011 |
| A library | 0.219 | 0.098 | −0.121 *** | 0.126 | 0.046 | −0.080 *** | 0.094 | 0.052 | −0.041 † |
| A concert | 0.187 | 0.176 | −0.011 | 0.085 | 0.074 | −0.011 | 0.102 | 0.102 | 0.000 |
| A zoo | 0.093 | 0.030 | −0.063 * | 0.014 | −0.015 | −0.029 | 0.079 | 0.045 | −0.034 |
| A museum | 0.203 | 0.154 | −0.049 * | 0.062 | 0.047 | −0.015 | 0.140 | 0.106 | −0.034 |
| Dance lessons | 0.229 | 0.228 | −0.001 | 0.073 | 0.080 | 0.007 | 0.156 | 0.148 | −0.007 |
| Organized athletic activities | 0.514 | 0.493 | −0.021 | 0.245 | 0.220 | −0.026 | 0.269 | 0.273 | 0.004 |
| Organized clubs, like scouts | 0.120 | 0.126 | 0.006 | 0.058 | 0.070 | 0.012 | 0.063 | 0.056 | −0.007 |
| Music/singing lessons | 0.095 | 0.120 | 0.025 † | 0.013 | 0.024 | 0.012 | 0.082 | 0.095 | 0.013 |
| Drama lessons | 0.021 | 0.020 | −0.001 | 0.001 | −0.001 | −0.001 | 0.020 | 0.020 | 0.000 |
| Art classes/lessons | 0.082 | 0.066 | −0.017 | 0.007 | −0.008 | −0.014 | 0.076 | 0.073 | −0.002 |
| Crafts classes/lessons | 0.115 | 0.078 | −0.038 * | 0.041 | 0.018 | −0.023 * | 0.074 | 0.060 | −0.015 |
| Organized performing arts | 0.098 | 0.107 | 0.009 | 0.044 | 0.045 | 0.000 | 0.054 | 0.062 | 0.008 |
| Parental beliefs about skills for kindergarten | 0.088 | 0.117 | 0.029 * | 0.074 | 0.093 | 0.019 † | 0.014 | 0.024 | 0.010 |
| Counting to 20 | 0.033 | 0.054 | 0.021 | 0.028 | 0.046 | 0.018 | 0.005 | 0.008 | 0.003 |
| Sharing with others | 0.183 | 0.194 | 0.011 | 0.136 | 0.152 | 0.016 | 0.047 | 0.042 | −0.005 |
| Sitting still/paying attention | 0.039 | 0.041 | 0.002 | 0.050 | 0.065 | 0.015 | −0.010 | −0.024 | −0.013 |
| Knowing letters | 0.019 | 0.086 | 0.066 *** | 0.031 | 0.061 | 0.030 * | −0.011 | 0.025 | 0.036 * |
| Communicating verbally | 0.163 | 0.195 | 0.032 † | 0.123 | 0.134 | 0.012 | 0.041 | 0.061 | 0.020 |
| Holding/using a pencil | 0.092 | 0.134 | 0.043 ** | 0.076 | 0.101 | 0.024 * | 0.015 | 0.034 | 0.018 |
Note. Sample sizes, which were rounded to the nearest to 10 due to the reporting rules of the National Center for Education Statistics, were 18,940 and 14,850 in the analytic samples of ECLS-K:98 and ECLS-K10, respectively. The estimates of ECLS-K:98 were adjusted with the 1999 spring kindergarten child weight, and the estimates of ECLS-K10 were adjusted with the 2010 FK child weight.ECLS-K:98 = Early Childhood Longitudinal Study–Kindergarten Class of 1998–1999; ECLS-K:10 = Early Childhood Longitudinal Study–Kindergarten Class of 2010–2011; FK = fall kindergarten.
p < .10. *p < .05. **p < .01. ***p < .001.
Funding
We are grateful for funding support from the National Institute of Child Health and Human Development and the Russell Sage Foundation. Daphna Bassok appreciates generous support through a National Academy of Education/Spencer Postdoctoral Fellowship.
Notes
Authors
DAPHNA BASSOK is an assistant professor of education and public policy at the University of Virginia, PO Box 400879, Charlottesville, VA 22904;
JENNA E. FINCH is a doctoral student in the Developmental and Psychological Studies Program at Stanford Graduate School of Education, 520 Galvez Mall, #406 Stanford, CA 94305-3084;
RAEHYUCK LEE is an assistant professor at the College of Hyang-seol Nanum, Soonchunhyang University, 22, Soonchunhyang-ro, Sinchang-myeon, Asan-si, Chungcheongnam-do, 31538 South Korea;
SEAN F. REARDON is the Endowed Professor of Poverty and Inequality in Education at the Stanford Graduate School of Education, 520 Galvez Mall, #526, Stanford, CA 94305-3084;
JANE WALDFOGEL is Compton Foundation Centennial Professor for the Prevention of Children and Youth Problems at Columbia University School of Social Work, 1255 Amsterdam Avenue, New York, NY 10027;