
Abstract
Numerous studies show large differences between economically advantaged and disadvantaged parents in the quality and quantity of their engagement in young children’s development. This “parenting gap” may account for a substantial portion of the gap in children’s early cognitive skills. However, researchers know little about whether the socioeconomic gap in parenting has increased over time. The present study investigates this question, focusing on income- and education-based gaps in parents’ engagement in cognitively stimulating activities with preschool-aged children. We draw on data from four national studies conducted over 25 years. We found a decrease in income-based gaps in children’s book ownership and library attendance but increasing income-based gaps for several other parent behaviors, including reading and telling stories to children and teaching children letters, words, and numbers. Income-based gaps in children’s participation in out-of-home cultural activities also increased. Results for education-based gaps were similar. These gaps largely arose from top-income families pulling away from their middle- and low-income counterparts.
E
New evidence casts doubt on the idea that rising gaps in children’s skills and attainments can be attributed to rising income gaps alone, however (Duncan, Kalil, & Ziol-Guest, 2013). In fact, Reardon (2011a) estimates that only about half of the rising income gap in test scores can be attributed to rising income inequality. Parents invest more than money in their children’s development. Through their time and attention, parents can provide a cognitively stimulating and emotionally supportive home environment that promotes children’s early learning and behavioral adjustment. Economically advantaged parents differ from their less advantaged peers on many relevant dimensions of parenting (Bradley, Corwyn, McAdoo, & Garcia Coll, 2001; Guryan, Hurst, & Kearney, 2008; Kalil, Ryan, & Corey, 2012; Waldfogel & Washbrook, 2011). Less well understood is how these “parenting gaps” may have changed over time. The present article provides new evidence on this important question.
Background
The Changing Context of Parenting: 1988–2012
A number of demographic changes have occurred over the past three decades that could shape whether and how class-based gaps in parenting have changed over time. The demography of family structure, for instance, has changed in ways that favor the socioeconomically advantaged and their ability to invest parental time and resources into their children’s development. Between 1980 and 2010, the share of children living with college-educated mothers who were married remained at about 90%. In contrast, the share of children living with mothers who lacked a high school degree who were married decreased from about 73% to about 66% (Stykes & Williams, 2013). Two-biological-parent households not only enjoy greater economic well-being but also demonstrate higher levels of parental time investment in children than do single-parent households (Kalil, Ryan, & Chor, 2014). The increasingly strong correlation between socioeconomic advantage and the married-parent family structure would lead us to predict an increase in the socioeconomic status (SES)–based parenting gap.
Trends in maternal age at first birth have also changed in important ways that may favor the parenting environments provided by highly educated mothers. Comparing data on U.S. births in 1970, 1989, and 2006 by age of mother and maternal schooling reveals that the maternal age gap between children born to high school dropout and college graduate mothers grew by nearly 3 years—from 4.3 years to 7.1 years (Duncan, Lee, Rosales-Rueda, Kalil, & Ziol-Guest, 2014). Positive parenting behaviors increase in maternal age at first birth, whereas negative parenting behaviors decrease in maternal age at first birth (Conger & Conger, 2000). The increasingly strong correlation between socioeconomic advantage and maternal age provides another reason to expect a growing SES-based gap in parenting behaviors.
Finally, how parents think about parenting has changed dramatically over the past century. In 1900, parenting experts emphasized nutrition, medical care, and fresh air as the key inputs into child development, according to a comprehensive analysis of magazine articles containing parenting advice. By the 1980s, intellectual stimulation and social/emotional development had replaced nutrition and fresh air as key topics of concern along with medical care (Wrigley, 1989). However, economically advantaged parents, more so than their disadvantaged counterparts, may have responded more quickly to this advice, thus widening the parenting gap. For example, Schaub (2010) showed that mothers’ education became a stronger predictor of parenting for cognitive development over the second half of the 20th century. Other evidence showing that economically disadvantaged parents respond differently to parenting information is provided by Aizer and Stroud (2010), who showed that less educated mothers were much slower than their advantaged peers to curb their smoking following the release of the Surgeon General’s report of 1960 outlining the health hazards of prenatal smoking. All told, the demographic and social changes of the past 25 years lead us to predict a widening of the SES-based parenting gap. We turn next to the empirical evidence on this gap and how it has changed over time.
SES-Based Gaps in Parenting
Economically advantaged parents display more of the behaviors deemed supportive of children’s development across a range of parenting domains. They display more authoritative (vs. authoritarian) parenting styles (Pinderhughes, Dodge, Bates, Pettit, & Zelli, 2000), engage in more sensitive and responsive mother-child interactions (NICHD Early Child Care Research Network, 2004), use greater language stimulation (Hart & Risley 1995; Phillips, 2011), and use greater levels of parental management and advocacy (Lareau, 2003). A famous example of differential parenting by SES is the study by Betty Hart and Todd Risley (1995), who intensively observed the language patterns of 42 families with young children. They found that in professional families, children heard an average of 2,153 words per hour, while children in working-class families heard an average of 1,251 words per hour and children in welfare-recipient families, an average of 616 words per hour. By age 4, a child from a welfare-recipient family could have heard 32 million fewer words than a classmate from a professional family.
One of the most important parenting differences between advantaged and disadvantaged parents is how much time the parent spends with the child. Annette Lareau’s (2003) qualitative study of family life reported that middle-class parents target their time with children toward developmentally enhancing activities. In her study, middle-class families (whose jobs, by her definition, require college-level skills) engage in a pattern of “concerted cultivation” to actively develop children’s talents and skills. By contrast, in lower-class families, Lareau identified a pattern that she calls “the accomplishment of natural growth,” wherein parents attend to children’s material and emotional needs but presume that their talents and skills will develop without concerted parental intervention.
Numerous quantitative studies show not only large differences in the time investments of advantaged and disadvantaged parents but that these gaps remain large even when other differences across families, such as employment hours and schedules, are accounted for (Guryan et al., 2008; Hill & Stafford 1974; Sayer, Gauthier, & Furstenberg, 2004). Kalil et al. (2012) further show that highly educated mothers are more “efficient” in their parental time investments by tailoring their specific activities to children’s developmental stage. Kalil et al. also show that with respect to total child care time, the educational gradient is most apparent in households with the youngest children, a point also made by Hurst (2010) and Sacks and Stevenson (2010). Economically advantaged mothers, more so than their less advantaged counterparts, may have learned the message that parental investments in early childhood are key ingredients in children’s long-run success (Carneiro & Heckman, 2003).
Changes Over Time in the Parenting Gap
There is evidence that high-income parents are investing more parenting time than ever before in their children’s cognitive development and educational success (Ramey & Ramey, 2010). This increase may mean that high-skilled parents are responding to the increased returns to having high-skilled (i.e., highly educated) children (Cunha & Heckman, 2008). Hurst (2010) and Sacks and Stevenson (2010) further show that all of the increase in child care time between 1985 and 2003 has come from households with children aged 5 years and younger, and Altintas (2012) shows that the growing education gap in time with young children is driven by time in educationally enriching activities.
Increases in the parenting gap are expected to be relevant for SES-based gaps in children’s development. Observational research suggests that the quality of the home learning environment, as measured by the Home Observation for Measurement of the Environment (HOME) score, accounts for up to half of the relationship between SES and disparities in children’s cognitive test scores (Klebanov, Brooks-Gunn, McCarton, & McCormick, 1998; Smith, Brooks-Gunn, & Klebanov, 1997). In a descriptive analysis of U.S. data from the Early Childhood Longitudinal Study–Birth Cohort (ECLS-B), Waldfogel and Washbrook (2011) conclude that parenting style (in particular, mothers’ sensitivity and responsiveness, as well as the home learning environment) is the most important factor explaining the poorer cognitive performance of low-income children relative to middle-income children, accounting for a quarter to a third percentage of the gaps in literacy, mathematics, and language.
In sum, numerous studies show large differences between economically advantaged and disadvantaged parents in the quality and quantity of their cognitive stimulation in support of young children’s development. However, researchers know little about whether the socioeconomic gap in parenting behavior has increased over time. The present study investigates this question.
Method
Data and Samples
Data are drawn from four nationally representative studies conducted over a 25-year period: National Longitudinal Survey of Youth 1979–Maternal and Child Supplement (NLSY-CS), Panel Study of Income Dynamics–Child Development Supplement I (PSID-CDS), National Household Education Surveys Program (NHES), and ECLS-B.
The NLSY79 consists of three independent probability samples designed to represent the entire population of youth aged 14 to 21 years residing in the United States as of January 1, 1979. These 12,686 youth (50% male and 50% female) were first interviewed in 1979 and reinterviewed annually until 1994 and biennially since. Beginning in 1986, the NLSY79 began collecting information biennially on the biological children of the female NLSY respondents to assess children’s health, development, and overall well-being. The children of these female respondents are estimated to represent >95% of all the children ever to be born to this cohort of women.
The PSID is a household panel study that began in 1968 and was drawn from two independent samples that, when combined, constitute a national probability of U.S. families as of 1968. PSID sample members include all persons living in the family in 1968, plus anyone born to or adopted by a sample member. Sample members are followed when they leave the household, and those who marry into the PSID household are added. Data were collected annually until 1997 and biennially since that year. In 1997, the PSID supplemented its main data with additional information on 0- to 12-year-old children and their parents (PSID-CDS), completing interviews with 88% of PSID families that had children in the household.
The NHES is a repeated, cross-sectional, nationally representative survey of all households in the United States. The survey, designed to gather data on the educational activities of the U.S. population, was initiated in 1991 and has been conducted roughly biennially since that year. We use data drawn from the Early Childhood Education and School Readiness surveys, which sample households with young children: 0–6 and 3–6 years old, respectively.
The ECLS-B is a nationally representative longitudinal birth cohort study of approximately 14,000 children born in the United States in 2001. The ECLS-B oversampled Chinese children, other Asian and Pacific Islander children, American Indian and Alaska Native children, twins, and children born with low and very low birth weight to ensure a diverse sample. The present analyses use data from the third wave, in 2005–2006, when children were 4 years old.
Within each study, analytic samples were limited to families with preschool-aged children (3–5 years old) in the target survey years. As the oldest survey, the NLSY-CS provided the earliest data point. Although the NLSY-CS began in 1986, the analytic sample constitutes mothers of children who were 3 to 5-year-olds in 1990 (or in 1988 if data were not available for a mother in 1990 but were in 1988; n = 2,457). These survey years were chosen over 1986 to reduce the overrepresentation of teenage mothers in the NLSY-CS sample. The first wave of the PSID-CDS was gathered nearly a decade later in 1997, and our analytic sample from that study constitutes all mothers of children aged 3 to 5 years (n = 648). The NHES gathered data on parenting behaviors in 1991, 1993, 1996, 1999, 2001, 2005, 2007, and 2012. 1 Analytic samples of preschool-aged children in those years range in size from 2,525 in 2007 to 6,591 in 1991. The ECLS-B gathered data on children at age 4 in 2005–2006 (n = 8,850). 2 Thus, collectively, these studies span a 25-year period. These analytic samples are limited to families with valid data on household income (and families with maternal education data in education models).
To the extent that income or education distributions changed across cohorts, changes mirror national income and education trends (see Table 1). This consistency is not surprising, given that the NHES cohorts and the ECLS-B are nationally representative of families with 3- to 5-year-olds. For example, 18% of mothers had a college degree in the 1991 NHES, 27% in the 1999, and 36% in the 2007; according to census data, 21%, 23%, and 28% of women between the ages of 18 and 44 had a college degree in those years, respectively. 3 The one exception to this consistency is the 1988/1990 NLSY-CS, in which mothers have lower education levels than in any other study, including the 1991 NHES. Thus, although the 1988/1990 NLSY-CS data were used to minimize overrepresentation of younger and more disadvantaged mothers in the NLSY-CS, the 1988/1990 sample of mothers of preschool-aged children is still relatively disadvantaged. The implications of the NLSY-CS sample composition for our results is addressed in the sensitivity tests described below.
Sample Characteristics Across Surveys and Cohorts
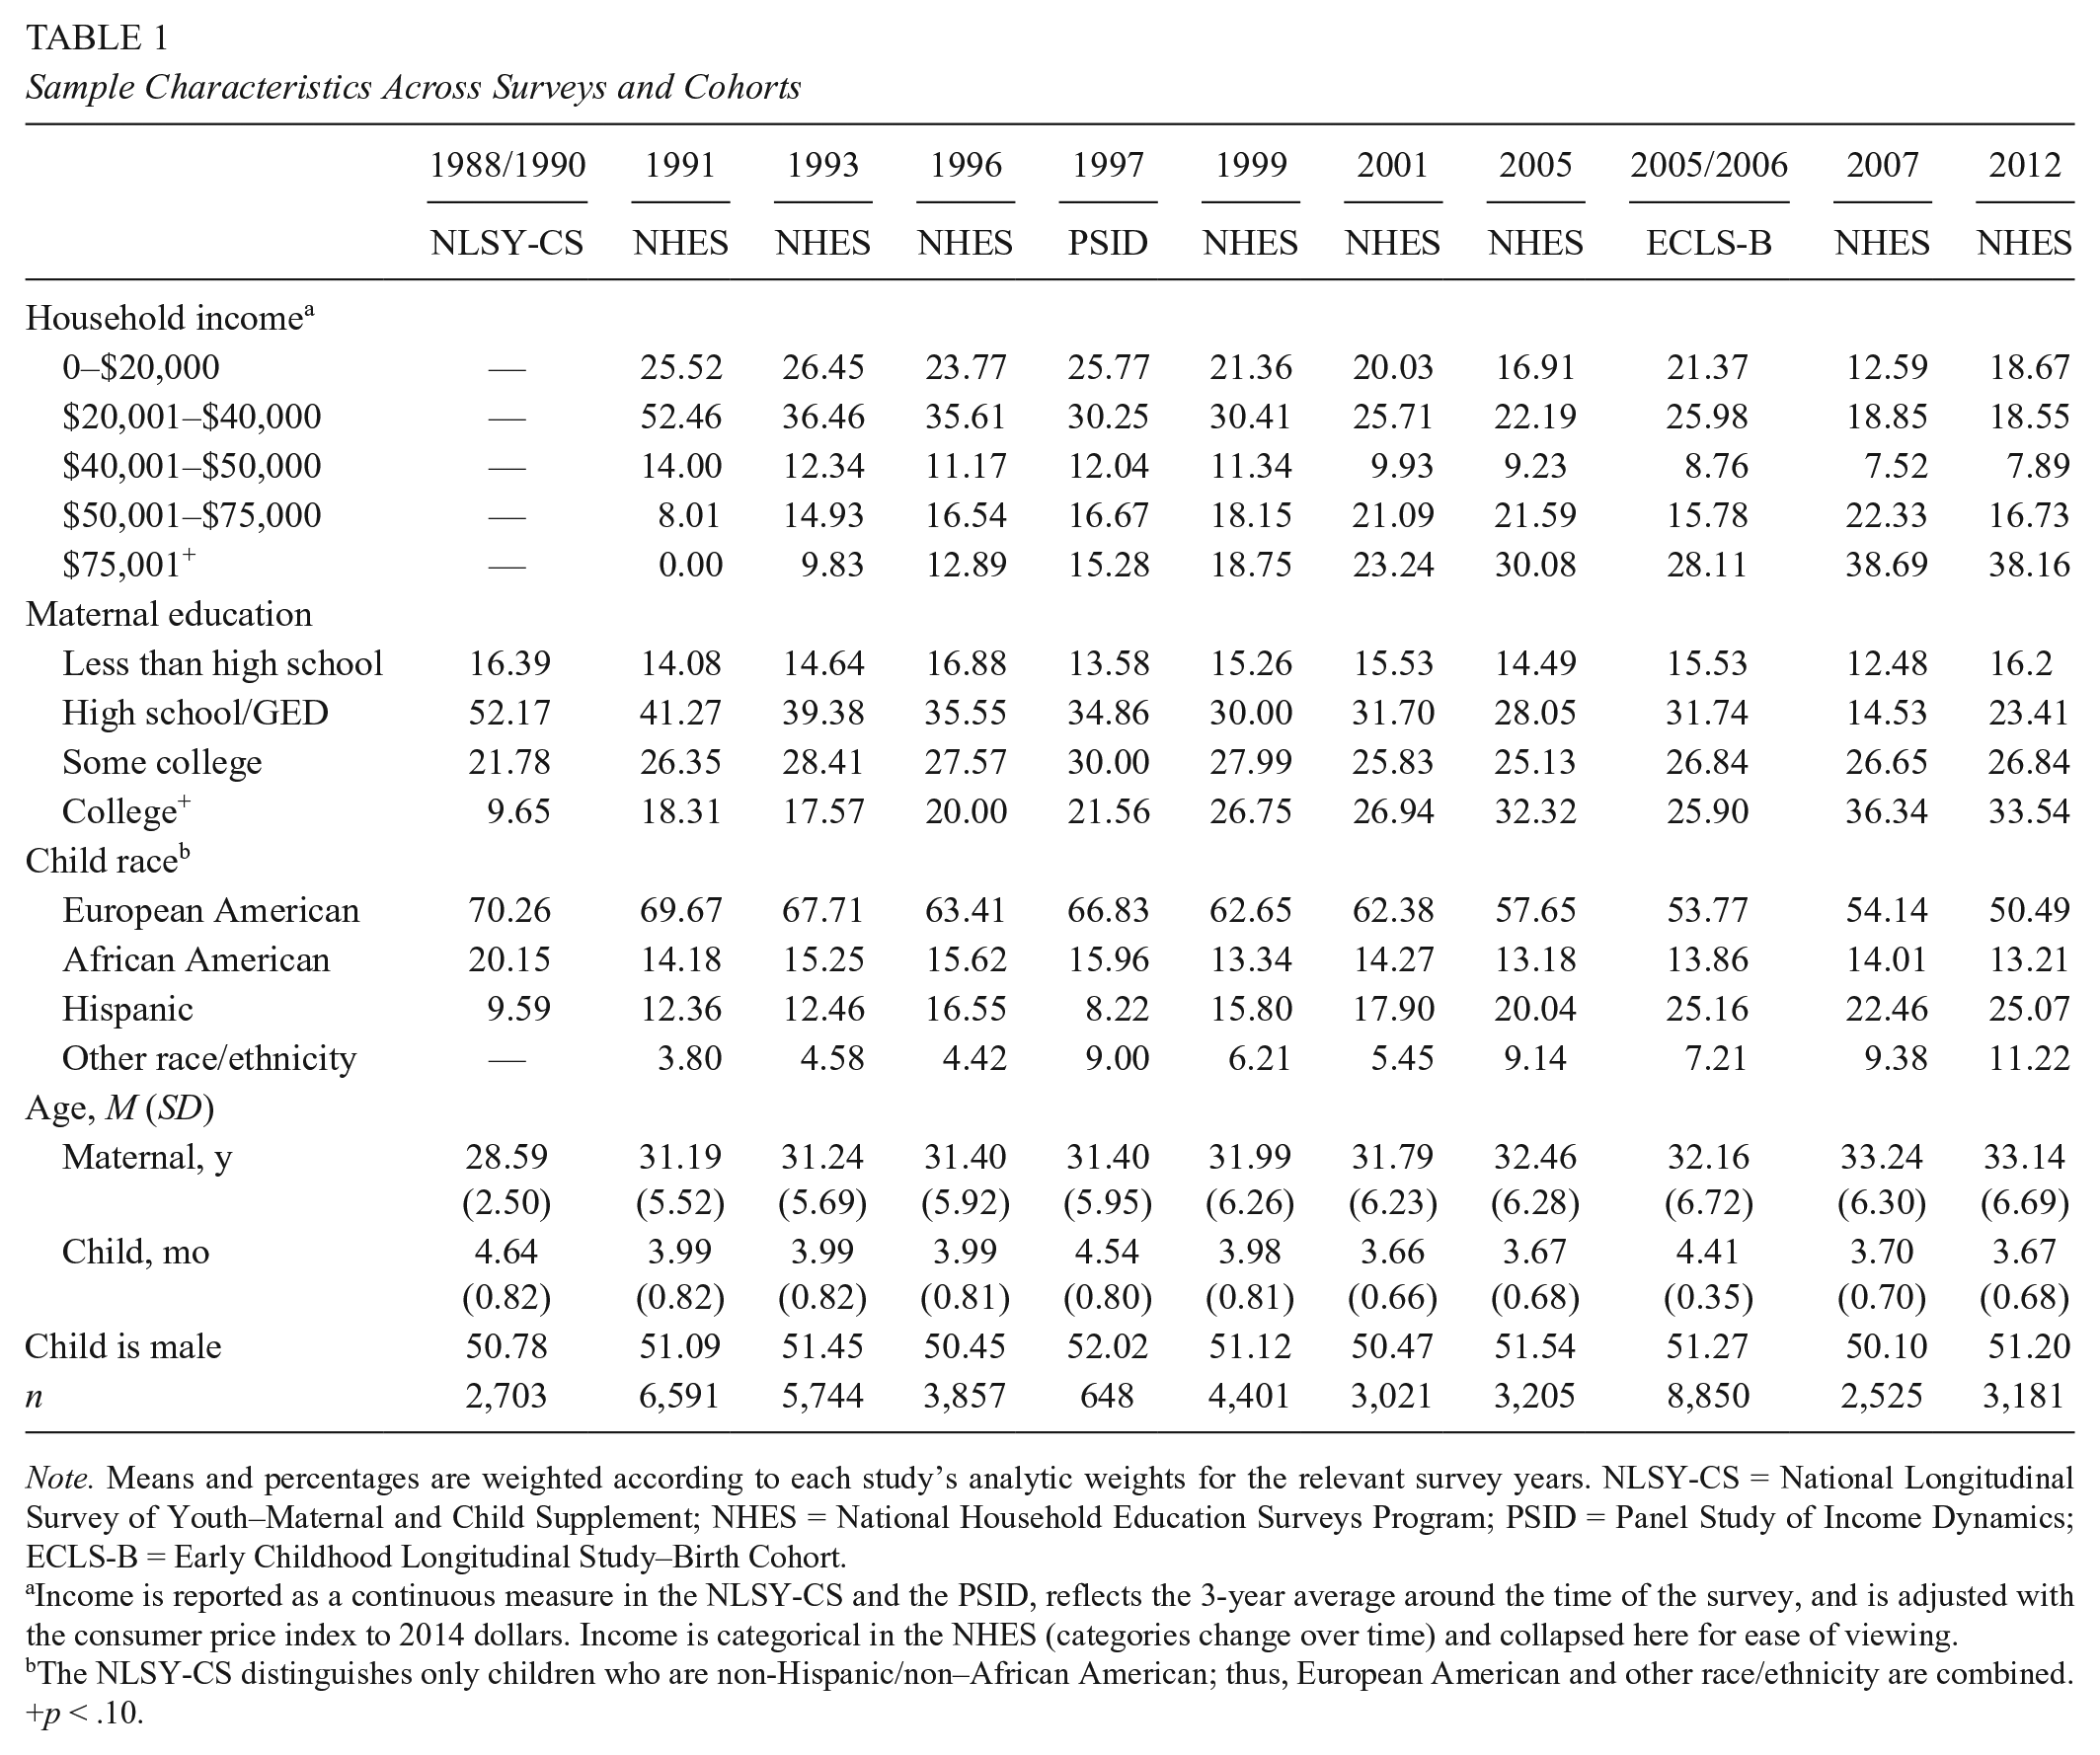
Note. Means and percentages are weighted according to each study’s analytic weights for the relevant survey years. NLSY-CS = National Longitudinal Survey of Youth–Maternal and Child Supplement; NHES = National Household Education Surveys Program; PSID = Panel Study of Income Dynamics; ECLS-B = Early Childhood Longitudinal Study–Birth Cohort.
Income is reported as a continuous measure in the NLSY-CS and the PSID, reflects the 3-year average around the time of the survey, and is adjusted with the consumer price index to 2014 dollars. Income is categorical in the NHES (categories change over time) and collapsed here for ease of viewing.
The NLSY-CS distinguishes only children who are non-Hispanic/non–African American; thus, European American and other race/ethnicity are combined.
p < .10.
Measures
Each survey collected data on household income and maternal education, as well as information on parents’ engagement in cognitively stimulating activities with their preschool-aged children. The specific measures across data sets are detailed below.
Household income and maternal education
The NLSY and PSID collected measures of continuous total annual household income for the year prior to the survey year, whereas the NHES and ECLS-B collected these data through a categorical measure. Specifically, the NLSY collected information about income from a variety of sources, including transfers from governmental and nongovernmental sources. The PSID created a high-quality edited measure of annual total family income, which includes taxable income and cash transfers to all household members. The NHES and ECLS-B asked parents where their yearly household income fell within specific income ranges. The exact number and ranges of income categories change across survey years in the NHES. For example, in 1991, the lowest income category was ≤$5,000 and the highest ≥$75,000 with 11 overall categories, whereas in 2007 the lowest was ≤$5,000 and the highest ≥$100,000 with 14 categories. The ECLS-B contained 13 income categories, with a top range ≥$200,001.
Our measure of parental education in all four data sources come from mothers’ reports of their total years of education and degrees attained from the year in which the parenting data were drawn. The maximum years of education in the PSID was 17, which represented all education beyond college. The maximum years of education in the NLSY was 20.
Parenting behavior
The NLSY-CS and PSID used identical measures of parenting behavior drawn from the short form of the HOME, which was created for use in the NLSY-CS, and the PSID-CDS used it specifically to align its parenting measures with the NLSY (Baker & Mott, 1989; Caldwell & Bradley, 1984). Five of the preschool-aged children parent-report items about the frequency of cognitively stimulating parenting behaviors and the presence of certain materials were asked in an analogous way in multiple studies. Two items were asked across the full 25-year period, and another 3 items were asked in the earliest and latest years of the NHES, along with multiple intervening years, thus covering 22 years. We also examined 3 items about enrichment activities that were asked over 20- or 16-year periods in the NHES.
Although it has a checklist format and parent-report items, the HOME is strongly correlated with observational parenting ratings based on semistructured parent-child interactions and is highly predictive of observer-rated cognitive outcomes (Zaslow et al., 2006). Moreover, the short form of the HOME has relatively high internal consistency and test-retest reliability, particularly for the cognitive stimulation items (Mott, 2004). Although we examine individual items, rather than full scales, these studies suggest that the items we use from the Cognitive Stimulation subscale provide reasonably valid and reliable data on parent behavior. The items and their summary descriptive statistics are listed in Table 2 and described below.
Proportion of Endorsement for Parenting Items Across Surveys and Cohorts

Note. NLSY-CS = National Longitudinal Survey of Youth–Maternal and Child Supplement; NHES = National Household Education Surveys Program; PSID = Panel Study of Income Dynamics; ECLS-B = Early Childhood Longitudinal Study–Birth Cohort.
In-home activities
Four of the eight items ask parents about activities that they do or materials that they have in the home. All items were coded “1” if the parent endorsed the activity or material. In the NHES and ECLS-B only, parents were asked not only if they taught their children letters, words, or numbers in the past week but how often (frequency was not asked in the NLSY or PSID). The activity was coded “1” if the parent taught letters, words, or numbers at least three times per week. Parents were asked in the NLSY, PSID, 1991/1993/2007 NHES, and the ECLS-B the number of books that the child has, which was recoded to “1” if the child has ≥10. Parents in all studies and years were asked how often they read to their children: In the NLSY, PSID, 1996–2005/2007 NHES, and the ECLS-B, reading “daily” is a valid response; however, in the 1991/1993 NHES, the most frequent possible response was three times a week. Thus, an indicator for “reads daily” was created for all years but 1991 and 1993. The NHES (all years) and ECLS-B asked parents how often they told the child a story in the last week, with three times as the most frequent response in all years but 2007.
Out-of-home activities
The four remaining items across surveys capture cognitively stimulating activities that parents do with children out of the home. Again, all items were coded “1” if the parent endorsed the activity. The NLSY, PSID, 1991-1999/2007 NHES and the ECLS-B asked parents how often they had taken the child to a museum and responses were recoded to equal “1” if they had done so in the past month/at least once a month. The NHES in 1991-1999 and 2007 also asked parents if they had taken their child to the zoo or aquarium in the past month as well as if they had taken their child to a concert or play in the past month. Finally, in all years of the NHES and the ECLS-B parents reported if they had taken their child to a library in the past month.
Analytic Strategy
Data harmonization
The central analytic challenge of this study is to generate comparable measures of parenting behavior, income, and maternal education across surveys in which they were measured somewhat differently and across cohorts in which distributions changed at the national level. Harmonizing the data is essential if we are to estimate and compare analogous income- and education-based parenting gaps over time. We harmonized measures of parenting behavior by recoding responses to analogous questions across surveys as similarly as possible (see above).
To identify the income-based gaps in parental activities, we estimate the 90/10 gap (we also estimate the 90/50 and 50/10 gaps). This gap represents the difference in the average parental activity score of children at the 90th percentile and children at the 10th percentile of family income. To do so, we needed to create income and maternal education measures that are comparable across data sets that were conducted in different years and collected information differently.
In the case of income, ideally we would have a continuous measure from which to identify the 90th and 10th percentiles of the distribution and calculate the 90/10 gap. However, as noted above, we have only a continuous measure of income for the NLSY and PSID. Because income is measured categorically in the NHES and the ECLS-B, in nine to 14 ordered income categories, we cannot identify children’s exact income or their exact percentile in the income distribution as we can in the NLSY and PSID. We follow the technique presented in Reardon (2011b) for ascertaining an estimate of the percentile, by first converting the continuous income data in the NLSY and PSID into uniform, ordinal categories: 10 in the NLSY and seven in the PSID. We imposed fewer categories on these data sets than the NHES because of their relatively smaller sample sizes. Reardon finds that estimated gaps in outcomes do not vary systematically with the number of categories used, suggesting that this difference across data sets should not influence our findings.
Second, with income measured categorically in each data set, we next estimate the average endorsement of each parental activity in each income category. To do so, we run a weighted least squares regression of the parenting item in each data set, using the appropriate sample weights for the study and survey year, separately for each income category. 4 The constant from this model yields an estimate of the probability of endorsing each parenting behavior within each income category for each study and survey year, as well as a standard error of each estimate, all adjusted by the appropriate sample weight.
Third, because we are not observing actual income (θ), which is distributed according to a cumulative density function, but rather ordinal measures of income (number of categories represented as K), we need to generate percentiles of the distribution. Let cK be the proportion of the population with values of θ in category K or below (and where c0 = 0, cK = 1). Furthermore, we determine the average value of the latent trait of income in the population by subtracting cK-1 (the proportion of the population in each category below cK) from cK and dividing by 2. This variable, θ
K
, is calculated for each income category in each study and survey year. The average value of each predicted parenting proportion for each income category,

This model is weighted by the inverse of the sampling variance of
An identical process was used to harmonize the maternal education data across cohorts and data sets. Data on years of education and degrees earned in the NLSY and PSID were converted into ordinal categories: seven for the NLSY and six for the PSID. The NHES provided a nine- (1991 and 1993), 11- (2012), or 13-category (1996–2007) ordinal variable at each wave, with categories ranging from less than 8th grade through doctoral degree. The ECLS-B provided a nine-category ordinal variable ranging from less than eighth grade through doctoral or professional degree. The strategy for estimating the relationship between education and parenting behavior was then identical to the strategy for estimating the income-parenting relationship.
Finally, the coefficients generated in the regression described above were used to calculate income- and education-based gaps in parenting behavior at different points in each distribution for each study and survey year. We began by calculating the 90/10 income-parenting gap as follows:


The same process was applied to calculating the 90/50 and 50/10 income-parenting and education-parenting gaps. We repeated this process for each parenting item separately in each study and survey year.
Estimating changes in gaps over time
Estimating and plotting the income-parenting and education-parenting gaps generated via the procedure above begins to answer the question of whether parenting gaps are changing over time. However, we formally tested the hypothesis that gaps are changing across cohorts in two ways. First, we conducted a t test of the significant difference between gaps at any two data points, using the standard errors of the estimated gaps, with the first and last available time points being the preferred comparisons and others conducted as needed. The aim here was to determine if the gap increased or decreased over the entire period.
Second, to assess the overall trend in gaps over time, we regressed the 90/10, 90/50, and 50/10 income-parenting and education-parenting gap estimates on a linear year variable controlling for the number of income categories in each study and survey year to adjust for the fact that surveys had different numbers of income categories. These regressions were weighted by the inverse of the standard error for each estimated gap. Note, the n values for these regression models range from 5 to 9 depending on the number of studies and survey years for which a particular parenting item was available.
Sensitivity tests
Despite our efforts to harmonize our data over time, one concern is that racial and ethnic differences across surveys may alter income-based gaps in parenting in ways not attributable to the changing relationship between income and parenting alone. This may be particularly true of the NLSY-CS, which in 1988 and 1990 overrepresents African American mothers relative to national norms. To address this concern, we run all analyses separately excluding the NLSY-CS. Additional concerns are that (a) the 2005–2006 ECLS-B interviewed parents of 4-year-olds only, rather than the full range of preschool-aged children as in the other studies, and (b) the mean ages varied somewhat across studies. To assess this inconsistency, we also reran the regression models estimating time trends controlling for the average child age in each study and survey year.
Results
Figures 1 and 2 display the estimated gaps in parenting behaviors between the 90th and 10th percentiles (the 90/10 gaps) of the income distribution within each available study and survey year. These figures can be used to visually assess how the 90/10 parenting gaps have changed over time. Figure 1 displays the 90/10 gaps for in-home parenting behaviors, and Figure 2 displays the same gaps for out-of-home parenting behaviors. Figures 3 through 6 display the 90/10, 90/50, and 50/10 gaps for each in-home parenting behavior separately over time. These figures can be used to visually assess whether changes in the 90/10 gaps over time arise predominantly from the top income group (the 90th percentile) and pull away from the middle (the 50th percentile) and bottom (the 10th percentile) or whether the bottom pulls away from (or catches up with) the middle and top. Table 3 presents results of the t tests and regression models testing whether the apparent changes displayed in the figures are statistically significant. Table 4 presents corresponding results for the education gaps over time.

Gaps over time between the 90th and 10th percentiles for income: In-home parenting behaviors.

Gaps over time between the 90th and 10th percentiles for income: Out-of-home parenting behaviors.

Gaps over time between the 90th and 50th, 50th and 10th, and 90th and 10th percentiles for income: Daily book reading.
Change in Income-Based Gaps in Parent Activities With Their Children From 1988 to 2012

Note. NLSY-CS = National Longitudinal Survey of Youth–Maternal and Child Supplement; NHES = National Household Education Surveys Program.
Frequency of teaching letters, words, and numbers three times a week, telling stories three times a week, and library visits were not asked in the NLSY-CS, so the first observation is in 1991.
Frequency of zoo and concert/play attendance was not asked in the 2012 NHES or in the NLSY-CS, so the first observation is in 1991 and the last in 2007.
Frequency of museum attendance was not asked in the 2012 NHES, so the last observation is in 2007.
p < .10. *p < .05.
Change in Education-Based Gaps in Parent Activities With Their Children From 1988 to 2012
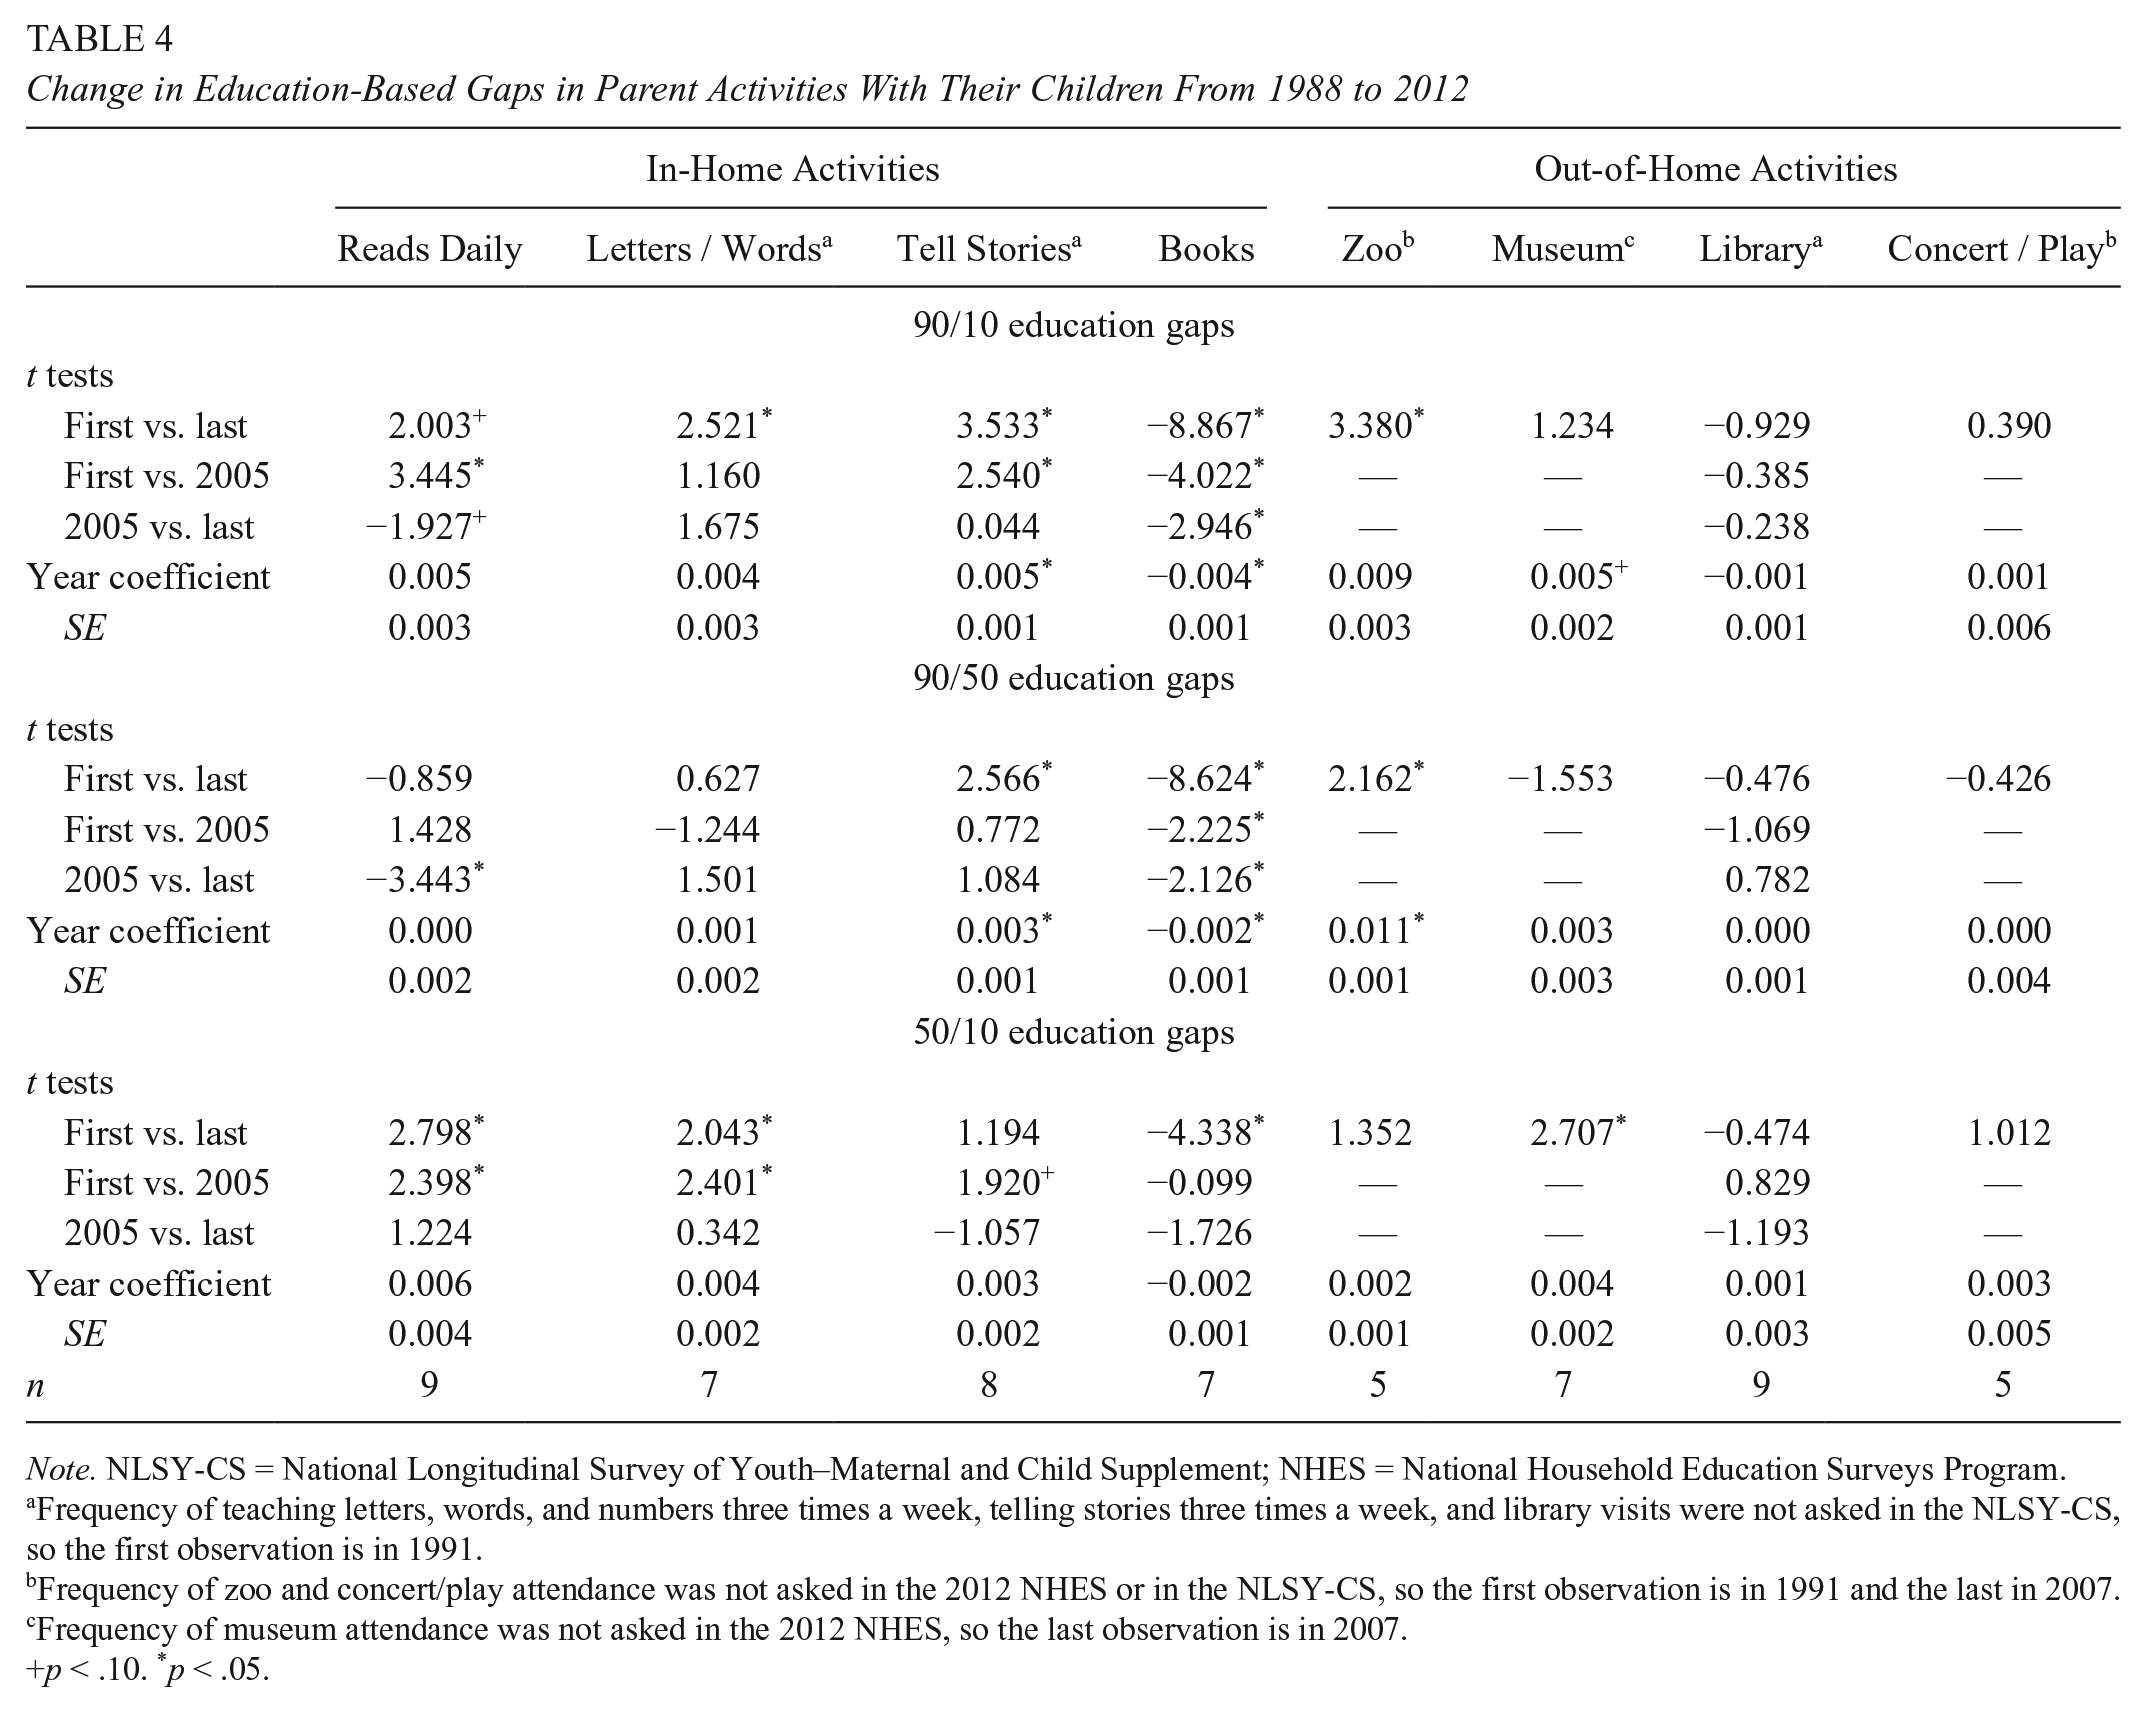
Note. NLSY-CS = National Longitudinal Survey of Youth–Maternal and Child Supplement; NHES = National Household Education Surveys Program.
Frequency of teaching letters, words, and numbers three times a week, telling stories three times a week, and library visits were not asked in the NLSY-CS, so the first observation is in 1991.
Frequency of zoo and concert/play attendance was not asked in the 2012 NHES or in the NLSY-CS, so the first observation is in 1991 and the last in 2007.
Frequency of museum attendance was not asked in the 2012 NHES, so the last observation is in 2007.
p < .10. *p < .05.
Income Gaps: In-Home Parenting Behaviors
Reads to child daily
The estimated 90/10 income gap in parents’ reading daily to children increased significantly between 1988 and 2012 from 18 to 30 percentage (see Table 3, Figure 1; t = 2.65, p < .05). Moreover, the linear coefficient for year in the model regressing the 90/10 gaps in each study on year and number of income categories was positive but significant only at the trend level. Comparing the change in the 90/10 income gaps between 1988 and 2005 with the same change between 2005 and 2012 revealed that this increase occurred in the 1990s and early 21th century but not in the most recent period, during which the gap decreased slightly (2005 vs. 2012, t = −2.10, p < .05). This nonlinear trend is depicted in Figure 1. The overall increase appears driven by the top income group increasing reading relative to the middle and bottom (see Figure 3). Specifically, in 1988, an estimated 33%, 22%, and 15% of the 90th, 50th, and 10th percentiles read daily to their children, whereas in 2012, 62%, 43%, and 32% did so. Thus, although parents at all income levels increased rates of daily reading, the top income group increased rates of reading more than the middle or bottom did (see Appendix A).
Teaches child letters, words, or numbers three times per week
The 90/10 income gap in teaching letters, words, or numbers increased by roughly 200% between 1991 and 2012, or from −4 percentage points (with the bottom income group somewhat more likely to do so) to 5 percentage points (with the top income group more likely to do so). This increase was significant (t = 4.35, p < .05), as was the positive year coefficient in the analogous regression model, at least at the trend level. The increase in the gap between 1991 and 2005 was significant at trend levels (see Table 3) and was roughly equal in size to the same increase between 2005 and 2012. This increase appears driven by the top income group increasing its teaching more than the middle or bottom (Figure 4). Whereas in 1991, 60%, 62%, and 64% of the 90th, 50th, and 10th percentiles taught letters, words, or numbers three times per week, in 2012, 72%, 66%, and 67% of those same groups did so.

Gaps over time between the 90th and 50th, 50th and 10th, and 90th and 10th percentiles: Teaching letters, words, or numbers.
Tells child story three times per week
The 90/10 income gap in telling the child a story three times a week doubled between 1991 and 2012, from 4 to 9 percentage points. This increase was significant when the gaps in these years were directly compared (t = 3.01, p < .05), although the linear year coefficient was nonsignificant in the analogous regression model. The increase occurred entirely between 1991 and 2005, with the gap remaining stable from 2005 to 2012. This nonlinear trend is depicted in Figure 1. Moreover, this increase is attributable to the top income group increasing its storytelling more than the middle or bottom group, rather than the bottom pulling away from the middle or top (Figure 5). In 1991, 40%, 37%, and 36% of the 90th, 50th, and 10th percentiles told stories three times per week, whereas in 2005, 59%, 52%, and 43% did so.

Gaps over time between the 90th and 50th, 50th and 10th, and 90th and 10th percentiles: Storytelling.
Child has ≥10 books
Whereas income gaps for in-home literacy activities increased over time, particularly during the 1990s, the 90/10 income gap for the child owning ≥10 books decreased between 1988 and 2012 from 33 to 20 percentage points. This decrease was significant in direct comparison of 1988 and 2012 (t = −5.28, p < .05), although the negative regression coefficient for year in the analogous regression model was nonsignificant. The sharpest change—in this case, a decrease—occurred between 1988 and 2005 (t = −9.57, p < .05). The decrease was driven primarily by the middle and bottom income groups moving closer to the rates of book ownership endorsed by the top (Figure 6). Specifically, in 1988, 94%, 80%, and 61% of the 90th, 50th, and 10th percentiles owned ≥10 children’s books, whereas in 2012, 99%, 94%, and 79% of those groups owned ≥10 books.

Gaps over time between the 90th and 50th, 50th and 10th, and 90th and 10th percentiles: Child owns ≥10 books.
Education Gaps in In-Home Parenting Behavior
Education gaps for in-home parenting activities were similar to those for income, although changes over time in the 90/10 education gaps were weaker in size and significance in some cases (see Table 4). For example, as with the income-parenting gaps, the 90/10 education gap in reading daily increased, whereas the 90/10 gap for book ownership decreased; however, the magnitude of those changes was smaller for education, as were the corresponding t test values. Over time, changes in the 90/50 and 50/10 education gaps for most activities followed the same trend as those for income and were either equally strong or stronger. For example, the 50/10 gaps in reading daily and teaching letters, words, or numbers increased from the first to last years and decreased for book ownership, and all changes were significant at conventional levels, unlike the corresponding changes for income. See Appendix B for estimated 90th, 50th, and 10th education percentile estimates for in-home parenting behaviors.
Out-of-Home Parenting Behavior
Took the child to a zoo in the past month
The 90/10 income gap for taking the child to a zoo in the past month increased between 1991 and 2007 (the last year for which data are available) from 1 to 15 percentage points. This increase was significant when years were directly compared (t = 3.06, p < .05), although the regression coefficient for year in the analogous regression model was nonsignificant and negative. The increase emerged between 1999 and 2007, not between 1991 and 1999, a nonlinear trend depicted in Figure 2. This increase is attributable to the top income group increasing zoo attendance while the middle and bottom were stable or decreased zoo attendance slightly. Specifically, in 1999, 22%, 14%, and 20% of the 90th, 50th, and 10th percentiles took their children to the zoo, whereas in 2007 those percentages were 32%, 20%, and 17%.
Took the child to a museum in the past month
The 90/10 income gap for taking the child to a museum in the past month increased from 10 percentage points in 1988 to 23 in 2007. This increase was significant when 1988 was directly compared with 2007 (t = 2.27, p < .05). The coefficient for year in the analogous regression model was also positive and significant. This increase appears driven by the middle and bottom income groups reducing their museum attendance while the top attended at consistent rates over time. Specifically, in 1988, 37%, 27%, and 27% of the 90th, 50th, and 10th percentiles attended a museum, whereas in 2007, 33%, 22% and 10% did so.
Took the child to a library in the past month
The 90/10 income gap for taking the child to a library in the past month decreased between 1991 and 2012 from 24 to 12 percentage points. This decrease emerged when the 1991 and 2012 gaps were directly compared (t = −3.65, p < .05) and when the 90/10 gaps were regressed on year. The decrease occurred primarily during the earlier period from 1991 to 2005. This decrease appears driven by the bottom income group increasing its library attendance rate while the middle and top income groups did not. Specifically, in 1991, 51%, 39%, and 27% of the 90th, 50th, and 10th percentiles visited a library, whereas in 2012, 50%, 40%, and 38% did so, respectively.
Took the child to a concert or play in the past month
The 90/10 income gap for taking the child to a concert or play increased from 10 percentage points in 1991 to 17 in 2007. This increase was nonsignificant when the years were directly compared (t = 1.66); however, the analogous regression coefficient was significant in models predicting the 90/10 gap over time. Moreover, the increase between 1991 (10 percentage points) and 1999 (21 percentage points) was significant at conventional levels (t = 4.72, p < .05), with no increase after 1999. This nonlinear trend is depicted in Figure 2. The increase is attributable to the top income group increasing its attendance over time while the middle and bottom did not. Specifically, in 1991, 29%, 24%, and 20% of the 90th, 50th, and 10th percentiles attended a concert or play, whereas in 1999, 43%, 29%, and 22% did so.
Education Gaps in Out-of-Home Parenting Behavior
Education gaps for out-of-home parenting activities were similar to those for income, and as with in-home activities, changes over time in the 90/10 gaps were weaker in size and significance in some cases (see Table 4). For example, although the 90/10 gap in library visitation decreased over time, those decreases were significant only for income, not for education. The increase in the 90/10 gap for museum visitation was also positive for both income and education but significant at conventional levels only for income. See Appendix B for estimated 90th, 50th, and 10th education percentile estimates for out-of-home parenting behaviors.
Sensitivity Analyses
One concern with our comparisons over time is that a few rely heavily on the NLSY-CS, which overrepresented socioeconomically disadvantaged mothers relative to national norms. To assess the impact of anchoring time trends with these data, we reran comparisons over time excluding the NLSY-CS for parenting behaviors for which the NLSY provided the first data point, including reading daily, child owns ≥10 books, and visiting a museum. Although the regression results for those outcomes were substantively unchanged, the difference between the first observed gap and the last for those outcomes was smaller when the NLSY data were excluded. The 90/10 gap for reading daily in 1996 (the first year data were available for that outcome after 1988) was 24 percentage points versus 30 in 2012, a nonsignificant difference (t = 1.19). The difference between the same gap in 2001 (21 percentage points) and 2012 was significant, however (t = 2.17, p < .05), suggesting an upward trend in the gap despite the exclusion of the NLSY. For owning ≥10 books, the decrease in the 90/10 gaps between 1991 (the first year in which data on that outcome was available after 1988, in which it was 23 percentage points) and 2012 (in which it was 20) is much smaller than the decrease between 1988 and 2012. However, the trend across years is clearly negative, as is the comparison between all years (except 2007) and 2012. For visiting a museum, using 1991 instead of 1988 as the anchor does not meaningfully alter t test comparisons with 2012 or 2005.
Another concern was that children’s average ages differed slightly across surveys and years. To address this concern, final regression models were rerun including a control for mean child age in each survey and year. The linear year coefficients were either unchanged or increased in size and significance with this specification (see Appendix C). For example, the year coefficients in models predicting the 90/10 income gaps for reading daily and telling stories increased from .008 to .012 and from .002 to .004, and both became significant at conventional levels.
Conclusion
Few trends are more ominous than the increase in class and achievement gaps between low- and high-income children in the United States. The rising income-based achievement gaps call into question whether the American dream of intergenerational mobility is now beyond the reach of many children raised in low-income families (Duncan & Murnane, 2011). These implications lend urgency to the need to better understand the nature and causes of these gaps.
Economically disadvantaged children’s limited access to cognitively enriching home environments may help drive growing gaps in cognitive and noncognitive skills, producing a feedback cycle that leads to low socioeconomic mobility and further growing inequality. Researchers know little about whether the socioeconomic gap in children’s learning environments have increased over time. The present study investigated this question by focusing on income- and education-based gaps in parents’ engagement in cognitively stimulating activities with their preschool-aged children.
Across the eight parenting behaviors that we examined, six show increases in income-based gaps favoring high-income children. Specifically, although we found a decrease in the income-based gap in children’s book ownership and library attendance, we find increasing income-based gaps for several other relevant parent behaviors, including reading and telling stories to children, as well as teaching children letters, words, or numbers. Income-based gaps in children’s out-of-home cultural activities, including attending a concert or museum or going to the zoo, also increased. For the most part, these gaps arise from top-income families pulling away from their middle- and low-income counterparts. For the six parent behaviors that demonstrate an overall increase in the income-based gap, three gaps—reading daily, teaching academic skills (e.g., letters, words, or numbers), and regular storytelling—have apparently plateaued since 2005. Our measures of out-of-home stimulation (attending a concert, museum, or zoo) are available only until 2007, so we cannot say whether those gaps have stabilized in recent years. Notably, these over time trends were similar for education-based gaps, although the magnitude of the gaps—and changes in gaps over time—was smaller for many parenting behaviors. The weaker findings for education could be an artifact of the smaller number of education categories available in the data sets: with less variation in education, education gaps may be measured with less precision than income-based gaps.
In sum, our results portray a mixed portrait of class-based changes over time in young children’s in- and out-of-home learning environments. On one hand, there is positive news insofar as some dimensions of low-income children’s home literacy environments appear to be catching up to, or at least have stopped falling further behind, those of their higher-income peers. Note, however, that because we do not have a measure of the raw number of books in the home, we cannot be certain that the gap in total book ownership has closed, just that the income-based gap in having very few books has closed. At the same time, although the gap for “reads daily” increased through 2005, many more low-income parents are reading daily today than 25 years ago. In fact, for many of our measures, the bottom 10% today looks like the top 10% 25 years ago, and this is good news.
Our findings may help to explain those of Reardon and Portilla (2015) showing a 15% narrowing of 90/10 income gaps in kindergarten children’s reading achievement between 1998 and 2010 (but little if any closing of the gap in other cognitive or noncognitive skills). Reardon and Portilla suggest that one contributor to the narrowing reading achievement gap could be low-income children’s increased access to higher-quality publicly funded preschool. Our findings suggest that an additional mechanism may be relative improvements in low-income children’s home literacy environments. These changes may also be linked. That is, the gap in book ownership and library attendance may have decreased in part because family literacy services are mandated by Head Start and parental book reading at home is strongly emphasized by similar subsidized preschools serving low-income children. Likewise, the income-based gap in book ownership and library attendance may have decreased because of outreach programs designed by libraries to increase attendance and engagement among low-income families. Head Start and Early Head Start grantees, for example, have increasingly formalized their joint relationships and programming with the Federal Institute of Museum and Library Services (Administration for Children and Families, 2012).
Yet, high-income children continue to pull ahead of their lower-income peers on specific school readiness activities and on broader aspects of cultural learning. These patterns may be due in part to the changing demography of family life. As high-income children are increasingly more likely than their lower-income counterparts to grow up in a married-parent family with mothers who were older at the time of the children’s birth, they may be increasingly enjoying home environments that provide positive support for learning and cognitive development. The fact that income-based gaps in book ownership and library attendance have narrowed while the gap in daily book reading has grown suggests that low-income parents should be supported to not only offer children literacy materials but also engage children with them on a daily basis. Measures of the latter (museum or concert going, zoo attendance) are distinctive among our measures of parenting by virtue of being potentially costly. In this sense, our results reflect the argument that growing income inequality increases the gap in the resources that high- and low-income families can spend on enrichment goods and services for their children (Kornrich & Furstenberg, 2013). The ways in which these specific activities relate to children’s cognitive or noncognitive skills remain uncertain but are a possible cause for concern given long-standing sociologic arguments (e.g., Bourdieu, 1986) about the role of “cultural capital” in shaping later life achievement.
A possible concern with the interpretation of our results is the reliability or “reporting bias” of these measures on the HOME scale. In the absence of objective measures of parent behavior, researchers must rely on the sorts of self-reported stylized measures that we use here or self-reported data from time diaries. Hofferth (2006) examines the hypothesis that parents exaggerate their reading with preschool-aged children (3 to 5 years old) when asked typical single-item questions relative to their self-reported activity in time diaries and whether the extent of exaggeration is greater for better-educated parents. Relying on data from the PSID Child Development Supplement, she found little statistically significant difference in the frequency of book reading between the stylized reports and the time diary reports. She did, however, provide some evidence to suggest that better-educated mothers exaggerate their activities in stylized questions, suggesting that our estimates of parenting behavior in the 90th percentiles of income and education may be inflated.
However, for this bias to alter our analyses, which focus on how gaps are changing over time, one would have to assume that the differential impact of social desirability bias is changing over time. Given that the overall numbers of parents—including low-income parents—who report engaging in these activities has increased over time, one could assume that low-income parents also became increasingly aware of what they “should” do with children; thus, their responses, too, would be more influenced by social desirability bias over time. If this were the case, it should lead to a decrease in the gap in reported parenting activities. We found increases in the gaps for most items. If anything, this potential changing nature of the bias would underestimate the changes in the gaps over time. Moreover, prior evidence relying on cross-sectional and longitudinal time diary data (Altintas, 2012; Kalil et al., 2012) mirrors the trends that we present here using the stylized measures.
Our results cannot illuminate why parents in the 90th percentile of the income distribution have continued to pull away from their economically disadvantaged peers on some dimensions of parent behavior. One argument is that economically advantaged parents increasingly view time with children as an “investment” (Guryan et al., 2008) and that they spend more time with their children because of the expected return or future benefits to their children from their time investment. Another possibility is that highly educated parents might receive more pleasure from spending time with their children; that is, they might spend more time with their children because it is considered “leisure.” Recent work by Kalil, Mayer, Delgado, and Gennetian (2015) presents evidence in favor of the investment motive. Whatever the reason, our results suggest that throughout the 1990s, higher-SES parents invested increasingly more time in young children than their lower-SES counterparts—a trend that, combined with rising income inequality, could contribute to growing gaps in cognitive and noncognitive skills, lower socioeconomic mobility, and further growing inequality.
Footnotes
Appendices
Change in Income-Based Gaps in Parent Activities With Their Children From 1988 to 2012, Controlling for Mean Child Age in Each Data Set

| Income Gaps | In-Home Activities |
Out-of-Home Activities |
||||||
|---|---|---|---|---|---|---|---|---|
| Reads Daily | Letters/Words a | Tell Stories a | Books | Zoo b | Museum c | Library a | Concert/Play b | |
| 90/10 | ||||||||
| Year coefficient | 0.012 * | 0.008 | 0.004 * | −0.001 | −0.002 | 0.007 * | −0.005 + | 0.023 * |
| SE | 0.003 | 0.004 | 0.001 | 0.001 | 0.003 | 0.002 | 0.002 | 0.001 |
| 90/50 | ||||||||
| Year coefficient | 0.007 * | 0.004 | 0.002 | 0.001 | −0.002 | 0.003 | 0.001 | 0.007 |
| SE | 0.002 | 0.004 | 0.001 | 0.001 | 0.008 | 0.003 | 0.001 | 0.003 |
| 50/10 | ||||||||
| Year coefficient | 0.004 | 0.004 | 0.002 | −0.002 | −0.000 | 0.005 * | −0.006 * | 0.016 |
| SE | 0.002 | 0.004 | 0.001 | 0.001 | 0.011 | 0.001 | 0.002 | 0.004 |
| n | 9 | 7 | 8 | 7 | 5 | 7 | 9 | 5 |
Note. NLSY-CS = National Longitudinal Survey of Youth–Maternal and Child Supplement; NHES = National Household Education Surveys Program.
Frequency of teaching letters, words and numbers three times a week, telling stories three times a week, and library visits were not asked in the NLSY-CS, so the first observation is in 1991.
Frequency of zoo and concert/play attendance was not asked in the 2012 NHES or in the NLSY-CS, so the first observation is in 1991 and the last in 2007.
Frequency of museum attendance was not asked in the 2012 NHES, so the last observation is in 2007.
p < .10. *p < .05.
Acknowledgements
This research was funded by grants to the authors from the National Science Foundation (1416575), the Spencer Foundation, the Russell Sage Foundation, and the Washington Center for Equitable Growth.
1.
While the National Household Education Surveys Program (NHES) did collect information on parenting behaviors in 2003, these data were collected almost exclusively for children aged 5 years.
2.
Per NCES data security requirements, the n value is rounded to the nearest 50.
3.
Note that all such constructions from here on will be presented “respectively” without the repeated notation of such.
4.
Early Childhood Longitudinal Study–Birth Cohort analyses were weighted with W3R0-W3R90 replicate weights. NHES analyses were weighted with NHES-provided analytic weights for each survey year.
Authors
ARIEL KALIL is a professor in the Harris School of Public Policy Studies at the University of Chicago, 1155 East 60th Street, Chicago IL, 60637;
KATHLEEN M. ZIOL-GUEST, PhD is research associate professor in the Department of Humanities and Social Sciences at New York University’s Steinhardt School of Culture, Education, and Human Development, 726 Broadway, Room 524, New York, NY 10003;
REBECCA M. RYAN is an associate professor in the Department of Psychology at Georgetown University, 3700 O Street, NW, Washington DC, 20057;
ANNA J. MARKOWITZ is a postdoctoral fellow with EdPolicyWorks at the University of Virginia’s Curry School of Education and Batton School of Leadership and Public Policy. Her research focuses on the implications of school engagement to youths’ socioemotional well-being and the nature and effects of early experiences for children’s school readiness.