
Abstract
This study is one of the first to estimate the impact of “inclusive“ science, technology, engineering, and mathematics (STEM) high schools using student-level data. We use multiple statistical strategies to estimate the effect on student achievement from 2 years of attendance at six such high schools in Ohio. The results indicate that two schools had positive effects on science achievement that appear to come at the expense of achievement in social studies. The other schools had negligible or, often, negative effects across both STEM and, particularly, non-STEM subjects. These results are consistent with studies indicating that inclusive STEM schools typically focus on problem-based, personalized learning rather than science and mathematics content. The analysis also reveals the importance of accounting for students’ prior test scores in science, in addition to math and reading, when estimating models that use only 1 year of prior test score data—something that existing studies fail to do.
An emerging model is the “inclusive” STEM high school. This type of high school combines nonselective admission policies with a STEM-focused curriculum to seed interest in the STEM fields and expand the STEM workforce pipeline (Means, House, Young, & Wang, 2013). It has proliferated over the last decade, enjoying support from a variety of political actors and education reformers, such as the Obama administration and the Bill and Melinda Gates Foundation. Yet, due to its recent emergence, there is little research that examines its academic impact. To our knowledge, Wiswall, Stiefel, Schwartz, and Boccardo’s (2014) study of 30 selective and nonselective STEM high schools in New York City is the only published study to use student-level data. 1 They find positive impacts of STEM school attendance on some math and science exams. However, although their use of student-level data enables them to better account for selection bias than analyses that employ school-level data, they do not account for students’ prior achievement in science. As our analysis reveals, that is a potentially important omission.
This study estimates the impact on academic achievement of six inclusive STEM high schools established in Ohio since 2006. It employs 2006–2013 student-level administrative data from the Ohio Department of Education to estimate the impact of 2 years of attendance at these high schools on 10th-grade standardized test scores in STEM subjects (math and science) and non-STEM subjects (reading and social studies). First, we estimated ordinary least squares (OLS) regression models comparing the achievement of STEM school students with the achievement of corresponding students in traditional public schools in STEM students’ districts of residence. Second, we estimated OLS models for which we used different propensity score–matching techniques to create comparison groups. Finally, for one school, we were able to use the results of admission lotteries as an exogenous source of variation in STEM school attendance to identify the causal impact of STEM school attendance on student achievement. Consistent with prior studies of student achievement, the models all account for prior student test scores in math and reading, in addition to the typical battery of demographic covariates. Additionally, contrary to existing research on STEM high schools, we compare estimates from these models to estimates from models that account for prior student test scores in science.
There is some debate in the literature about the validity of the nonexperimental techniques that we employ, but recent evidence from Forston, Gleason, Kopa, and Verbitsky-Savitz (2014) suggests that propensity score–matching estimates will be similar to experimental estimates if the pretreatment variables employed are highly predictive of posttreatment outcomes. Lagged test scores, particularly in the same subject as the outcome score, are strongly predictive of future test scores. Indeed, recent research has shown that bias is minimal in such “value added” estimates of school quality (e.g., see Abdulkadiroğlu, Angrist, Dynarski, Kane, & Pathak, 2011; Angrist, Pathak, & Walters, 2013; Deming, 2014). 2 In our case, the 10th-grade graduation tests contain much of the same content as the eighth-grade tests that we use to account for students’ educational histories. This strengthens the validity of our analysis for the two STEM subjects (math and science) as well as reading and represents a marked improvement over existing research that has failed to account for prior science scores that are highly predictive of performance on the achievement outcomes of interest.
The results indicate that, on average, attendance at these inclusive STEM high schools had a negative impact on student achievement across all four subjects—particularly the non-STEM subjects, reading and social studies. Although there is significant heterogeneity in effects across the six schools, only two schools are associated with statistically significant achievement benefits—around a 0.15–standard deviation advantage in science—but this impact is accompanied by a 0.1– to 0.25–standard deviation disadvantage in social studies. However, two schools are associated with large negative effects across all four of the tested subjects, with the negative effects being most pronounced in the non-STEM subjects. There is also evidence that African American students bear the brunt of these negative effects, whereas there were no significant differences in impact between male and female students.
The results are quite similar across the various models, whether estimates are based on all available STEM school and feeder district students, matched samples, or a restricted sample based on the availability of test scores in all subjects. However, the estimated effects of STEM school attendance depend significantly on whether models account for students’ eighth-grade test scores in science, in addition to test scores in math and reading. The results that we report in the preceding paragraph are based on models that account for students’ prior science scores because these models more plausibly account for prior student interest and aptitude in STEM fields. Indeed, our analysis suggests that nonexperimental studies of STEM schools that fail to account for prior science test scores should be viewed with skepticism. For example, the two independent STEM schools in our sample seem to have a positive impact on math achievement in models that account only for prior reading and math achievement. However, the magnitude of these impacts is cut in half and no longer approaches conventional levels of statistical significance when models account for students’ eighth-grade science scores. It is also noteworthy that accounting for prior science scores has a similar impact on estimates of achievement in non-STEM subjects.
Finally, it is worth emphasizing that all schools in the analysis were established in 2006 or later and that our estimates for each school are based on one to six student cohorts. The literature indicates that new charter schools tend to underperform for their first 3 to 5 years of operation, as compared with observationally similar traditional public schools, but then catch up to and sometimes surpass them afterward (Bifulco and Ladd 2006; Hanushek, Kain, Rivkin, & Branch, 2007; Sass 2006; Zimmer et al., 2009). There is reason to believe that these initial years were particularly trying for some of the STEM schools in our study, as some of them underwent construction or conducted classes in alternative buildings during a portion of the observation period. Accordingly, we estimated linear time trends to examine achievement progression in the five schools with multiple cohorts. The results show mostly null trends. Among the few discernable trends, all but one were negative.
As we discuss below, these results are not all that surprising. LaForce et al. (2014) show inclusive STEM schools do not generally emphasize coursework in science and mathematics. Instead, they typically focus on problem-based and personalized learning and the development of life skills. However, political actors often speak of STEM education as a critical way to improve student learning in subjects such as science and math. Indeed, our analysis indicates that students who score highly on science and math exams are far more likely to select into some of these schools, which is consistent with the notion that a substantive emphasis in these subjects is of import to parents. The results suggest that parents and policy makers may not always be getting from these schools what they think they are getting.
The remainder of this article is organized as follows. The next section provides background on STEM high schools in the United States, and the third describes the schools that are the subject of this study. The fourth section describes the data, and the fifth discusses the empirical methods. The sixth section reviews the results, and the last offers concluding thoughts.
STEM High Schools in the United States
Specialized STEM high schools in the United States date back to the establishment of Stuyvesant High School in 1904 and Bronx High School of Sciences in 1938. The late 1960s and early 1970s saw a surge in the establishment of specialized STEM schools, with the birth of magnet schools in the wake of the civil rights movement. In 1977, North Carolina became the first state to establish a statewide residential STEM high school for talented students, and Louisiana, Illinois, and Mississippi followed suit in the mid-1980s (Eilber, 1987; National Consortium for Specialized Secondary Schools of Mathematics, Science, and Technology, 2014). The rapid expansion of STEM magnet and state residential high schools in the 1980s led to the establishment of the National Consortium for Specialized Secondary Schools of Mathematics, Science, and Technology in 1988 (Atkinson, Hugo, Lundgren, Shapiro, & Thomas, 2007; Thomas & Williams, 2010). These schools continued to proliferate through the 1990s and into the 21st century. As of 2010, 28 states had public residential STEM high schools, and there are many more local STEM magnet and charter schools (Thomas & Williams, 2010).
The nonselective, “inclusive” STEM high school is an emerging model that marks a significant departure from previous approaches (Carnegie Corporation of New York, 2009; Means, Confrey, House, & Bhanot, 2008). Prior to the early 21st century, a majority of STEM-focused high schools, whether publicly or privately funded, were selective, with admission decisions based on competitive exams or previous academic achievement (Means et al., 2008). These schools have mainly sought to cultivate and strengthen existing STEM talent and interest. Inclusive STEM high schools, however, distinguish themselves by their nonselective admission policies. In cases of oversubscription, admission decisions are typically made by random lottery. Consequently, they also are thought to help address gender and racial STEM interest and achievement gaps. Studies have shown that inclusive STEM high schools tend to serve more racially diverse student bodies than both their selective counterparts and traditional public schools (Means et al., 2008; Means et al., 2013).
Inclusive STEM high schools are difficult to define because they do not operate under a single umbrella philosophy or organizational structure (Lynch, Behrend, Burton, & Means, 2013). Most recent studies, including those cited above, identify these schools from the use of nonselective admission policies, a school’s self-proclaimed emphasis on the STEM fields, and perhaps a school’s affiliation with an organized STEM education initiative. These schools vary significantly in their educational practices, but a systematic analysis of 25 inclusive STEM schools across the country conducted by the University of Chicago’s Center for Elementary Math and Science Education (see LaForce et al., 2014) revealed that inclusive STEM schools have some common characteristics.
First and foremost, LaForce et al. (2014) found that these schools feature problem-based learning, interdisciplinary instruction, student autonomy, and “rigorous learning,” which often entails mastery learning and a staff-created curriculum that features real-world applications. These schools also emphasize establishing a positive school culture, developing skills that students can use in their everyday lives and future careers (e.g., technological proficiency, communication, and collaboration), personalized learning (e.g., differentiation of instruction based on ability and relevance to students’ lives), and a connection between the school and local community (e.g., partnerships with external educational and business organizations). Thus, LaForce et al. (2014) discovered that what makes these schools “STEM” is not necessarily a greater emphasis on STEM subjects. Although that is the case in some inclusive STEM schools, what makes them “STEM” schools is primarily the use of problem-based, interdisciplinary, and personalized learning approaches—none of which is unique to this recent STEM movement.
Inclusive STEM High Schools in Ohio
The Bill and Melinda Gates Foundation has played a lead role in propagating the inclusive STEM high school model by funding large-scale initiatives in Texas, Ohio, North Carolina, Tennessee, and Washington throughout the early 21st century, often supporting state-initiated programs. Our study focuses on six such high schools in Ohio, established through state and local public-private partnerships and featuring the Bill and Melinda Gates Foundation as an important benefactor.
A major university and two nonprofit organizations in Ohio established a STEM-focused early-college high school in 2006, drawing students from multiple districts in a large metropolitan area. This high school was inclusive and employed a lottery-based admission system. One year later, these nonprofits committed funds and received significant financial support from the Bill and Melinda Gates Foundation and the State of Ohio to establish the Ohio STEM Learning Network (OSLN), which is anchored by a series of STEM “platform” schools across the state. The platform schools, including the original STEM high school established in 2006, were designed to serve as laboratories for STEM education and to disseminate best practices. They are located throughout the state so that they can tailor education to local needs.
Platform schools must commit to inclusive admission policies and five broad “design principles” established by the OSLN: “form new skills and sharp minds for a new century,” “engage partnerships to accelerate capacity and broaden opportunity,” “start and stay small,” “make STEM literacy attainable and desirable for all,” and “drive scalable and sustainable innovations” (OSLN 2014). There are few other requirements. This study focuses on the six OSLN platform schools that were still part of the OSLN in 2012–2013 and were at least 2 years old by the end of the 2012–2013 school year, given that this was the last year of available data. 3 All of these high schools also are (or eventually would be) state-designated STEM schools. To achieve a state “STEM” designation, schools must, among other things, provide the following:
(3) Evidence that each school will offer a rigorous, diverse, integrated, and project-based curriculum to students in any of grades six through twelve, with the goal to prepare those students for college, the workforce, and citizenship, and that does all of the following:
(a) Emphasizes the role of science, technology, engineering, and mathematics in promoting innovation and economic progress; (b) Incorporates scientific inquiry and technological design; (c) Includes the arts and humanities; (d) Emphasizes personalized learning and teamwork skills. (“STEM School Grants,” 2007)
Thus, Ohio’s STEM schools are required by law to feature problem-based and personalized learning and the development of life and career skills, which is consistent with the practices of inclusive STEM schools across the country.
Additionally, the Ohio Department of Education states that proposals to establish a state-sanctioned STEM school must do the following:
Create a public school (in any of the Grades 6–12) to help generate a talent base that will establish Ohio as a magnet and global leader in attracting, educating, and producing the next generation of scientists, engineers, and other professionals needed to create tomorrow’s innovations for the betterment of all citizens;
Foster increases in the number of Ohio citizens studying and working in STEM fields; and
Foster increases in all students developing stronger skills in problem solving, innovation, and teamwork. (Ohio Department of Education, 2015)
Presumably, these goals entail increasing proficiency in the STEM fields—including science and mathematics. Indeed, just below the delineation of these goals on the Ohio Department of Education’s website, the agency also emphasizes its role in helping schools with their educational programs in math and science.
Table 1 provides some basic information about each school that we examine in this study. As the table indicates, two of the schools in this study are state-chartered independent high schools (called “state STEM schools”) that receive a portion of district funds tied to their students and that rely heavily on private contributions, whereas the rest were established and are run by traditional public school districts. Additionally, some of these schools are relatively new, whereas others are traditional public schools that converted to STEM schools. Finally, the table reveals that, as of the 2012–2013 school year, Schools B and C included middle school grades. It is worth noting that all but one of the student cohorts analyzed in this study entered these schools in Grade 9 and that these schools added lower grade levels only later. The sole exception is that one cohort from School B entered in the seventh grade. Although this may affect this group’s eighth-grade scores, because we use a value-added approach, this will not interfere with out estimation of treatment effects in ninth to 10th grade.
STEM High Schools in the Analysis

Note. FTE = full-time equivalent; STEM = science, technology, engineering, and mathematics.
2012–2013 or prior.
As of 2012–2013.
Once again, these schools received the state’s “STEM school” designation and should thus, to some extent, emphasize problem-based and personalized learning, develop life and career skills, and generate interest and proficiency in the STEM fields. In practice, however, there is great variation in how these schools operate. For example, Schools A, B, and E were part of LaForce and colleagues’ (2014) study, which revealed that all three schools emphasize project-based learning, mastery learning, student autonomy, and flexible schedules. But these schools also differ from one another. For example, unlike School E (the district school), Schools A and B (the two independent state-chartered schools) also noted in surveys that students must complete cognitively demanding work. Additionally, these three schools (A, B, and E) differ significantly from the others in our analytic sample. For example, as the analysis below reveals, they are far more likely than the others to attract students with high proficiency levels in science and math.
These STEM schools have received significant resources from government and private actors. For example, in 2007, Ohio House Bill 119 allocated $13 million to STEM schools and programs, and the Bill and Melinda Gates Foundation added $12 million to create the network of STEM hubs and platform schools (OSLN, 2012). Indeed, anecdotes abound that schools have sought the STEM designation simply to secure the millions of dollars in grants that the state distributes to these schools. In addition, Race to the Top funds, as well as a multitude of financial and other gifts 4 from private and public STEM school partners, have subsidized STEM schools and their students (e.g., through the provision of supplies)—often above and beyond the funding that these schools get from the typical local, state, and federal sources.
Unfortunately, systematic, building-level financial data are unavailable for all six schools, but an analysis of enrollment and student:teacher ratios revealed that these STEM high schools vary significantly in size and instructional resources. During the 2012–2013 school year, the median public high school in the state enrolled 465 students and employed 28.6 teachers—a student-teacher ratio of 16.26. 5 As Table 1 indicates, four of the six STEM schools are “small” in that they have enrollments lower than the median of the traditional district high school and only two have student:teacher ratios lower than the state median. Indeed, the district schools are either large (School C)—which conflicts with the “small school” model that OSLN has sought to implement for platform schools—or small with high student:teacher ratios (Schools D and F). Indeed, these figures suggest that the financial benefits of being an OSLN-platform STEM high school—the focus of this analysis—come in the form of equipment or access to community resources (including expertise from nearby universities, for example), as opposed to teacher labor.
In summary, although political actors have touted inclusive STEM high schools as potential solutions to low student achievement in math and science—especially, achievement gaps in these subjects—case studies of these schools suggest that their focus is not generally on increasing student achievement in these subjects. Additionally, although there have been millions of dollars in public and private money spent on these schools, they do not generally invest more resources in the most important school-based educational input: teachers. These facts suggest that Ohio’s STEM platform schools are unlikely to generate large overall gains in student achievement and that any gains in STEM subjects (science and math) could come at the expense of achievement in non-STEM subjects. Finally, the variability in these schools’ designs, educational practices, and resources likely correlates with significant variability in their effectiveness when it comes to STEM instruction.
Data
The analysis employs student-level administrative data collected by the Ohio Department of Education from the 2005–2006 (fiscal year [FY] 2006) to 2012–2013 (FY2013) school years. These data include standard student-level information on the building and district of attendance, demographics, and scale scores on state standardized tests. The tests are administered at the end of the school year in grades 3–8 and grade 10. A passing grade on the 10th-grade tests is required for a high school diploma. Because all students are tested in both eighth and 10th grade, we focus on the estimation of 2-year STEM high school treatment effects. 6 The first STEM platform school admitted its first freshman class in FY2007, so the FY2006–FY2013 data allow us to track up to six cohorts of students at each platform school from eighth through 10th grade.
Table 2 displays summary statistics for the sample of STEM school students as well as the sample of feeder district students—the control group in this study. For district STEM schools, the operating district is the feeder district, 7 whereas the independent STEM school feeder districts include all districts from which at least one student in a cohort is included in the sample of STEM students. Test scores presented in the table, as well as those used in the analysis below, have been normalized to have a mean of zero and a standard deviation of one within each grade, subject, and year. Additionally, the student sample on which the table is based is restricted to students for whom we had 10th-grade test scores across all subjects, as this restricted sample is the focus of the analysis below. However, the descriptive statistics (and the results of the analysis) are similar for the full sample of students.
Descriptive Statistics for Student Sample Used in the Analysis

Note. The table presents descriptive statistics for the restricted sample of students used to estimate the ordinary least squares models based on unmatched samples. Specifically, the sample is restricted to students for whom we had 10th-grade test scores in all four subjects and who attended the science, technology, engineering, and mathematics (STEM) school or a school’s feeder district. The table presents the mean test scores (standardized by year, grade, and subject) in standard deviation units for all students who attended the STEM school or the traditional public school district in which STEM school students resided. It also reports the percentage of the STEM school or feeder district students who fit into the demographic categories and who previously attended charter schools.
For feeder district schools terminating in ninth grade, only out-of-district transfers are counted toward the school attrition rate. Schools E and F share a feeder district in which the primary district high school closed after fiscal year 2011. Therefore, only out-of-district transfers between fiscal years 2011 and 2012 for students in this feeder are counted toward the school attrition rate.
Following Tuttle, Teh, Nicholas-Barrer, Gill, and Gleason (2010), we use a quasi intent-to-treat approach for defining our samples of STEM and feeder district students. Specifically, any student who was enrolled in a STEM school in ninth grade is included in the STEM school sample regardless of whether she or he stayed through the end of 10th grade. Similarly, the sample of feeder district students includes those who attended the feeder district in ninth grade regardless of whether they remained in the same school, transferred within the district, or transferred outside the district in 10th grade. This sample definition mitigates bias from differences in school attrition rates between STEM school and feeder district students. Cumulative school attrition rates—defined as the percentage of students in the sample who did not attend the same school for two full academic years 8 in ninth and 10th grade—are also displayed in Table 2. As the table indicates, Schools A, B, and C have significantly higher attrition rates than their feeder district schools, whereas School D’s attrition rate is significantly lower than that in its feeder district schools. These differences support the use of the quasi intent-to-treat approach.
Overall, Table 2 demonstrates that there are significant differences between the STEM school students and their counterparts in traditional public schools and that these differences also vary significantly among the six schools. For example, the two independent STEM schools—Schools A and B—draw from numerous districts, which is why there are many feeder district students for comparison; in addition, their students—as well as students who attended district Schools D and E—have significantly higher prior test scores than their counterparts attending traditional public schools in their districts of residence. However, the students at School C—a district STEM school that, unlike the others, is more of a neighborhood school than a choice school—tend to have lower eighth-grade test scores, are more economically disadvantaged, are more likely to be African American, are more likely to be female, and are less likely to be labeled gifted when compared with their feeder district counterparts. 9 Finally, students attending independent STEM schools, as well as district School D, were more likely than their traditional district counterparts to have attended charter schools.
It is important to note that the analysis is based on only a subset of students attending the STEM schools and feeder districts. In particular, the sample of STEM school students included in the regressions is only about three-fifths of the sample of attendees due to the combination of unmatched eighth-grade records and missing test scores and demographic information. The data are particularly limited for Schools C and D, as only 50% of their students are included in the analysis. This raises legitimate concerns about the accuracy of the information in the data set and the external validity of our findings. To the extent that data are inaccurate or not missing at random, our results may not reflect the impact of the STEM schools across the entire population of attendees. Given recent concerns about data manipulation in Ohio, 10 omission of poorly performing students is a particular concern. However, Schools C and D, for which the data are most limited, also exhibit the poorest performance, which mitigates the concern that poorly performing students were systematically excluded from the data.
Empirical Methods
Our empirical strategy consists of estimating student growth models comparing the achievement of students who attended one of the six STEM schools with students who attended traditional public schools in the feeder districts. Specifically, the analysis entails the estimation of models that include all feeder district students (with some restrictions) as well as models estimated with a smaller, matched sample. We also used an instrumental variables approach to estimate the impact of STEM school attendance for one of the six schools. This section reviews the procedures that we used to conduct these analyses.
Student Achievement Model
We primarily employ growth models to address potential selection bias and to identify STEM school treatment effects. Specifically, the treatment effect estimates are based on the following model of student achievement:

where yig is student i’s test score in 10th grade and
To evaluate heterogeneity in school effectiveness, school-specific treatment effects are estimated with a slightly modified version of the model:

where
The STEM school students included in the first set of models are those who attended one of the six STEM schools and for whom we had 10th-grade test scores in all subjects. The feeder district students included in these models are those attending a traditional public school in ninth grade in a district where at least one resident in their cohort attended a STEM school and for whom we had 10th-grade test scores in all subjects. More explicitly, following Angrist et al. (2013), feeder district students are restricted to those enrolled in traditional public schools—not charter schools—in their respective districts of residence. The results are similar if the samples are not restricted to students with all four test scores.
Matching Analysis
The sample of feeder district students described above may not be an appropriate control group for evaluating STEM school performance, because STEM school students are not representative of their respective cohorts and districts of residence. We conducted additional analyses based on matched samples to address this potential problem. Because matching improves balance in the distribution of student characteristics across treatment and control groups, we minimize the implicit extrapolation of treatment effects to dissimilar groups of students.
In general, the identifying assumptions underlying matching techniques are very similar to those underlying simple OLS regression (Angrist & Pishke, 2009). As such, matching is an effective strategy for addressing bias due to selection on observable characteristics. We employ lagged test scores as matching variables and in subsequent regressions on matched samples, so the matching treatment effect estimates presented below also are primarily identified under the assumption of common trends conditional on observables.
A broad array of matching techniques can be applied in program evaluation contexts. Two of these techniques, exact and propensity score matching, are particularly common in the school choice literature (Angrist et al., 2013; Dobbie & Fryer, 2013; Tuttle et al., 2010; Woodworth, David, Guha, Haiwen, & Lopez-Torkos, 2008). We report the results based on propensity score–matching techniques because the dimensionality problem associated with exact matching required us to drop many student observations. Propensity score matching entails matching observations on their probability of selecting into treatment (i.e., their propensity score) rather than on vectors of covariates and relying on the balancing property of the propensity score to achieve desirable sample balance.
After matching and evaluating the balance of matched samples, we estimated treatment effects based on these matched samples using the models described above. We also weighted these samples to account for imbalance in the number of students in the treatment and control groups.
Procedure for Matching Based on Propensity Scores
First, we estimated probit models of STEM school attendance that are some variant of the following form:
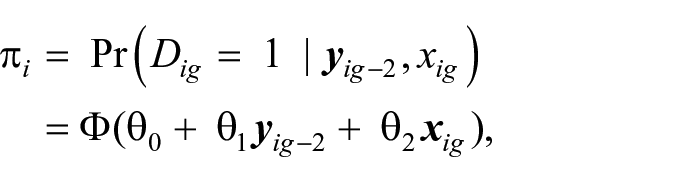
where Φ represents the normal cumulative distribution function. Due to the heterogeneity of the student populations across the six platform STEM high schools and their respective feeder districts, we estimated separate probit propensity score models for each STEM high school. As in the achievement model, the demographic variables (
The analysis based on the larger, unmatched sample of students indicates that it is important to control for baseline test scores in math, reading, and science. For this reason we included all of these test scores in the propensity score models when possible. 12 Additionally, we obtained the greatest balance when we modified the above model by interacting all test score variables with one another, including the square of each test score variable and by interacting demographic characteristics with one another. We also estimated propensity scores using models with no interaction terms, using linear probability models, and using separate models for each school-cohort combination. We selected the propensity score model presented here because it provides superior covariate balance. (The results of the probit propensity score models are presented in Appendix A.)
We used two techniques to match students on the basis of their propensity scores—1:1 nearest-neighbor matching within caliper and radius matching, both with replacement. Specifically, we first matched students exactly on cohort and district of residence and then applied the two matching techniques within these exactly matched subgroups. To ensure common support over the range of propensity scores among treatment and control groups, we required matched controls to fall within a specified caliper around the estimated propensity score of the treatment observation to which it is matched. Specifically, given the results from Cochran and Rubin (1973) and following Rosenbaum and Rubin (1985), we specified a caliper equal to 0.25 standard deviations of the pooled standard deviation of the estimated propensity scores across treatment and control students.
Following Heckman, Ichimura, and Todd (1997) and Heckman, Ichimura, Smith, and Todd (1998), we calculated balance statistics separately for each propensity score model. We evaluated covariate balance according to the standardized bias in covariate values between pre- and postmatching treatment and control groups (see Rosenbaum & Rubin, 1985; Stuart, 2010). (The procedure and balancing results are presented in Appendix B.) Additionally, because radius matching is one to many and because both matching techniques involve replacement (as some STEM schools draw from the same districts), balance statistics and subsequent regressions are calculated with weights for the matched control group where each control student i is given a weight, wi, equal to
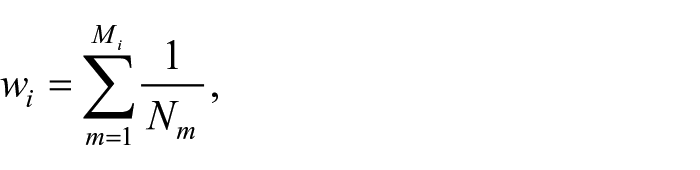
where Mi is the total number of treatment observations to which control student i is matched and where Nm is the total number of control students matched to the mth treatment student to which control student i is matched. This makes the total weight of the matched control sample equal to the number of students in the matched treatment sample.
Using Lottery Results as an Instrument
We were able to obtain data on admission lotteries for one of the schools (School A). Thus, for this school, we also estimated the average effect of attending School A for those students who attended as a result of winning the lottery. We used a two-stage least squares regression in which lottery outcomes served as an instrument for STEM school attendance (see Angrist & Imbens, 1994). Specifically, restricting the analysis to students who applied to attend this school—some of whom won a seat and some of whom did not—in the first stage, we regressed STEM school attendance on the lottery outcome and the full battery of covariates from the models described above. We then used the estimated probability of attendance for lottery winners and losers in the second stage, along with all covariates, to estimate the impact of STEM school attendance across the three cohorts for which we had admission data. Standard errors are corrected for the fact that the probability of attendance is estimated rather than measured directly.
The primary threat to internal validity is that admissions were not in fact random. To test for this possibility, we regressed each pretreatment covariate on the lottery outcome. None of the regressions yielded a coefficient estimate with a magnitude of 0.04, and none of the coefficients approached conventional levels of statistical significance. These tests support the internal validity of this design. Thus, this limited analysis’s internal validity complements the analysis that we describe above, which has superior external validity.
Results
The results presented in this section are from models limited to students for whom we have 10th-grade test scores across all four subjects. We report only these results so that we can compare outcomes across subjects and because they are broadly similar to those that we obtained using all available student data across all specifications. First, we present results from the OLS models that employ the larger, unmatched sample of students, followed by a similar analysis based on samples created with the two propensity score–matching techniques described above. We then present the results of models estimated individually for males, females, African Americans, and Caucasians, as well as by student cohort within each school.
OLS Models Based on Unmatched Sample
Table 3 presents the estimated impact of STEM school attendance on achievement in math, science, reading, and social studies using the larger, unmatched sample of students. Each column presents the estimated effects from three separate OLS regressions: one that estimates a single STEM school effect (“all STEM schools”), one that estimates separate parameters for independent and district STEM schools (“disaggregated by STEM school type”), and one that estimates separate parameters for each STEM school. Odd-numbered columns include prior test scores in math and reading. Even-numbered columns include prior test scores in math, reading, and science. Heteroskedasticity-robust standard errors are reported in parentheses below the regression coefficients. Bolded coefficients are significant at the following levels for a two-tailed test: *p < .05 or ∧p < .10.
Estimates of STEM School Effects: Unmatched Sample
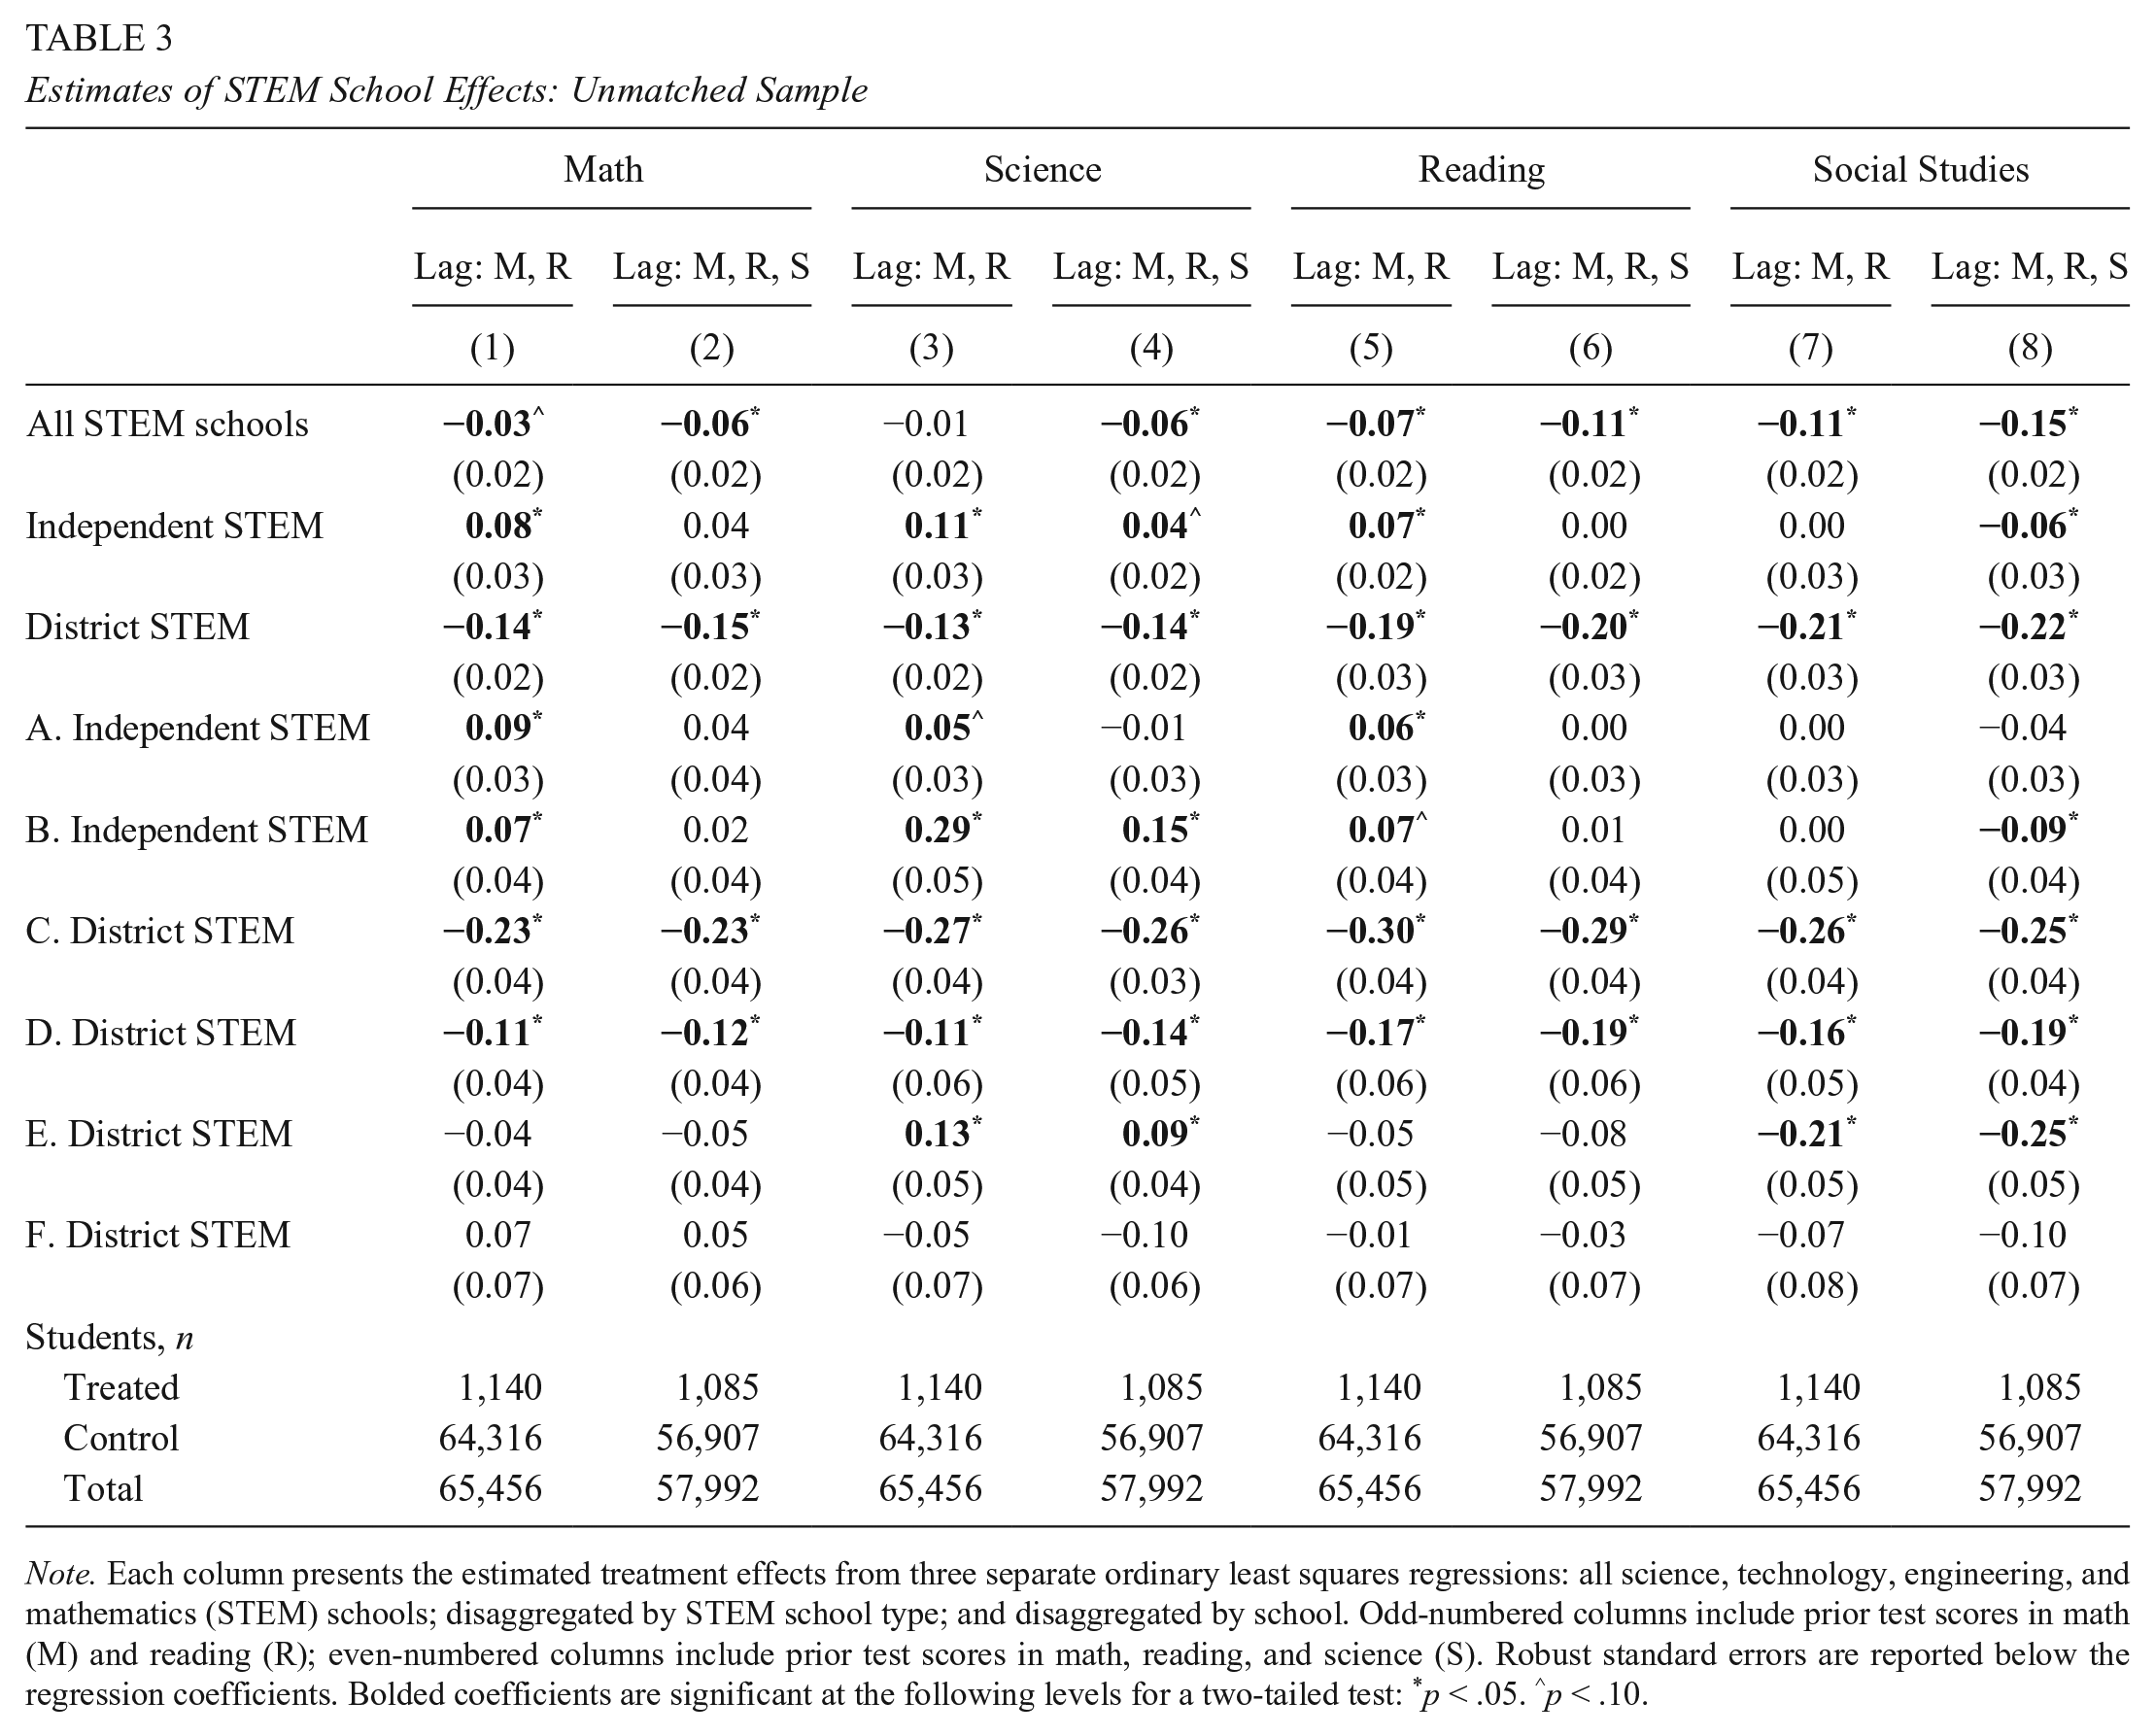
Note. Each column presents the estimated treatment effects from three separate ordinary least squares regressions: all science, technology, engineering, and mathematics (STEM) schools; disaggregated by STEM school type; and disaggregated by school. Odd-numbered columns include prior test scores in math (M) and reading (R); even-numbered columns include prior test scores in math, reading, and science (S). Robust standard errors are reported below the regression coefficients. Bolded coefficients are significant at the following levels for a two-tailed test: *p < .05. ∧p < .10.
The first row of Table 3 reveals that, overall, 2 years of attendance at the STEM schools had a negative impact on student achievement in 10th grade. This negative impact is more pronounced when models include students’ eighth-grade test scores in science 13 —and the negative impact is substantively significant in the non-STEM fields, for which STEM school attendance is associated with a disadvantage of around 0.11 standard deviations in reading and 0.15 standard deviations in social studies. As the propensity score model results in Appendix A reveal, students with higher test scores in science are more likely to attend five of the six STEM schools—all else held equal—so accounting for prior science scores addresses selection bias in models of STEM school achievement.
Table 3 also reveals significant heterogeneity across schools. For example, independent STEM schools have null effects in math and reading (which appear positive when models include lags only for math and reading scores), a positive impact in science, and a negative impact on social studies. District STEM schools, however, have substantively significant negative impacts across all subjects. Finally, the schools within these two categories also have impacts that vary significantly. For example, one independent STEM school has null effects across all subjects, whereas the other has a positive impact on science achievement (0.15 standard deviations) and a negative impact on achievement in social studies (−0.09 standard deviations). Additionally, the substantial negative impact of district STEM schools is driven in large part by two schools—Schools C and D. Indeed, district STEM School E has a positive impact on science achievement, but like the independent STEM school with such an impact, this impact is countered by a negative impact in social studies.
There are a couple of general takeaways. First, when one accounts for students’ prior test scores in science, only two schools have a positive impact on achievement—both in science only—and this significant impact in science appears to come at the expense of achievement in social studies. Second, the results indicate that two of the four district STEM schools have significant negative impacts.
OLS Models Estimated With Matched Samples
Table 4 presents the results of student growth models estimated with the matched samples. For each subject, we present the results of models estimated via 1:1 “nearest neighbor” and 1:N radius propensity score–matching methods. Once again, each column presents the estimated effects from three separate regressions: “all STEM schools,” “disaggregated by STEM school type,” and “disaggregated by school.” Unlike the previous table, however, all models account for prior test scores in math, reading, and science; the regressions are weighted to account for matching with replacement; and nonrobust standard errors are reported below the regression coefficients.
Estimates of STEM School Effects: Matched Sample

Note. The table presents the estimated science, technology, engineering, and mathematics (STEM) school effects from ordinary least squares regressions with samples based on the 1:1 “nearest neighbor” (NN) matching methods (odd-numbered columns) and radius matching methods (even-numbered columns). Each column presents the estimated effects from three separate regressions: all STEM schools, disaggregated by STEM school type, and disaggregated by school. All models account for prior test scores in math, reading, and science. Standard errors appear in parentheses below the regression coefficients. Bolded coefficients are significant at the following levels for a two-tailed test: *p < .05. ∧p < .10.
Table 4 reveals that models estimated with the matched samples yield results similar to those presented in Table 3. That the impacts are broadly similar lends us additional confidence that the results of the models based on the larger, unmatched sample are valid.
OLS Models by Race and Gender
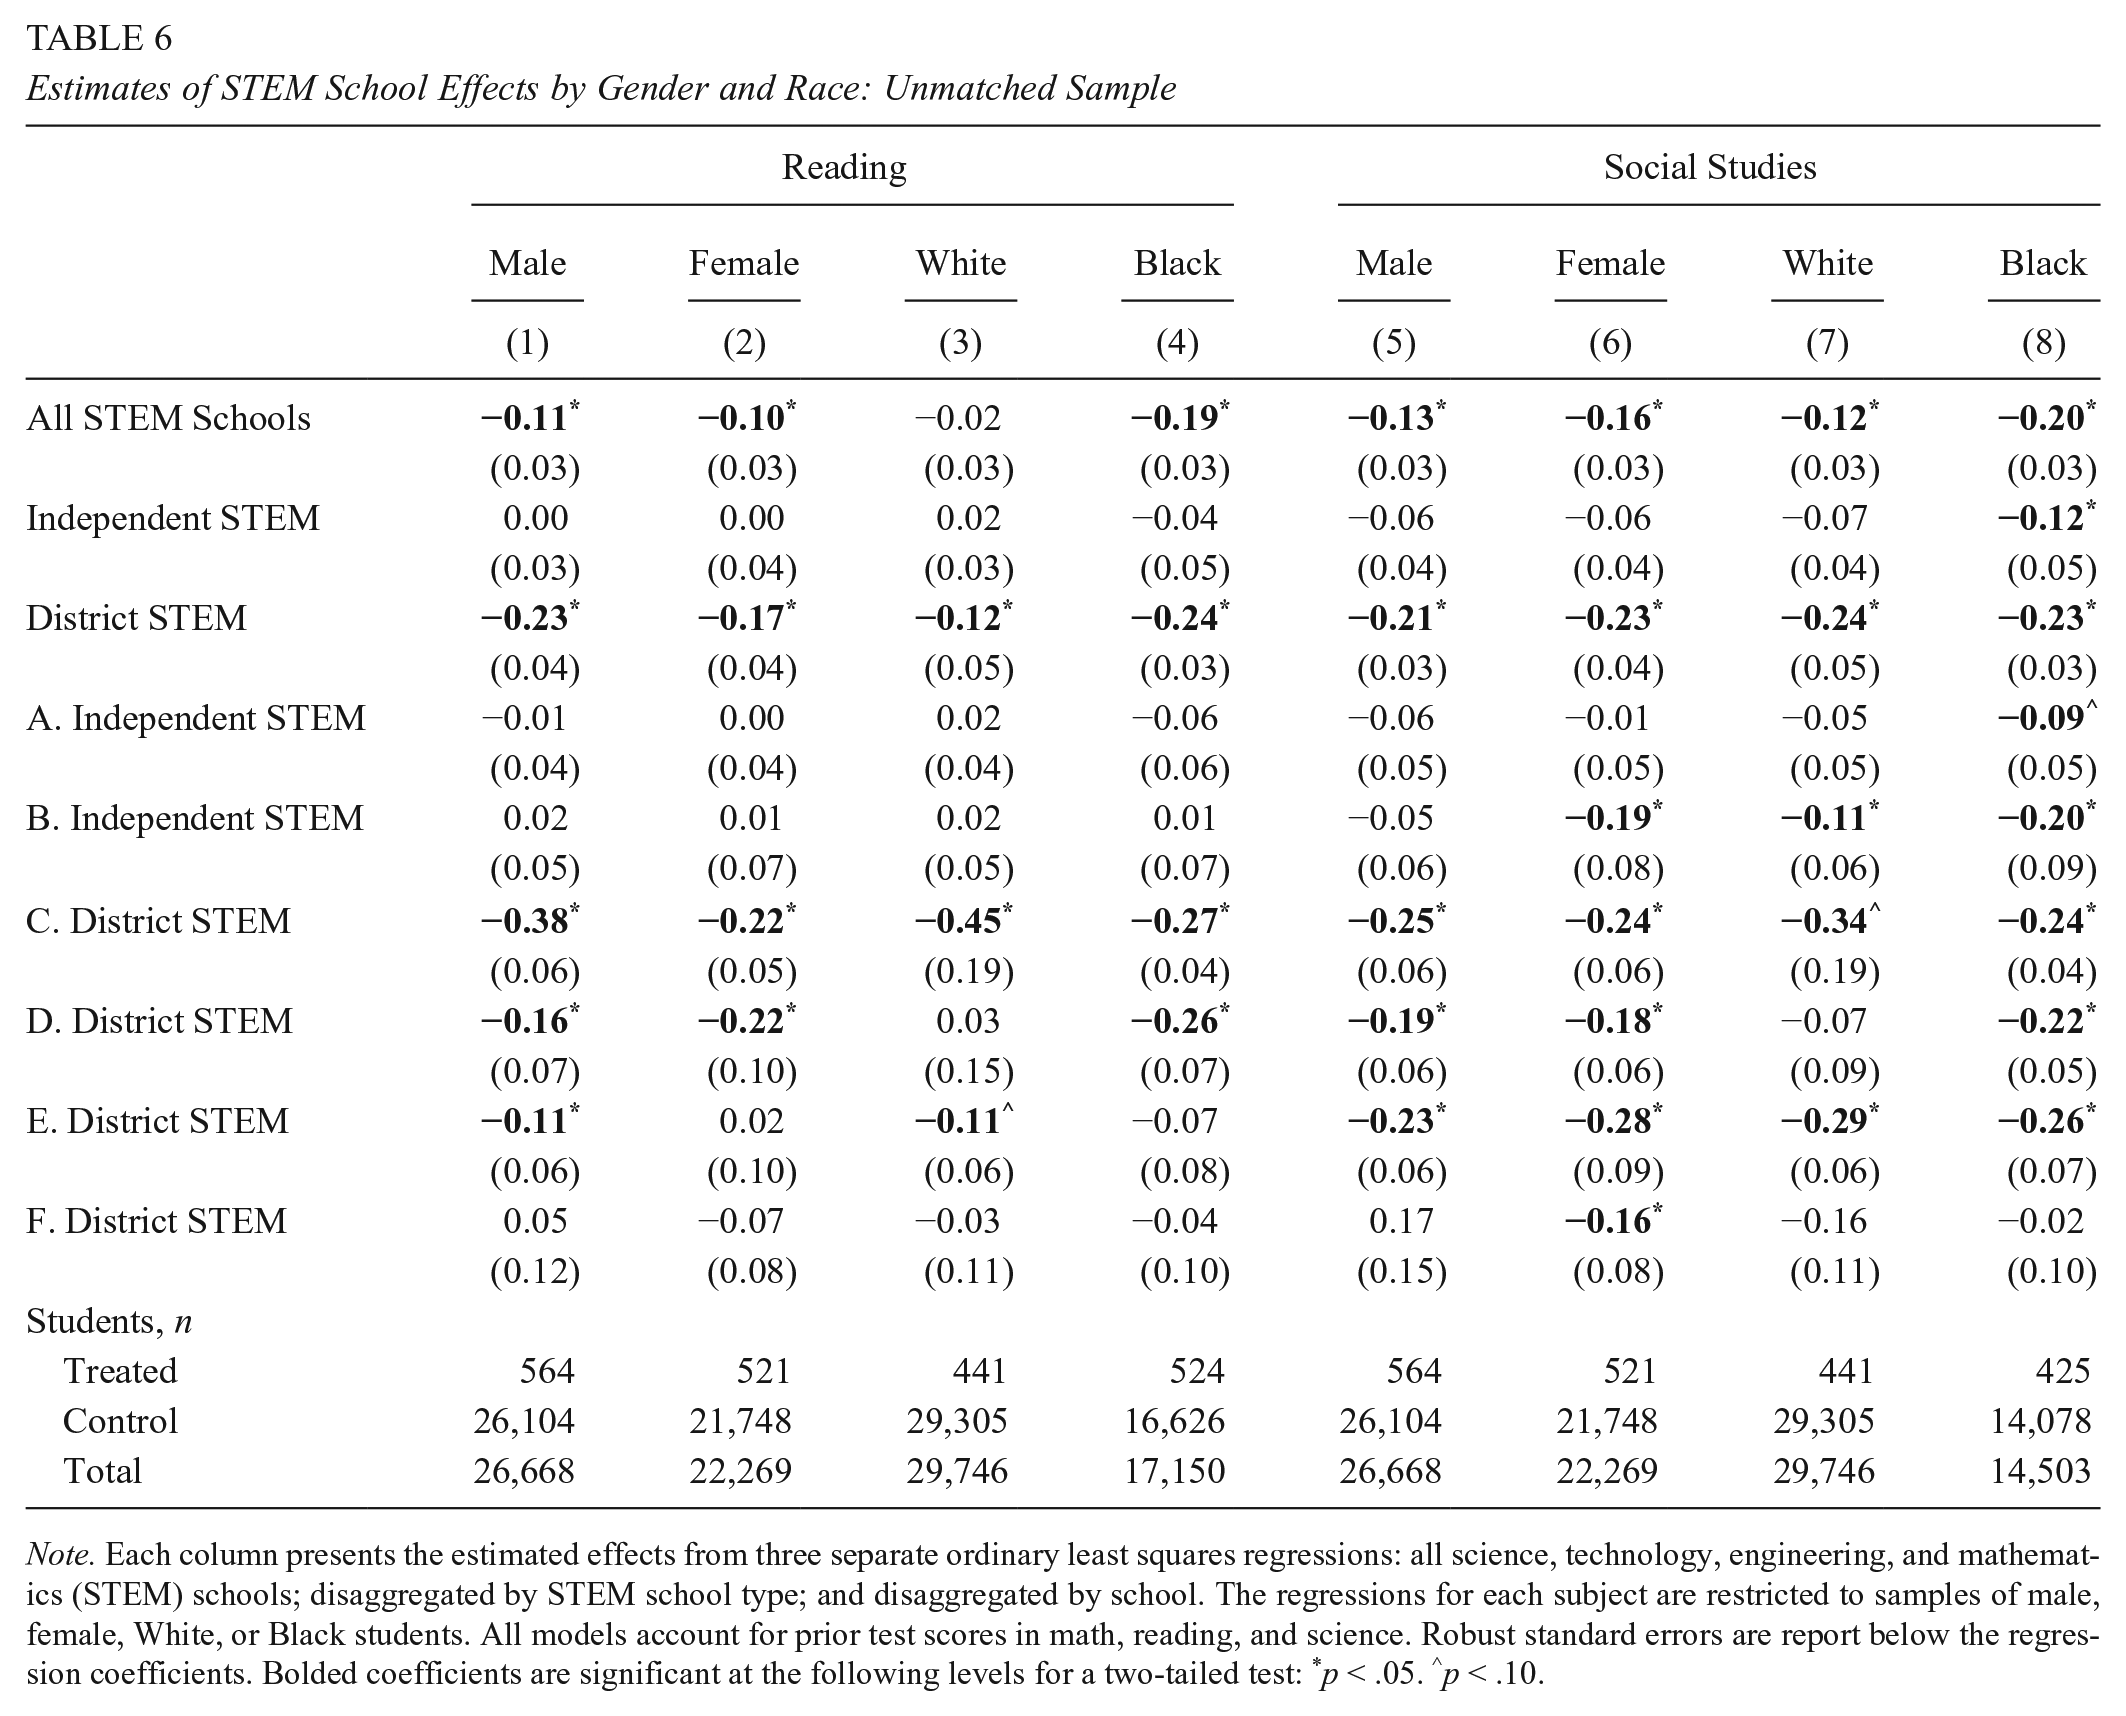
The six STEM platform schools in this study are inclusive high schools that, to some extent, are meant to address STEM interest, achievement, and attainment gaps by race and gender. Although the descriptive statistics in Table 2 (and the propensity score model in Appendix A) clearly indicate that students who do well on science exams (and who are therefore less likely to be female, African American, or Hispanic) are more likely to enroll, the geographic locations and inclusive policies of these schools seem to expand access to a STEM-focused curriculum. Given the purpose of these STEM schools, it may also be that their impact varies by gender and race. In Tables 5 and 6, we present the results of the OLS models based on the unmatched samples (as in Table 3) but restricted to male, female, Caucasian, or African American student samples. (There are too few Hispanic students to estimate these models.) Once again, all models account for prior test scores in math, reading, and science, and robust standard errors are reported below the regression coefficients.
Estimates of STEM School Effects by Gender and Race: Unmatched Sample
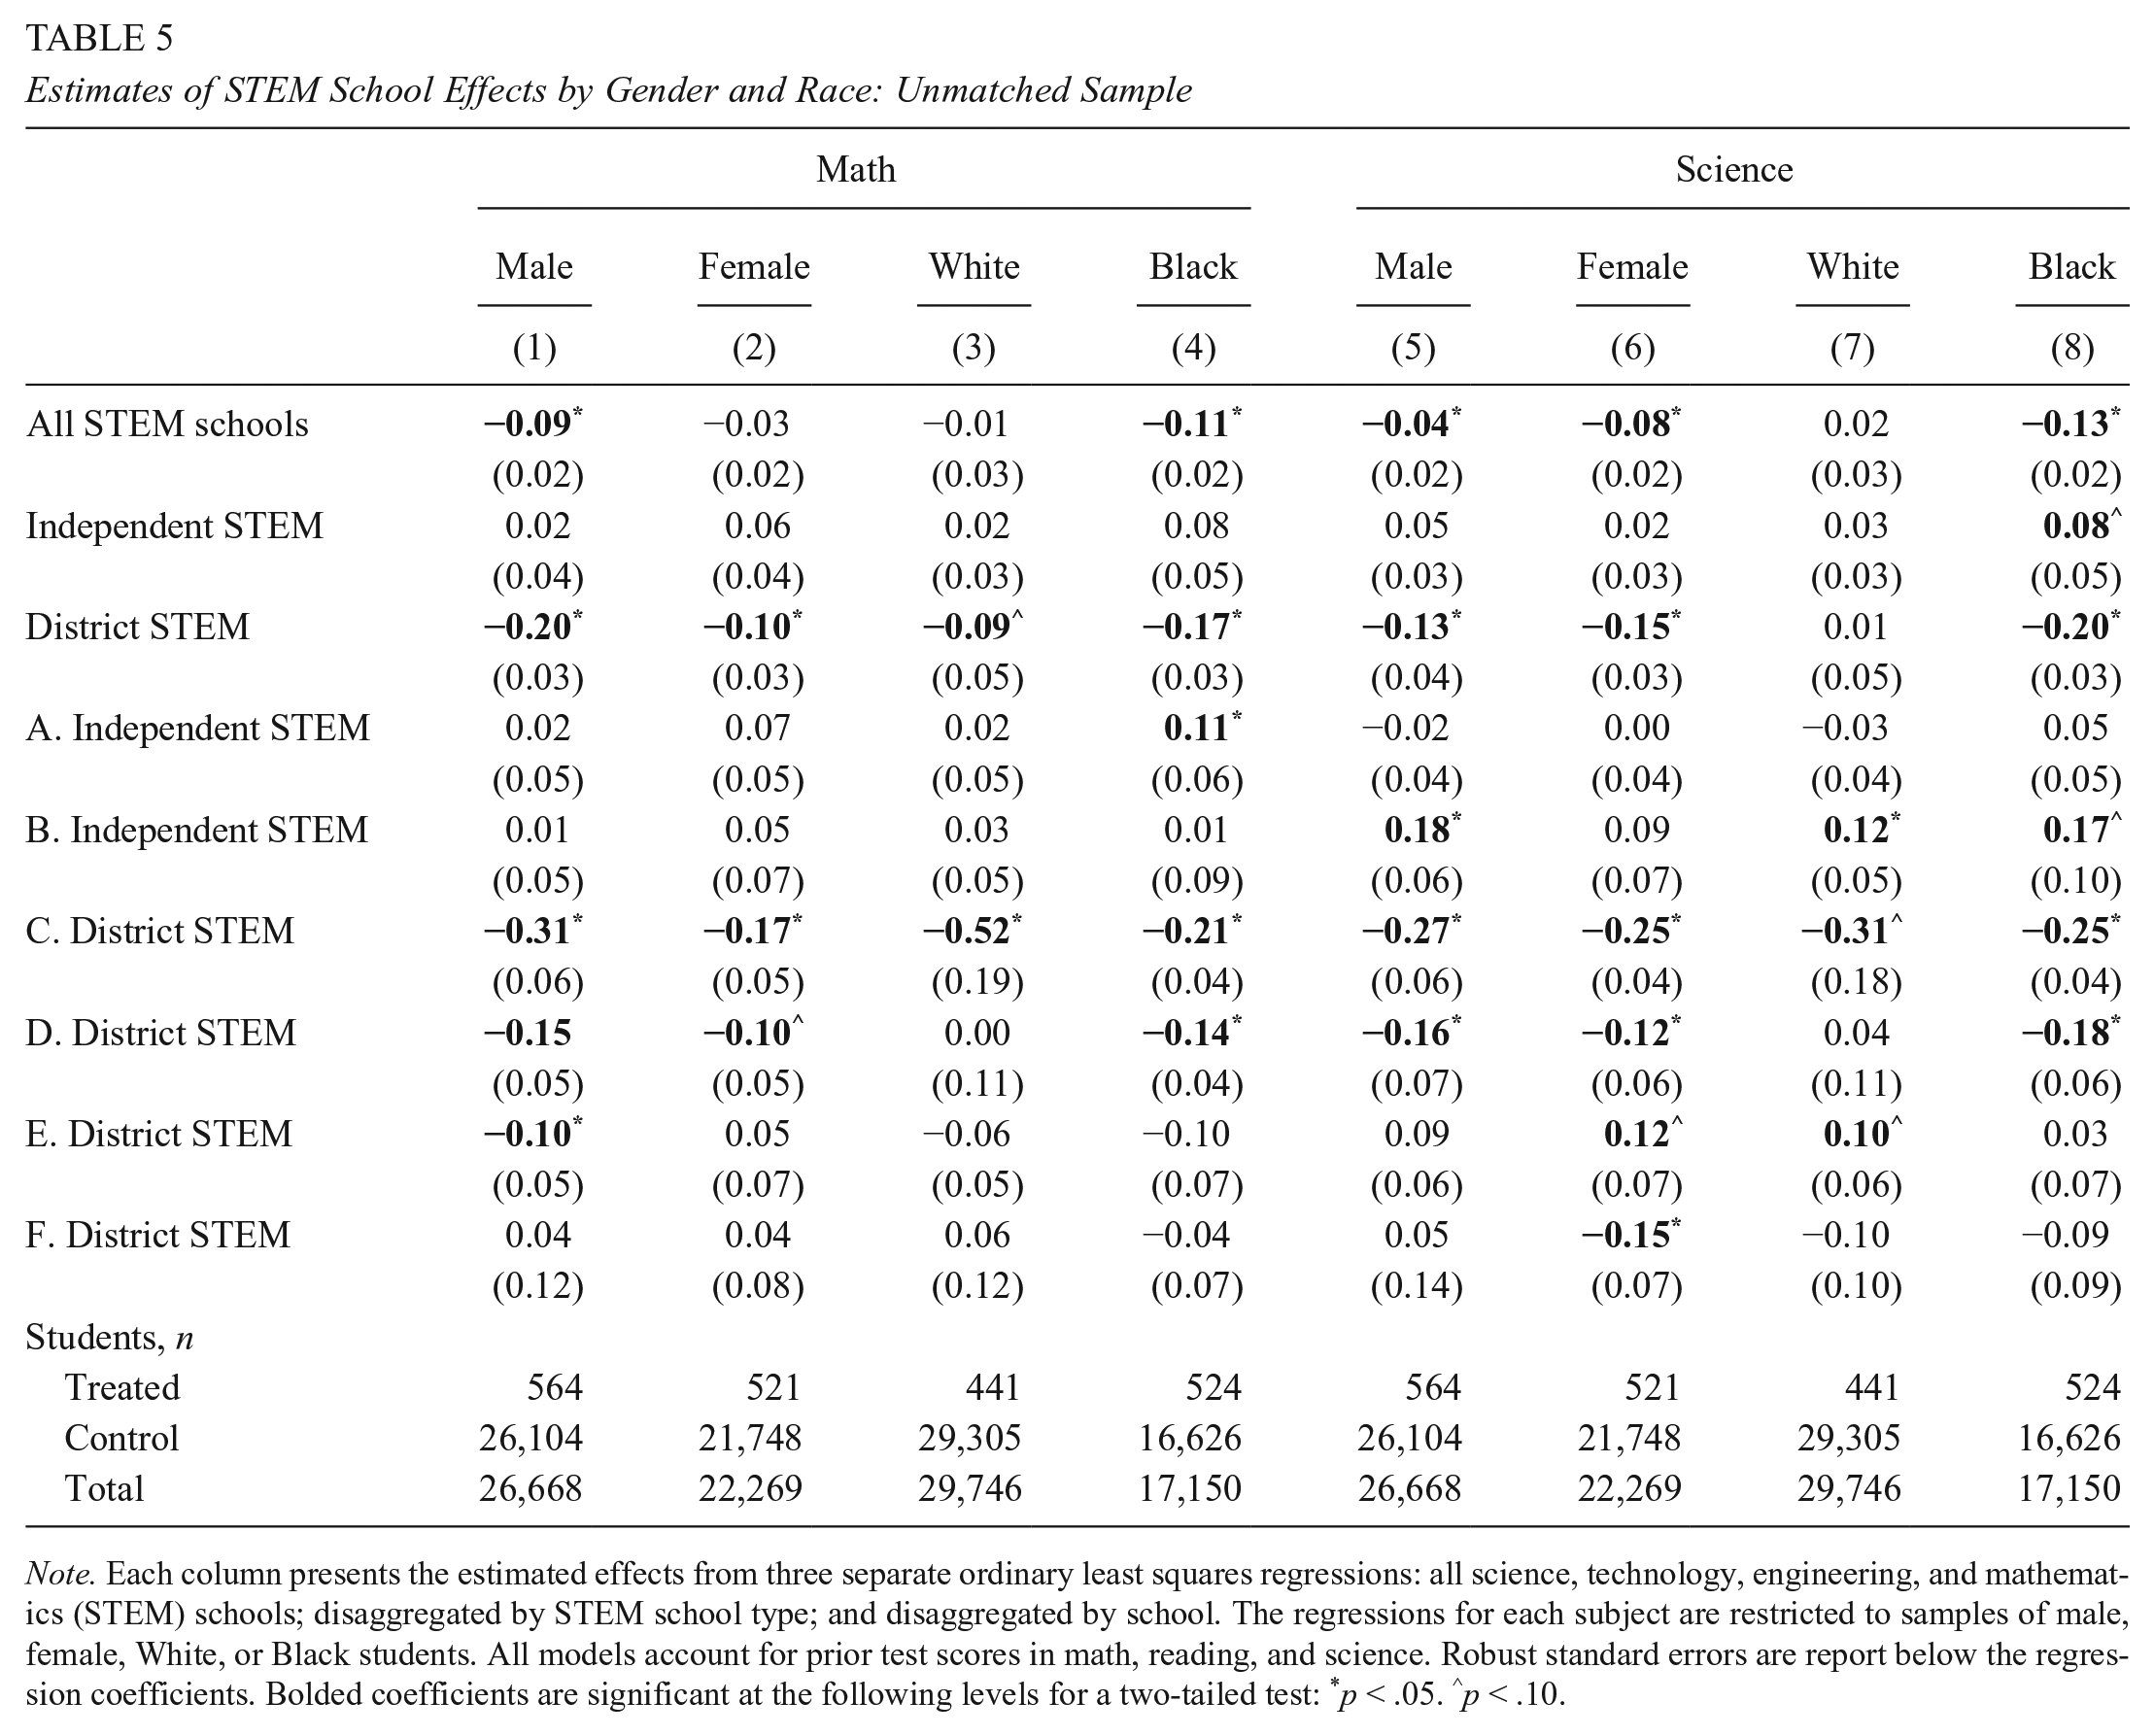
Note. Each column presents the estimated effects from three separate ordinary least squares regressions: all science, technology, engineering, and mathematics (STEM) schools; disaggregated by STEM school type; and disaggregated by school. The regressions for each subject are restricted to samples of male, female, White, or Black students. All models account for prior test scores in math, reading, and science. Robust standard errors are report below the regression coefficients. Bolded coefficients are significant at the following levels for a two-tailed test: *p < .05. ∧p < .10.
Estimates of STEM School Effects by Gender and Race: Unmatched Sample
Note. Each column presents the estimated effects from three separate ordinary least squares regressions: all science, technology, engineering, and mathematics (STEM) schools; disaggregated by STEM school type; and disaggregated by school. The regressions for each subject are restricted to samples of male, female, White, or Black students. All models account for prior test scores in math, reading, and science. Robust standard errors are report below the regression coefficients. Bolded coefficients are significant at the following levels for a two-tailed test: *p < .05. ∧p < .10.
Table 5 reveals that for math and science, the negative STEM school effects had a disproportionate impact on African American students. The results for Caucasian students are null. Males appear to be more negatively affected in math than women, but both genders experienced negative impacts in science. As Table 6 illustrates, the results for reading are similar to those for science, but it appears that STEM school attendance also harms the achievement of Caucasian students in social studies—though to a lesser extent than it harms African American students. One reason for this differential impact by race appears to be that the very worst, district-run STEM schools disproportionately serve African American students.
OLS Models With Time Trends
The estimates presented above to a significant extent are based on student performance data from these schools’ early years of operation. Indeed, if it takes 3 to 5 years for schools to get established (e.g., see Bifulco & Ladd 2006; Hanushek et al. 2007; Sass 2006; Zimmer et al., 2009), then only two schools were “established” when the latest cohorts that we analyze took the 10th-grade tests at the end of the 2012–2013 school year. To examine whether the negative results that we unearthed are attributable to these schools’ growing pains, we estimated linear time trends in STEM school performance for each of the four subjects. For each STEM school, the time trend variable takes the value of zero in the year in which the school’s first cohort entered 10th grade and increases by one in each subsequent year. School F is omitted because only a single cohort was observed.
Table 7 presents the results for our time trend analysis. Among the STEM subjects, there are no statistically significant trends. Outside the STEM subjects, there is a negative trend in reading at School A and negative trends in social studies at Schools A and E. The only positive trend is observed at School C in social studies, but its social studies scores remain very low relative to the comparison group. 14 Given that a linear trend is a strong assumption, we also estimated models with school by cohort dummy variables to examine trends over time, but no additional trends were discernable. These results are presented in Table C1. These results do not preclude these schools from improving going forward, but for the five schools with multiple cohorts—particularly the established independent STEM schools—it is clear that the results of this study are not due to typical achievement trajectories for newly established schools.
Estimates of STEM School Trends Over Time

Note. This table presents estimated science, technology, engineering, and mathematics (STEM) school and time trend effects from ordinary least squares regressions. Each column presents the effects from a single regression disaggregated by school. Robust standard errors are reported below the regression coefficients. Bolded coefficients are significant at the following levels for a two-tailed test: *p < .05. ∧p < .10.
Two-Stage Least Squares Models for School A
School A is the only school from which we could obtain admission data. The school provided sufficiently informative lottery data for three student cohorts. Table 8 presents the second-stage results of the two-stage least squares models that include all covariates but prior science scores so that we can include the first cohort in the analysis. As the table indicates, the coefficient estimates for math and science are somewhat more positive, and the estimate for social studies is somewhat less negative than the estimates in Table 3 that account for prior science scores. However, the coefficient for reading achievement is quite a bit larger in magnitude. Unfortunately, the models lack statistical power, as standard errors are often 3 times as large as those in Table 3. Thus, we cannot be sure that the null results are due to there being no substantively significant effects. That the coefficients are roughly comparable to those in Table 3 is nonetheless reassuring.
Two-Stage Least Squares Estimates of Attending STEM School A

Note. The table presents two-stage least squares estimates of the effect of attending School A on academic achievement. The model is based on only three of the six cohorts. Standard errors are reported in parentheses. *p < .05 (two-tailed test). STEM = science, technology, engineering, and mathematics.
Conclusion
The results suggest that, overall, the first 2 years of attendance at Ohio’s STEM platform high schools have had a negative impact on student achievement in STEM and, especially, non-STEM subjects. There is considerable heterogeneity in effects across the six schools, but only two schools can claim to boost achievement in any subject (science). Generally, student achievement suffered most in non-STEM subjects and among African Americans. One should not evaluate these schools solely on the basis of 10th-grade achievement tests, of course. These schools focus on problem-solving skills and group work that standardized exams—particularly Ohio’s graduation tests—may not capture, for example. Indeed, if some of these schools simply help foster student interest and attainment in STEM fields (via early college opportunities, for example), they may very well achieve their goals of improving and broadening the STEM workforce pipeline in spite of comparable or lower student achievement.
However, promoters of these schools have long claimed that they improve achievement, citing student test scores as evidence that they help traditionally underserved populations beat the odds. Despite the limitations of test scores discussed above, standardized tests—particularly Ohio’s graduation tests—do provide a useful barometer for gauging knowledge of basic concepts and principles. Regardless of other possible benefits of Ohio’s STEM schools, it is clear that the STEM schools studied here do not, on average, improve achievement in these basic content areas. The consequences of this might be particularly significant because the purpose of these platform schools is to identify best practices and disseminate them.
These results may not be all that surprising. The Ohio STEM schools studied here, like their counterparts across the nation, may not emphasize math and science content as much as observers assume. They tend to focus on problem-based and individualized learning, which does not inherently favor STEM fields. Moreover, although these schools have received state and private funds as part of STEM initiatives, their student counts and student-teacher ratios are highly variable and do not suggest a clear advantage in terms of instructional resources. Indeed, some have very high student-teacher ratios as compared with non-STEM public high schools. It is perhaps unsurprising, therefore, that the two schools that have a positive impact on science achievement are also associated with a negative impact in social studies achievement.
The results presented here force us to reconsider both the definition of a high-quality STEM education and the ability of contemporary standardized tests to evaluate STEM education quality. Additionally, they illustrate how an analysis of achievement growth can lead to mistaken impressions if researchers account only for one prior year of reading and math achievement, as they often do. Accounting for prior science achievement appears to be important for controlling for self-selection into STEM schools, and studies that fail to do so may overestimate STEM school impacts.
Footnotes
Appendix A: Propensity Score Models
We estimated separate propensity score models for each school. Table A1 presents the results of these models. The sample in each model includes all students in the unmatched regression analysis, except for those with characteristics that perfectly predict non-STEM school attendance. As the results indicate, the characteristics that predict selection into treatment, as well as the nature of the relationships between particular characteristics and probability of treatment, vary by school.
Appendix B: Procedure for Evaluating Balance
Simple t tests on the differences in mean characteristics between treatment and control groups can be misleading because the dissipation of significant differences that result from matching may simply be due to loss of statistical power rather than to improvements in sample balance. Thus, we examined balance by calculating standardized bias using the following formula:
where
Table B1 presents standardized bias calculations. Bolded figures indicate a standardized bias above an absolute value of 10: a threshold above which some researchers consider bias to be elevated. The postmatching sample includes only those treatment and control observations that were successfully matched. A significant drawback of evaluating balance via standardized bias is that, unlike t tests, there is no well-established threshold for distinguishing between acceptable and unacceptable levels of standardized bias. Nevertheless, Table B1 shows that both matching methods significantly reduce average absolute standardized bias across the covariates for each school. The overall mean of the absolute bias across all characteristics for each school go from a range of 13.1–30.8 for the unmatched samples to 1.9–16.0 for 1:1 matched samples and 2.2–10.9 for the radius-matched samples. Of particular importance, there are large reductions in the standardized bias across eighth-grade test scores.
Acknowledgements
We thank the Ohio Department of Education and the Ohio Education Research Center (OERC) for providing data and funding (as part of CSP905512). In particular, we thank Josh Hawley at the OERC for his support and for providing feedback on the initial draft of this manuscript; the staff at the Center for Human Resource Research, especially Lisa Neilson, Randy Olsen, and Jaron Shook; Courtney Heppner for pointing us to helpful resources on Ohio’s STEM schools; David Burns and his staff at the Battelle Memorial Institute for helping us gain access to some of the STEM schools; and, finally, the staff at Metro Early College High School. The authors alone are responsible for the design and execution of the analysis and for the contents of this article. Some of the results presented here will be disseminated via an OERC policy brief.
1.
Young, House, Wang, Singleton, and Klopfenstein (2011) evaluated the impact of the first 31 inclusive science, technology, engineering, and mathematics (STEM) schools established by the Texas High School Project’s T-STEM initiative. The authors employed school-level data and used statistical techniques to match STEM high schools to observationally similar traditional public high schools. Their regression analysis indicates that T-STEM high schools were associated with greater achievement in math and science than that of the matched traditional public schools.
2.
Deming (2014) showed that bias is nonexistent if multiple years of prior test data are used but that there is some bias if only one prior year of test scores is used. But this may be due to his not accounting for other covariates in that specification. As Abdulkadiroğlu, Angrist, Dynarski, Kane, and Pathak (2011) and Angrist, Pathak, and Walters (2013) revealed in their study of charter schools, one baseline score may be sufficient if one also accounts for baseline demographics, as we do.
3.
We excluded one district school because its implementation of a STEM program was difficult to determine and because the Ohio Auditor of State determined that it had manipulated its data.
4.
For example, one STEM school is on a university campus. In addition to the building provided by the university, the school benefits from having direct access to various campus resources, such as faculty and their courses.
5.
Our calculations are based on data publicly available on the Ohio Department of Education website.
6.
Some have raised concerns about our using the results of the Ohio Graduation Test to examine student achievement growth, citing potentially insufficient “stretch” in the assessment that might impede our ability to estimate effects—particularly for students on the high end of the achievement distribution.
7.
We omitted from the analysis the few students who attended a district STEM school by taking advantage of district open enrollment.
8.
A full academic year for high school students during all years in the study period refers to continuous enrollment from the end of the first week in October through the administration of the Ohio Graduation Test in mid-March as defined in the Ohio Department of Education’s annually published data reporting instructions, the Education Management Information System manuals (fiscal year 2007–2013 editions).
9.
School C seems to have adopted the STEM model in an effort to turnaround a low-performing high school, so it is qualitatively different from the other schools in our study.
10.
The Ohio Department of Education requires that a test score report be submitted for each enrolled student regardless of whether or not the student took the test. Test score reports for untested students should include a code indicating the reason why the student did not take the test (fiscal year 2007–2013 editions). The missing 10th-grade test scores at Schools C and D are largely due to missing test score reports rather than existing test score reports indicating untested students. A statewide audit of K−12 data reporting for the 2010–2011 school year found evidence of improper record keeping at nine school districts across Ohio (Yost, 2013).
11.
We do not include math and reading test scores from prior grades, to protect our sample size. Additionally, we exclude prior scores on social studies tests because they were not administered for much of our panel. Finally, because our preferred specifications include eighth-grade test scores in science—and because the eighth-grade science test was not administered to the first cohort in our panel—we present results primarily from models estimated without the first year of data from School A. As we mention later, models that are not restricted in these ways yield similar results.
12.
Grade 8 test scores in science are not available for the first cohort of one of the platform schools. To include this cohort in the analysis, we estimated a separate propensity score model that includes lagged test scores only in math and reading. However, to make the results that we present comparable across the various modeling approaches, we report the results of models that exclude this cohort from the analysis.
13.
In results not presented here, we estimated models that control only for lagged math and reading test scores but that also exclude Cohort 1 from the sample. We find evidence that change in the estimated STEM school effects between the models that lag only math and reading scores and the models that also lag science scores are, in fact, driven by the inclusion of the additional lagged test scores and not by the exclusion of Cohort 1.
14.
Given that School C is essentially a neighborhood school that converted to STEM school as part of what is ostensibly a turnaround effort, the trend analysis is particularly helpful because it shows that the STEM focus has not led to improvements over time.
Authors
JENNIFER GNAGEY is an assistant professor in the John B. Goddard School of Business and Economics, Department of Economics, Weber State University, 1337 Edvalson Street, Ogden, UT 84408;
STÉPHANE LAVERTU is an associate professor at the John Glenn College of Public Affairs at The Ohio State University, 110 Page Hall, 1810 College Road, Columbus, OH 43210;