
Abstract
Recent accounts suggest that accountability pressures have trickled down into the early elementary grades and that kindergarten today is characterized by a heightened focus on academic skills and a reduction in opportunities for play. This paper compares public school kindergarten classrooms between 1998 and 2010 using two large, nationally representative data sets. We show substantial changes in each of the five dimensions considered: kindergarten teachers’ beliefs about school readiness, time spent on academic and nonacademic content, classroom organization, pedagogical approach, and use of standardized assessments. Kindergarten teachers in the later period held far higher academic expectations for children both prior to kindergarten entry and during the kindergarten year. They devoted more time to advanced literacy and math content, teacher-directed instruction, and assessment and substantially less time to art, music, science, and child-selected activities.
In recent years, major news outlets have run stories with titles such as “The New First Grade: Too Much Too Soon”; “More Work, Less Play in Kindergarten”; and “Kindergarten or ‘Kindergrind’?” (Gao, 2005; Orenstein, 2009; Tyre, 2006; Vise, 2007). Although anecdotal accounts from teachers and parents describe kindergarten classrooms characterized by mounting homework demands, worksheets, and pressure to learn to read as early as possible, there is surprisingly little empirical evidence about the extent to which kindergarten classrooms have changed over time.
This paper fills that gap, describing changes in public school kindergarten classrooms over time using two large, nationally representative datasets. We document systematic changes across five key dimensions of the kindergarten experience: (a) teachers’ beliefs about school readiness, (b) time allocated to academic and nonacademic subjects, (c) classroom organization, (d) pedagogical approach, and (e) assessment practices.
These changes are important to document because a large body of research suggests there are meaningful and potentially long-term implications to the way early childhood classrooms are structured and taught (Chetty et al., 2011; Claessens, Engel, & Curran, in press; Pianta, La Paro, Payne, Cox, & Bradley, 2002). Although there is growing consensus that children’s early childhood learning experiences can meaningfully influence their short- and longer-term life outcomes (Barnett, 1995; Chetty et al., 2011; Yoshikawa et al., 2013), it is less clear precisely what aspects of the early learning environment (e.g., curricular focus, pedagogical approach) are most critical for promoting these gains.
In particular, there is substantial debate among parents, educators, researchers, and policymakers about the potential benefits and risks of orienting early childhood learning experiences more squarely toward academic content (Duncan, 2011; Elkind & Whitehurst, 2001; Zigler, 1987; Zigler & Bishop-Josef, 2006). Although critics of academically focused kindergarten caution that focusing heavily on academic content is not “developmentally appropriate” (Datar & Sturm, 2004; Raver & Knitzer, 2002; Shonkoff & Phillips, 2000; Stipek, 2006), there is also evidence that exposure to academic content in kindergarten (and particularly exposure to advanced content) can be beneficial for student learning (Clements & Sarama, 2011; Engel, Claessens, Watts, & Farkas, 2015). An oft-raised concern is that a focus on academic content might crowd out other important types of learning experiences that help develop social and regulation skills or foster physical and mental health, each of which is a predictor of children’s longer-term outcomes.
The Changing Nature of Kindergarten
Historical accounts of kindergarten make it clear that the acute tensions between the academic and more broad developmental goals of kindergarten are not new (Dombkowski, 2001; Russell, 2011). Cuban (1992) details the ebbs and flows of these two competing goals for kindergarten over more than a century. Unfortunately, larger-scale empirical evidence about the changing nature of kindergarten is lacking.
Nevertheless, there is a growing impression among practitioners, researchers, and the media that in the past two decades, preschool and kindergarten classrooms have rapidly become more academically oriented and less focused on exploration, social skill development, and play. A common narrative is that accountability pressures, particularly from the federal No Child Left Behind Act (NCLB), have led to changes in the early grades (Goldstein, 2007; Graue, 2009; Pianta, Cox, & Snow, 2007; Stipek, 2006). Although NCLB did not require testing for children before the third grade, some have argued that the intense pressures that principals and teachers felt about their students’ performance on high-stakes assessments led to an “accountability shovedown” and the “educationalization of early care and education” (Hatch, 2002; Kagan & Kauerz, 2007).
There is some empirical evidence supporting the claim that NCLB, or accountability pressures more broadly, impacted the learning experiences of young children (Russell, 2007). In a qualitative case study of a Texas elementary school, Booher-Jennings (2005) described the intense pressure teachers in the untested early grades (K-2) felt to prepare their students for third-grade assessments and the reduction of recess to 15 minutes per week, despite the concerns of early childhood teachers. In a larger-scaled investigation, Jacob (2005) showed that high-stakes accountability led children in early, untested grades to be “preemptively retained” so that they would not be included in standardized testing. Similarly, several recent studies demonstrate that low-performing teachers in high-stakes grades are disproportionately reassigned to untested early elementary classrooms and that this harms children’s learning (Fuller & Ladd, 2013; Grissom, Kalogrides, & Loeb, 2014).
Although accountability pressures are often the presumed impetus for changes to kindergarten classrooms, other shifts over the past two decades may have also contributed to a heightened focus on more advanced content. Notably, there have been substantial increases in both public and private investments in early childhood education. Between 1990 and 2011, the number of 3- to 5-year olds enrolled in public preschool programs more than doubled from 1.2 million to 2.9 million children (Current Population Survey, 2015). It may be the case that this expanded access to public preschool has meant that incoming kindergarteners today have already had substantial exposure to classroom environments and to learning opportunities in a way that may not have been true two decades ago.
Relatedly, a number of scholarly and popular accounts have documented increases in parental investments in their young children’s learning as well as heightened pressure among some parents to give young children an academic “edge” (Bassok, Lee, Reardon, & Waldfogel, 2015; Bassok & Reardon, 2013; Kornrich & Furstenberg, 2013; Otterman, 2009; Ramey & Ramey, 2010; Reardon, 2011). Recent work by Bassok and Latham (2014) actually documents substantial increases in the early academic skills of incoming kindergarteners. In part, then, it may be that heightened investments in children’s early development, both through expanded access to preschool and through changing home environments, have led to children entering school with higher “readiness” than before and that changes in kindergarten teachers’ beliefs and practices are partially a response to the entering children.
The Current Study
The existing research demonstrates the link between early childhood learning and later life outcomes and suggests that the content and organization of early childhood classrooms meaningfully impacts young children’s learning. Although it is commonly stated that kindergarten classrooms have changed rapidly over the past decades, there is little empirical evidence describing how much these classrooms have changed and along which dimensions. The current study fills these gaps, leveraging two rich, nationally representative data sets to provide a detailed account of how public school kindergarten classrooms have changed. We focus on changes over a dozen years, a relatively short period of time but also a period characterized by heightened accountability through the introduction of NCLB as well as increased investment in early childhood education.
We address three descriptive research questions:
To what extent and along what dimensions has the public school kindergarten experience changed between 1998 and 2010?
Is kindergarten the new first grade? To what extent do kindergarten classrooms in 2010 mirror first-grade classrooms from the late ’90s?
Are changes in the kindergarten experience over this period systematically different in schools serving high proportions of children eligible for free or reduced-priced lunch (FRPL) or children who are non-White?
We hypothesized that relative to kindergarten classrooms in 1998, kindergarten classrooms in 2010 would be more focused on academic instruction and assessment, particularly around literacy and math, which are the tested subjects under NCLB. We also hypothesized that an increased focus on literacy and math would crowd out time spent on other subjects, such as art, music, science, social studies, and physical education (PE). At the same time, we note that over the period we investigated, the percentage of children enrolled in full-day kindergarten rose from 56% to 80% (Bassok, Gibbs, & Latham, 2015). Given this striking increase in the typical number of hours kindergarteners spend in school, another plausible hypothesis would be an across-the-board increase in time devoted to all subjects. To the extent that changes to kindergarten may have been driven by heightened accountability pressures, we expect that kindergarten classrooms in schools that serve the highest percentage of low-income and non-White students, which are also schools most likely to experience accountability pressures, would see the most pronounced changes.
Method
Data
This study leverages data from two kindergarten cohorts of the Early Childhood Longitudinal Study (ECLS-K:1998 and ECLS-K:2011), each of which includes detailed surveys of parents, teachers, and school administrators along with direct child assessments. In both waves of the ECLS-K, kindergarten teachers completed fall and spring surveys (for ECLS-K:1998, see https://nces.ed.gov/ecls/kinderinstruments.asp; for ECLS-K:2011, see https://nces.ed.gov/ecls/instruments2011.asp). Because the bulk of the items on these surveys were identical or very similar across waves, the data allow for a careful comparison of kindergarten classrooms between 1998 and 2010. 1
Both studies employed a multistage probability design to obtain nationally representative samples of students entering kindergarten in their respective years. In this process, schools were first sampled from “primary sampling units” (counties or groups of counties), and students were then sampled from within schools. The 1998 data collection sampled over 21,000 children, and in 2010 over 18,000 students were sampled. 2 We limit our sample to public school teachers, as they are the group most likely impacted by public policies, particularly NCLB and other accountability pressures that arose in the years between our two cohorts. Our final samples include about 2,500 public school kindergarten teachers in 1998 and 2,700 teachers in 2010.
Our focus throughout is on the survey responses of kindergarten teachers. However, because children’s teachers were also surveyed the following year, when the majority of children had proceeded to the first grade, we also compare the responses of first-grade teachers in 1999 and 2011, for which we have samples of approximately 3,350 and 3,850, respectively. This comparison allows us to investigate whether the changes we observe over the 12-year span of our study were particularly pronounced in kindergarten relative to another early elementary grade. In addition, where possible, we compare the responses on kindergarten teachers in 2010 with first-grade teachers in 1999 in order to explicitly examine the question we raise in the paper’s title: Is kindergarten the new first grade? 3
Measures
The detailed ECLS-K teacher surveys allow us to explore changes to public school kindergarten classrooms across five dimensions: (a) teachers’ beliefs about school readiness, (b) curricular focus and time use, (c) classroom materials, (d) pedagogical approach, and (e) assessment practices. Below, we provide a description of the specific items included in each of these categories. Due to the large number of measures considered in the paper, we opted to dichotomize all of the categorical variables considered to simplify the presentation of results. In supplementary online appendices, we show the full distribution of these categorical variables.
School Readiness Beliefs and Kindergarten Expectations
Teachers were asked how strongly they agreed with a number of statements pertaining to school readiness and their expectations for entering kindergarteners (e.g., “Children who begin formal reading and math instruction in preschool will do better in elementary school”; “Most children should learn to read in kindergarten”). They were also asked to rate the importance of a number of skills for students entering kindergarten (e.g., counting to 20, sitting still, being sensitive to other children’s feelings) on a 5-point scale ranging from not important to essential. For each of the belief measures, we report the percentage of teachers who rated each skill as either very important or essential (i.e., a 4 or 5).
Curricular Focus and Time Use
The ECLS-K surveys include a variety of items that allow us to measure changes in curricular focus. First, teachers reported the frequency with which they taught each broad subject area (e.g., reading/language arts, music). In addition to items about aggregated time use, teachers were also asked to describe how often they taught specific skills. For each subject, the skills ranged from fairly simple (e.g., alphabet and letter recognition) to complex (e.g., writing stories with an understandable beginning, middle, and end). We report the percentage of teachers who indicated they taught each broad subject or specific skill daily, at least once a week, and never.
An advantageous feature of the ECLS-K survey for the purpose of this study is that in 1998, teachers could specify that an activity never happened because it is “taught at a higher grade level.” This allows us to describe the extent to which skills that were considered outside the scope of kindergarten by a substantial portion of kindergarten teachers in 1998 are reported as commonplace by kindergarten teachers in 2010.
The ECLS-K surveys also asked teachers questions regarding their coverage of science and social studies topics (e.g., human body, dinosaurs and fossils, important figures in American history). Although in 1998 teachers were asked to report how often they cover each topic, in 2010 teachers were asked only whether the topic was ever covered during the year. We therefore examine changes over time in the likelihood these topics were covered at all during kindergarten.
Classroom Setup and Materials
Kindergarten teachers reported whether their classrooms had 10 specific activity centers, such as a math area with manipulatives, a water or sand table, a science area, an art area, or a dramatic play area. We report the percentage of teachers who indicated they had each activity area in their classroom. Although the same set of questions was not asked of first-grade teachers, those teachers did report the frequency with which their students used a variety of materials, including art materials, musical instruments, costumes, or science equipment. We report changes over time in the percentage of first-grade teachers who indicated they use these materials daily, weekly, or never.
Pedagogical Approach
In addition to measuring what children were taught in kindergarten (content and curricular focus), we also measure how they were taught using three sets of variables. Although the surveys do not specifically ask about time allotted for “play,” our goal was to describe the learning environment and the extent to which children had opportunities to make independent choices about their learning experiences. Teachers were asked to report the amount of time their students spent on “child-selected activities” as well as on “teacher-directed whole-class activities.” We report the percentage of teachers who spent about one hour or more per day on child-selected activities and the percentage that spent 3 hours or more on teacher-directed whole-class activities.
We also examined a set of items about the types of literacy and math activities the teachers use in their classroom. Teachers reported the frequency with which they use 20 literacy and 17 math instructional practices. The items ranged broadly from activities children might do independently at their desk (worksheets or workbooks) to hands-on activities, such as working with measuring spoons, to activities like using music or drama to understand math concepts. We describe changes across each of the pedagogy items included in the survey but particularly highlight changes in time devoted to workbooks, worksheets, and textbooks because critical accounts have often pointed to heavy usage of these materials as potentially harmful for children.
Finally, we describe the percentage of teachers who reported having PE or recess on a daily basis, as these are among the best measures available in the data set to measure how frequently children experience active movement and unstructured play opportunities.
Assessment Practices
The final set of items we present relates to assessment practices. Teachers were asked to indicate how important they consider various factors when evaluating the children in their class. These ranged from “effort” and “cooperativeness with others” to a child’s “performance relative to local, state, or professional standards.” We report the percentage of teacher who considered each of these assessment approaches very important or essential.
In addition, in 2010, kindergarten teachers were asked how frequently they used standardized tests to assess their kindergarteners’ progress. Notably, these items were not included on the 1998 kindergarten survey. However, in 1999, when the majority of the first ECLS-K cohort entered first grade, their teachers were asked the same questions about assessment practices that were later asked in 2010. We compare kindergarten teachers in 2010 with first-grade teachers in 1999 in terms of how often they used standardized assessments.
School and Teacher Characteristics
The ECLS-K data sets include surveys of school administrators collected in the spring of the kindergarten year. Administrators were asked to report the schoolwide percentage of students who were eligible for FRPL as well as the schools’ racial composition. We constructed a variable to indicate that a school was in the top quartile of FRPL-eligible students (i.e., the schools serving the most low-income children) and another to indicate a school was in the top quartile of non-White students (i.e., the lowest percentage of white students). We use these variables to assess whether changes in kindergarten over time differed across schools based on their demographic composition.
As described further below, we explore this question in a logistic regression framework and control for other school and teacher characteristics that may be associated with both the school demographic composition and our outcomes. Most importantly, we account for whether teachers work in a half- or full-day kindergarten classroom. This is a critical covariate because time-use variables differ significantly across these settings and because there has been a substantial shift toward full-day programs over the period examined. To ensure a consistent definition of full-day care across waves, we constructed an indicator set to 1 if the class met for 5 or more hours per day. We also include an indicator for whether each school offers a preschool program, as schools that provide early childhood education programs may have systematically different approaches to their kindergarten curriculum.
To address other potential sources of selection bias, we have measures of school enrollment, class size, urbanicity (city, suburb, rural) and region (Northeast, Midwest, West, South). We also include a set of teacher characteristics. These include teacher experience, modeled as an indicator for whether a teacher is in his or her first 3 years of teaching, indicators for whether the teacher holds an elementary or early childhood credential, and several demographic covariates. Appendix A1 provides descriptive statistics for these school- and teacher-level covariates.
Analytic Plan
To address our first two research questions, we present descriptive statistics highlighting how kindergarten and first-grade teachers’ accounts of their classrooms have changed over a roughly 12-year period. Because all of our measures of the kindergarten outcomes are binary, we run logistic regressions to assess the statistical significance of changes over time. Although the two data sets leveraged in the current study do not track the same teachers or schools, and therefore do not allow us to assess whether individual teachers changed their own practices or beliefs over this time period, we are able to describe the extent to which two kindergarten teaching cohorts resemble one another.
Full-day kindergarten increased substantially over our study period (from 56% to 80%). This is relevant for our analysis because changes we observe in our outcome variables, particularly those related to time use, may in part be driven by the shift toward full-day programs. In other words, students may spend more time on literacy instruction because they spend more time in school. To address this, we run our analyses separately for full- and half-day programs.
We answer our final research question about the relationship between kindergarten teachers’ beliefs and practices and the demographic composition of the school where they teach, by estimating logistic regressions that take the form
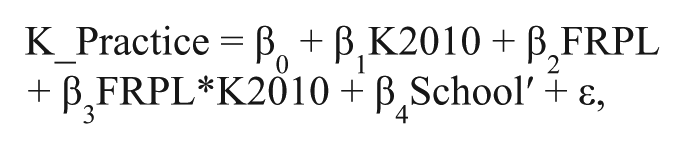
where our outcome (K_Practice) is one of 15 measures of the kindergarten experience, including teachers’ beliefs about school readiness, their classroom setup, and their use of textbooks. K2010 is an indicator variable set to 1 if the responding teacher is part of the 2010 sample and 0 if he or she is from the 1998 sample. FRPL is an indicator for whether a school is in the top quartile of students eligible for FRPL (i.e., the lowest-income schools). We then include the interaction between these two dichotomous variables (cohort and school demographic composition) to examine whether changes were more pronounced in schools serving the highest proportion of children eligible for FRPL (or those with the most non-White children). School′ is a vector of school and teacher covariates as described above. β0 is a constant term and ε is a stochastic error term. We also run analogous models that replace our FRPL variable with an indicator for whether a school was in the top quartile of non-White students.
We present odds for schools, disaggregated by their demographic composition and separately in 1998 and 2010. We then calculate marginal effects and test whether in each time period the expected odds of exposure to a particular kindergarten characteristic differed depending on the school characteristic. Finally, we test whether the gaps across these school types grew (or narrowed) over the period studied by calculating the “difference in differences.” Standard errors are clustered at the school level to account for the nested nature of the data. In all the analysis that follows, we use sampling weights developed as part of the ECLS-K surveys to make the results nationally representative.
Results
Differences in Kindergarten 1998 to 2010
Below, we describe changes in kindergarten classrooms between 1998 and 2010 along our five primary dimensions.
Teacher Beliefs
The top panel of Table 1 shows responses to a number of questions about academic skills and school readiness. We find increases on all of these. Most strikingly, the percentage of kindergarten teachers who report that they agree or strongly agree that children should learn to read in kindergarten increased sharply from 31% to 80%. We also see substantial increases in the percentage of teachers who think parents should teach their children the alphabet before they start kindergarten as well as the percentage who think children should begin formal reading and math instruction before kindergarten (33- and 30-percentage-point increases, respectively).
Kindergarten Teachers’ Beliefs About School Readiness and Kindergarten Learning, 1998 and 2010

Note. Samples limited to kindergarten teachers in public schools. All means are weighted at the teacher level using appropriate sampling weights. Figures shown are percentages rounded to closest percentage point.
p < .05. **p < .01. ***p < .001.
The bottom panel of the table shows the percentage of teachers who believe various school readiness skills are very important or essential for kindergarten. The first thing to note is that in 2010 teachers rated all 13 characteristics as more important than did kindergarten teachers in 1998. However, we document especially pronounced increases in the percentage of teachers who rated academic skills as important for school readiness. For example, the percentage of teachers who reported that knowing the letters of the alphabet was very important or essential more than doubled from 19% in 1998 to 48% in 2010. The percentage of teachers who indicated color and shape identification and counting skills were important rose by 28 and 22 percentage points, respectively. We see smaller increases in the percentage of teachers who rated self-regulation and social skills as very important (approximately 10 to 16 percentage points). The 33-percentage-point increase in the number of teachers who believed it was important to know how to use a pencil or paintbrush stands out. Although this item does not involve specific familiarity with preliteracy or math academic content, it might be considered academic in that using a pencil is prerequisite for more complex writing skills.
It is also worth noting that in both periods, the academic skill items were among the skills rated as least important overall. In other words, although beliefs about the importance of academics have increased more than beliefs in other areas, teachers in both periods report other skills, such as self-regulation and social interaction, as most important at school entry. Overall, then, our results suggest a heightened emphasis on academic skills among kindergarten teachers in the later period but fail to show that teachers now value these skills over and above other school readiness skills.
Curricular Focus and Time Use
The ECLS-K data provide a number of ways to measure changes in curricular focus, including aggregate measures of exposure to broad subject areas (e.g., reading/language arts, music) as well as within-subject content coverage. In this section we describe both.
Overall subject matter exposure
The upper panel of Table 2 presents measures of overall subject matter exposure, showing the percentage of teachers who report daily, weekly, and no exposure to particular subject areas. The top row indicates, for example, that in 1998, nearly all kindergarten teachers (96%) reported teaching reading and language arts daily. Given the ubiquity of literacy instruction in both waves, we are unable to use these particular time use measures to assess whether, on average, literacy instruction has increased over the time period considered, a point we return to in the next section. 4
Frequency of Subject Instruction in Kindergarten and First Grade, 1998 and 2010

Note. Samples limited to kindergarten and first-grade teachers in public schools. Figures shown are percentages rounded to closest percentage point. All figures are weighted at the teacher level using appropriate sampling weights.
p < .05. **p < .01. ***p < .001.
We do observe an increase in the percentage of teachers reporting daily math instruction (from 83% to 91%). We also find that in both periods, teachers report much less frequent instruction in social studies and science than in literacy and math. Approximately a quarter of teachers report daily social studies lessons, and a fifth report that much exposure to science. We do not observe substantial changes in these figures across waves.
Where we do find substantial changes is in time spent on nonacademic subjects, including music, art, dance, theater, and foreign language instruction. In 1998, just over a third of kindergarten teachers reported daily music instruction. This figure dropped by 18 percentage points in 2010, and a similar pattern is evident for art instruction, where the percentage of teachers reporting daily instruction dropped from 27% to 11%. We also document a substantial increase in the likelihood that dance, theater, and foreign language are not taught at all during the kindergarten year. For example, whereas 18% of teachers reported never doing theater activities with their kindergarteners in 1998, in 2010 that figure rose to 50%. Similarly, in 1998 only 11% of teachers reported never teaching dance to their students compared with 37% in 2010. In additional analyses, available upon request, we find that these patterns are quite similar for half-day and full-day kindergarten classrooms.
Curricular coverage
Because in 1998 nearly all teachers already reported regular exposure to all academic topics, and particularly to literacy and math, our crude measures of overall exposure fail to accurately capture changes in exposure to these subject areas over time. For that reason, it is also useful to examine more disaggregated data about the frequency with which teachers cover specific topics within each broader curricular category.
Figure 1 presents changes in time spent on six specific literacy and math topics. We highlight these particular items from among the 14 literacy and 25 math skills included in the survey because they were seen as particularly advanced, where advanced skill is determined based on the percentage of kindergarten teachers in 1998 who reported that the skill was never taught in their classroom because it was covered in a later grade. For instance, in 1998, 44% of teachers reported that they never taught “conventional spelling.” This figure plummeted to 17% in 2010. Relatedly, the percentage of teachers who reported teaching conventional spelling on a daily basis rose sharply from 45% to 76%. The same general patterns hold for the other topics highlighted in the figure, which include composing and writing complete sentences; composing stories with a beginning, a middle, and an end; place value; writing math equations; and probability.

Kindergarten language and math content exposure, 1998 to 2010. “How often are each of these skills taught in your class?” Stars indicate significant differences across years. Weekly = at least once per week. Sentences = composing and writing complete sentences. Stories = composing and writing stories with an understandable beginning, middle, and end. Writing equations = writing math equations to solve word problems.
The top panel of Appendix A2 presents similar figures for all literacy skills included in the survey. Overall, we find sizable increases in nearly all the literacy items included, particularly those that were classified as challenging in the 1998 data (e.g., identifying the main idea and parts of a story, using context clues for comprehension). The only skills for which we observe (modest) declines are relatively basic skills (e.g., alphabet and letter recognition, conventions of print).
The top panel of Appendix A3 shows analogous results for math skills. The same overall pattern holds. For two thirds of the skills included (16 of 25), we find significant increases in the likelihood the skill was covered at least once a week. We see no significant change in the remaining nine skills. Taken together, these findings suggest a heightened focus on literacy and math skills in kindergarten, with particularly pronounced increases in more advanced tasks.
In stark contrast, when we look at exposure to specific science topics, our results suggest a nearly universal drop in exposure. Figure 2 highlights the percentage of teachers who reported particular science topics are taught in their classroom. For instance, whereas over two thirds of kindergarten teachers in 1998 reported they taught children about dinosaurs at some point in the school year, only a third reported doing so in 2010. Appendix A4 shows similar figures for all science and social studies topics included in the survey. We document significant drops for 13 of 15 science topics, and in the bulk of these, we observe a drop of at least 10 percentage points. For social studies, the patterns are more inconsistent and the drops, when observed, are more modest.
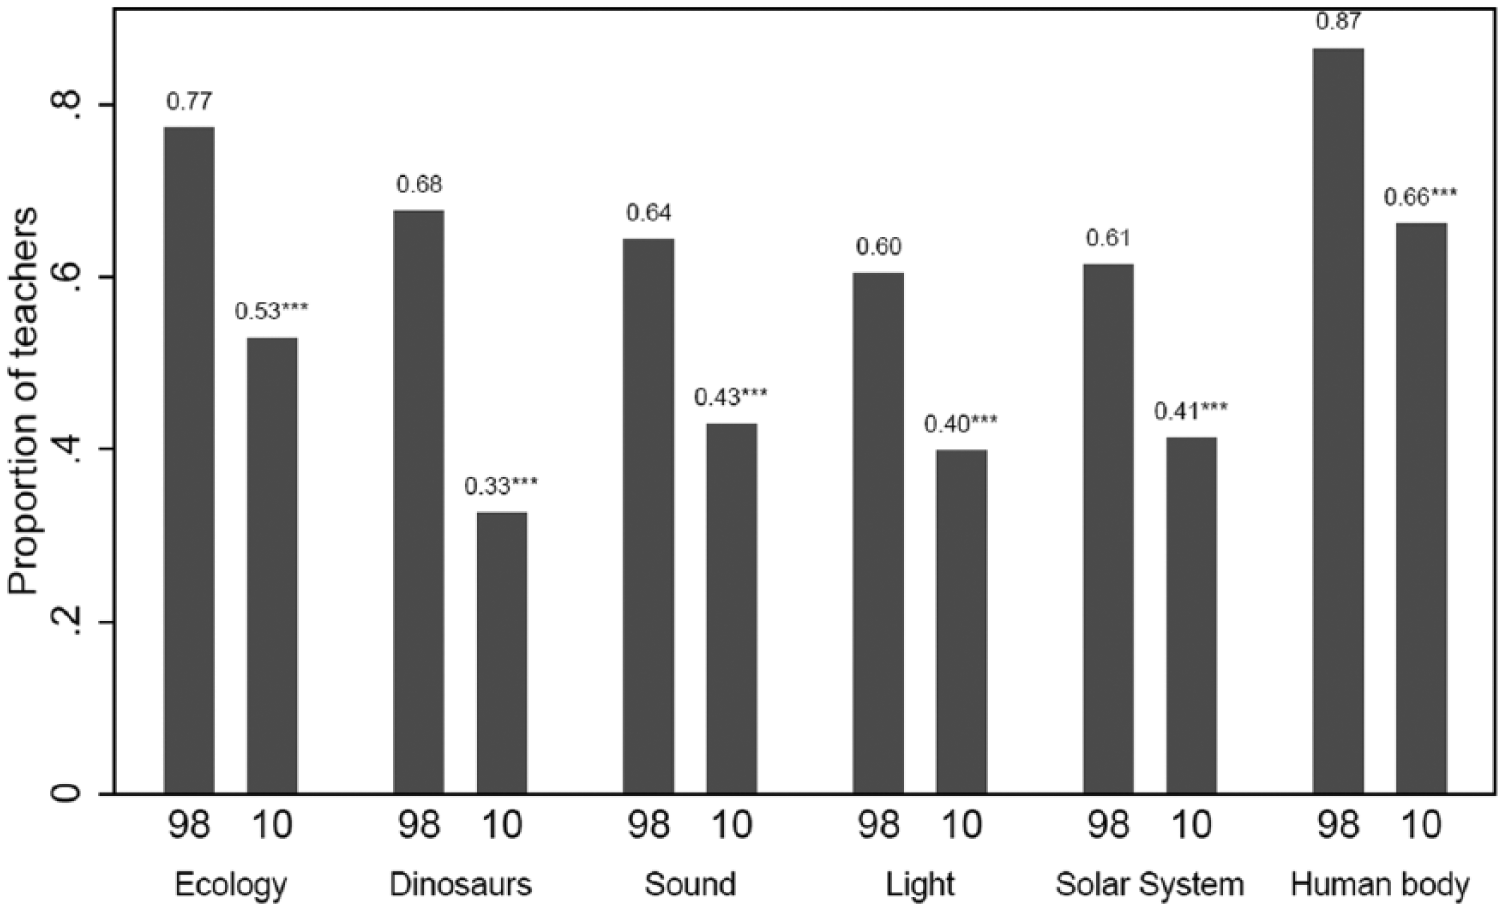
Kindergarten science content exposure, 1998 to 2010. Proportion of teachers that indicate topic is covered in the kindergarten year. Stars indicate significant differences across years.
Classroom Setup
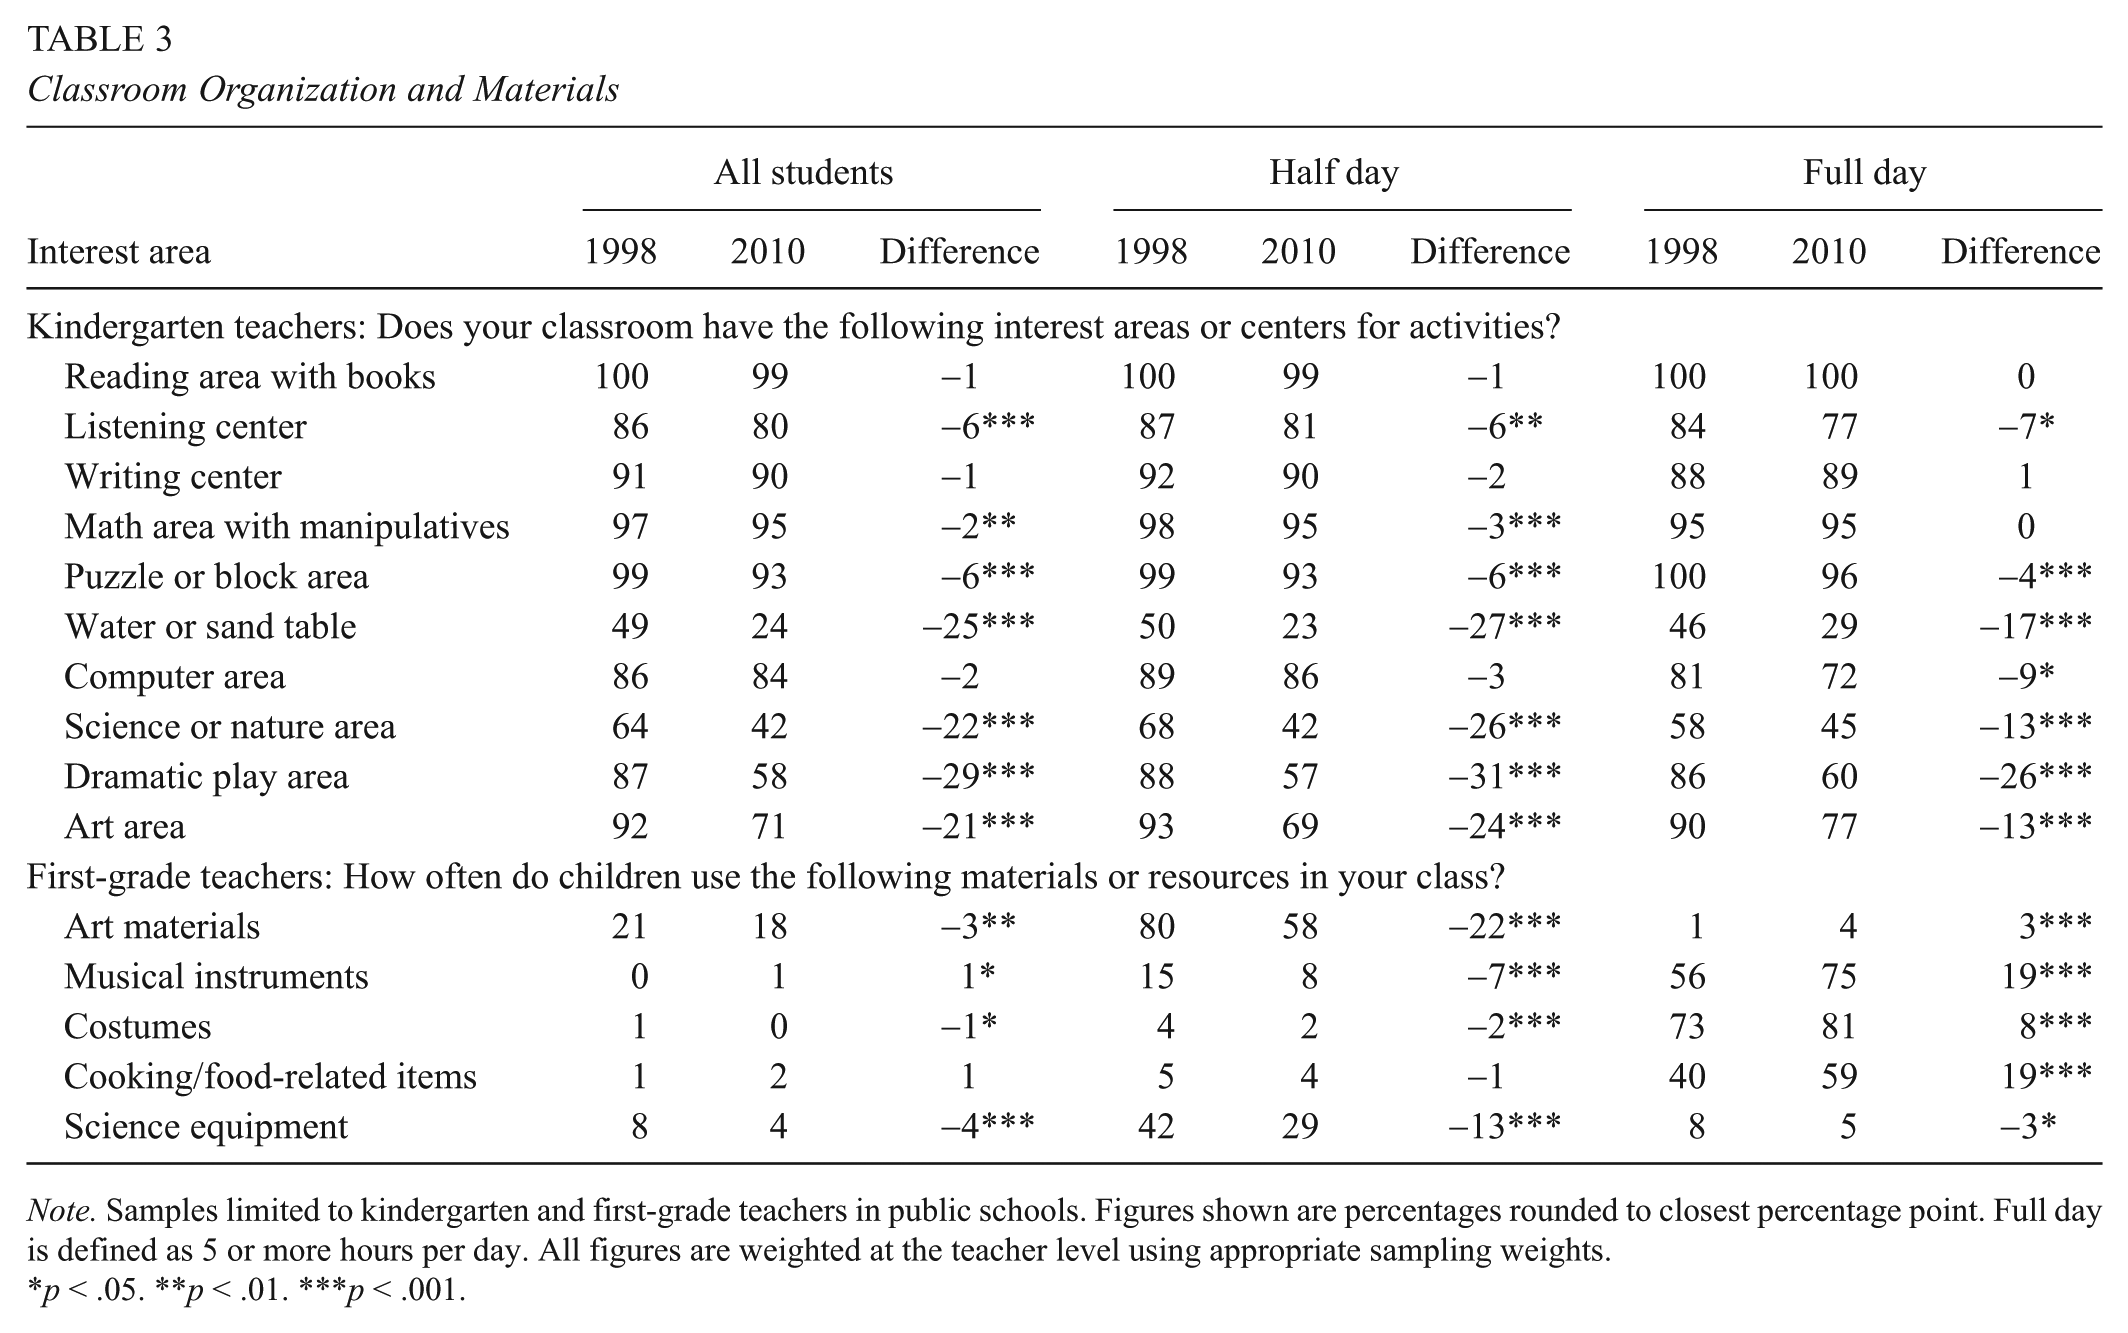
Table 3 presents changes in exposure to particular interest areas. The first four classroom areas shown are the ones most directly linked to literacy and math instruction (e.g., a reading area with books and a math area with manipulatives). All four were very common in 1998, with between 86% and 100% of teachers reporting their classroom included each of these areas. They remained fairly ubiquitous in 2010, although we do observe a 6-percentage-point decrease in the likelihood of offering a listening center.
Classroom Organization and Materials
Note. Samples limited to kindergarten and first-grade teachers in public schools. Figures shown are percentages rounded to closest percentage point. Full day is defined as 5 or more hours per day. All figures are weighted at the teacher level using appropriate sampling weights.
p < .05. **p < .01. ***p < .001.
We do find substantial drops in the likelihood classrooms included centers focused on the arts or on science. For example, whereas nearly all kindergarten teachers reported having an art area in 1998 (92%), in 2010 that figure dropped to 71%. The likelihood of offering a dramatic play area, a science or nature area, or a water or sand table each dropped by over 20 percentage points. Taken together, these results echo our earlier findings about drops in exposure to science and the arts. To the extent that the presence of such classroom interest areas or centers corresponds to a more hands-on or exploratory approach to learning, these findings may also suggest changes over this period in instructional approach.
Pedagogical Approach
We explore this issue more directly in Table 4, which presents changes in the use of child-selected activities, more didactic instructional activities, and opportunities for free play and physical movement. We describe these patterns below.
Kindergarten Teachers’ Reported Approaches to Instruction

Note. Samples limited to kindergarten teachers in public schools. Figures shown are percentages rounded to closest percentage point. All figures are weighted at the teacher level using appropriate sampling weights. Full day is defined as 5 or more hours per day.
p < .05. **p < .01. ***p < .001.
Child-selected activities
The first two measures relate to time spent on child-selected activities and time spent on teacher-directed instruction. In 1998, 54% of kindergarten teachers reported that children in their class typically spent about 1 hour or more per day on child-selected activities. By 2010, this figure dropped to 40%. At the same time, the percentage of teachers reporting that their class spends more than 3 hours daily on whole-class activities more than doubled, from 15% in 1998 to 32% in 2010. When looking only at full-day classrooms, we find the drop in child-selected activities is even more pronounced (a 28-percentage-point decrease).
Didactic instructional activities
The next set of items in Table 4 focuses on the use of worksheets, workbooks, and textbooks in kindergarten classrooms. Daily use of textbooks in kindergarten more than doubled for both reading and math. For instance, only 11% of teachers in 1998 reported using a basal reader daily, compared with 26% of teachers in 2010. We also observe substantial increases in daily use of worksheets, up 17 percentage points for reading and 15 for math. The heightened use of textbooks and worksheets in kindergarten is evident in both half-day and full-day settings.
It is worthwhile to consider these trends within the context of the complete set of items measuring approaches for teaching literacy and math. These are presented in the lower panels Appendix A2 and Appendix A3 and are sorted by the change in the likelihood that a teacher reported a particular approach was used weekly. For literacy, we observe substantial increases across a diverse set of measures, but the largest increases are in the use of textbooks, writing words from dictation to improve spelling, writing stories and reports, and using workbooks and worksheets. We observe drops for only three (of 20) instructional approaches (e.g., a 3-percentage-point drop in the likelihood children practice writing the letters of the alphabet at least once a week, from 98% to 95%).
When examining approaches to math instruction (lower panel of Appendix A3), we find significant increases in eight of 17 of the instructional approaches mentioned. Here, too, the largest increases are in time spent using textbooks and worksheets as well as time spent completing math problems on the chalkboard. That said, teachers also reported increases in less didactic approaches, such as using music to understand math concepts or explaining how problems are solved. Overall, the results are consistent with an increase in time spent on reading and mathematics instruction broadly, with particularly large gains in time spent on rote, didactic tasks.
PE and recess
The bottom panel of Table 4 shows how frequently kindergarteners are exposed to PE and recess. Contrary to the hypothesis that kindergarten classrooms in the later period would have fewer opportunities for play or physical activities, we observe no change in the percentage of students who participated in daily PE and document a 9-percentage-point increase in the percentage of students who had recess daily. We do note drops in PE and recess for children attending half-day programs, although these are not statistically significant.
Assessment
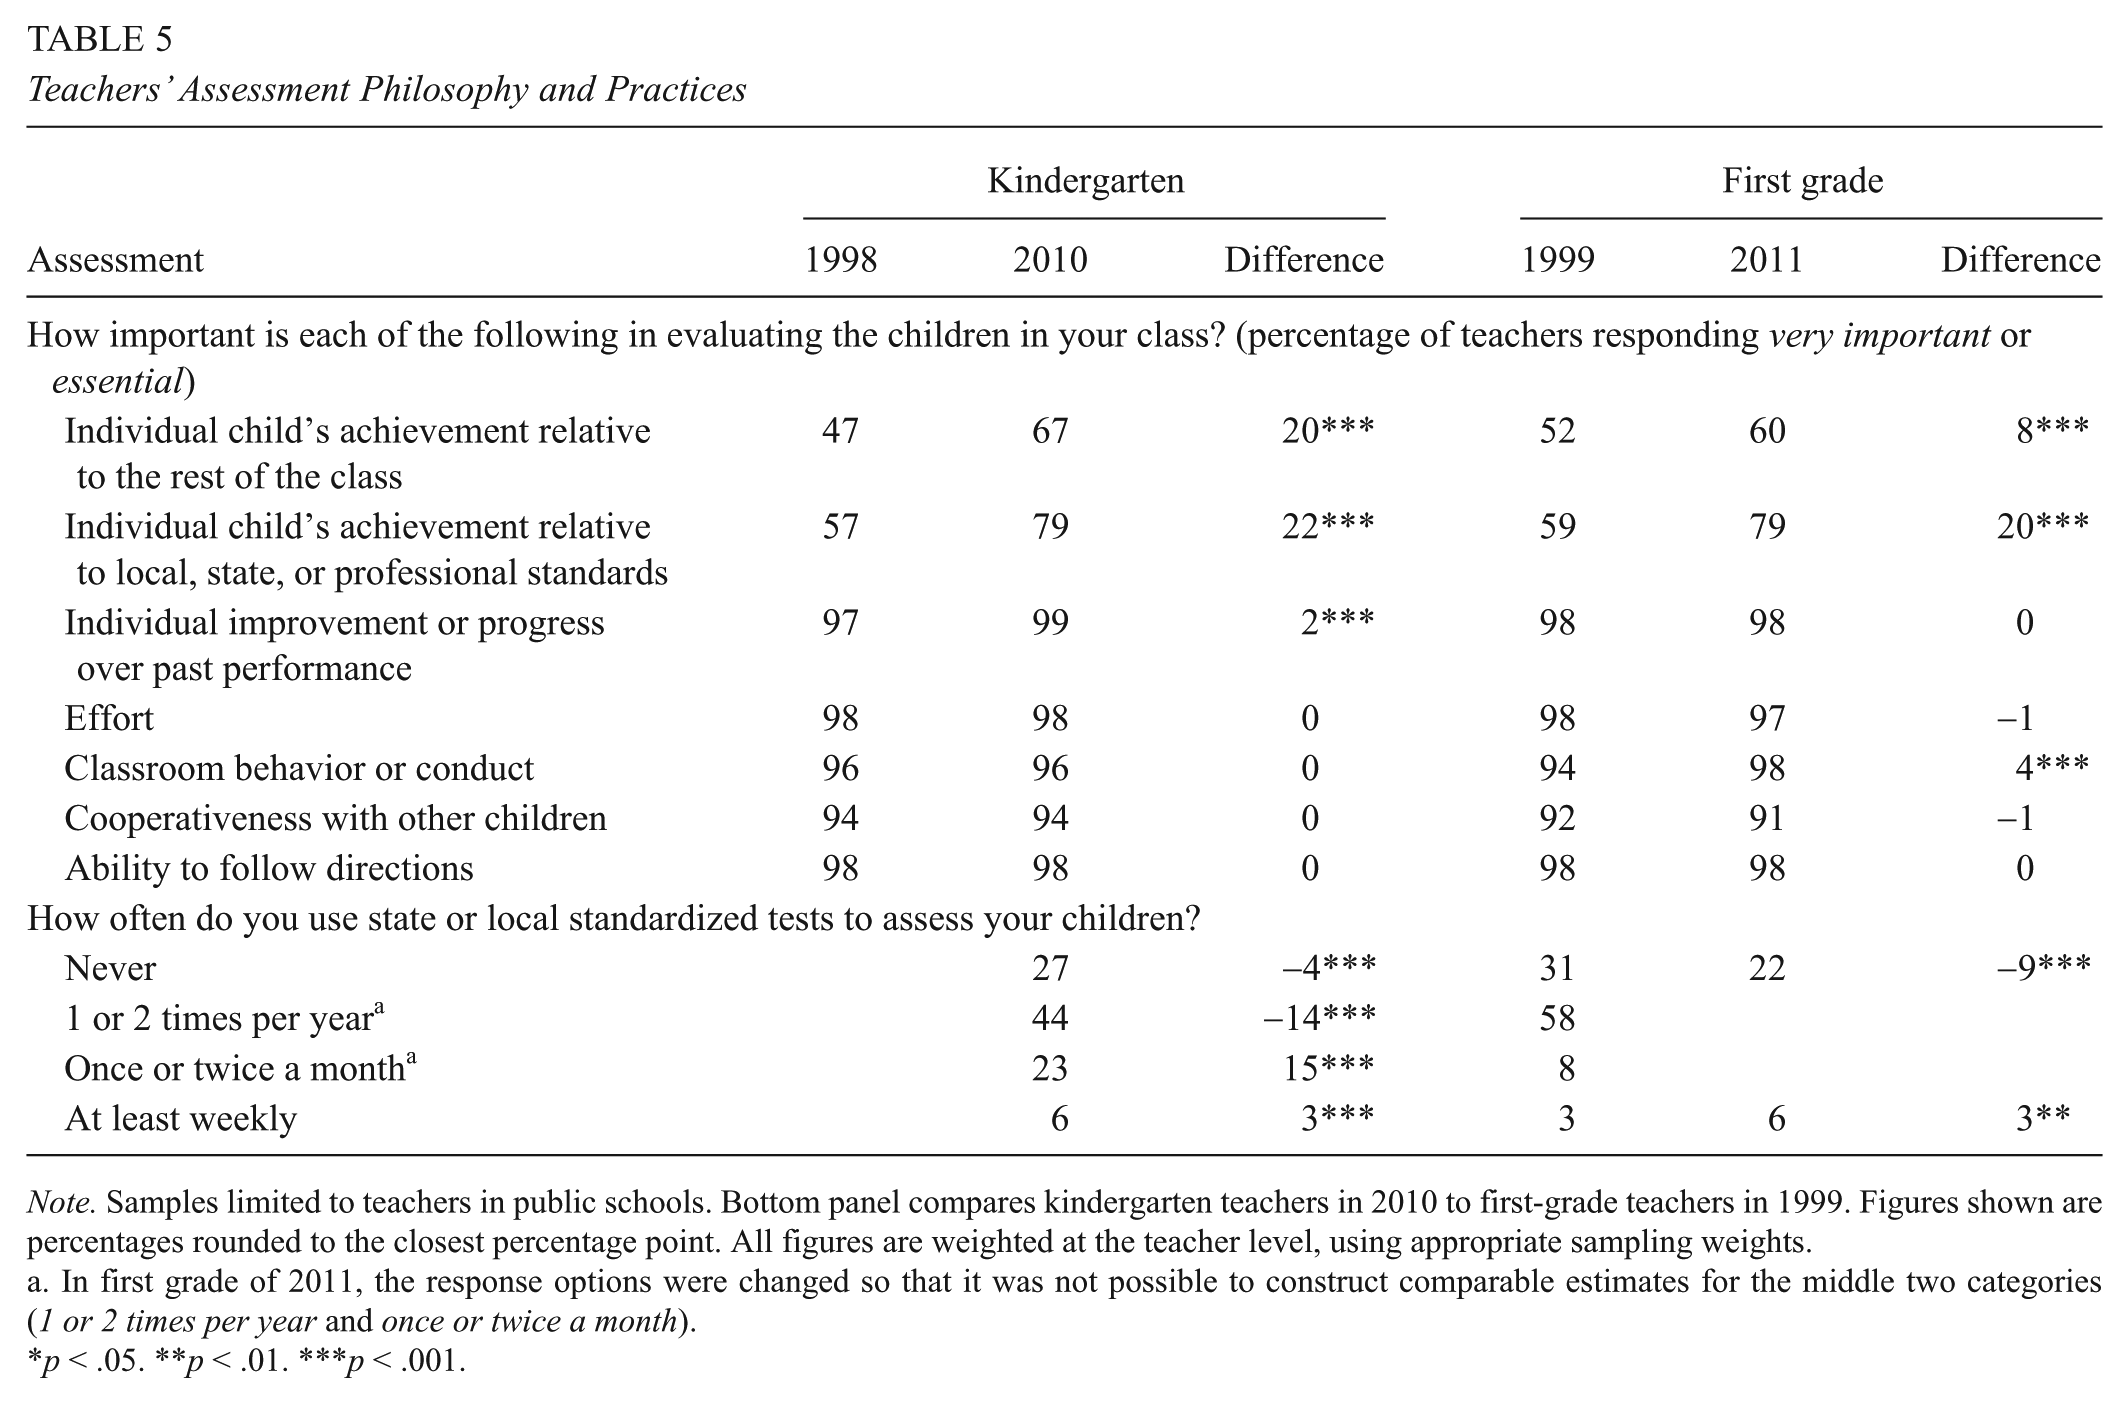
In the top panel of Table 5, we show how kindergarten teachers’ views about assessment have changed over time. In 1998, more than 95% of teachers indicated that they valued children’s improvements over time, their effort, their classroom behavior, and their ability to follow directions. We observe very little change across these measures over time. We do document changes in the importance teachers placed on two factors: First, the percentage of teachers who indicated they consider an individual child’s achievement relative to local, state, or professional standards to be very important or essential rose from 57% to 79%. Second, we see a similar increase in the importance teachers place on children’s performance relative to their classmates, up from 47% to 67%.
Teachers’ Assessment Philosophy and Practices
Note. Samples limited to teachers in public schools. Bottom panel compares kindergarten teachers in 2010 to first-grade teachers in 1999. Figures shown are percentages rounded to the closest percentage point. All figures are weighted at the teacher level, using appropriate sampling weights.
In first grade of 2011, the response options were changed so that it was not possible to construct comparable estimates for the middle two categories (1 or 2 times per year and once or twice a month).
p < .05. **p < .01. ***p < .001.
Is Kindergarten the New First Grade?
Our second research question aims to directly address the question posed in the paper’s title. The recent release of first-grade data for the most recent wave of the ECLS data allows us to examine the extent to which the first-grade experience has changed, comparing responses from first-grade teachers in the 1999-2000 school year and the 2011-2012 school year. We are also able to compare how much kindergarten in 2010 mirrors first grade in 1999.
The bottom panel of Table 2 shows the frequency of subject instruction reported by first-grade teachers across the two cohorts. We begin by comparing kindergarten with first grade only in the 1998 wave. We find large differences between these two grades, especially with respect to time spent on nonacademic subjects. For instance, in 1998, 34% of kindergarten teachers reported daily exposure to music, and 27% reported daily exposure to art. In contrast, among first-grade teachers in 1999, those figures were 7% and 4%, respectively. This suggests that in the late ’90s, kindergarteners were 5 times more likely to experience daily music lessons and nearly 7 times more likely to experience daily art than first graders. Roughly 60% of kindergarten teachers reported teaching dance/creative movement on a weekly basis in 1998, and about 40% reported doing a weekly theater/drama activity. Among first-grade teachers, the rates were far lower (25% and 11%, respectively). Although the differences we describe could, in theory, reflect changes between the 1998 and 1999 school years that applied to both kindergarten and first-grade classrooms, we assume that we are measuring differences in children’s typical learning experiences as they progressed one school year from kindergarten to first grade.
Turning to changes in first-grade teachers’ reports of subject instruction between 1999 and 2011, we find patterns that mirror those observed among kindergarten teachers. In other words, we see smaller (but still significant) drops over time in first-grade teachers reporting daily music or art instruction and increases in teachers reporting they never teach dance, theater, or foreign language.
Similarly, in the bottom panel of Table 3, we show that first-grade teachers reported large drops in the frequency with which their students use materials related to nonacademic instruction. For example, the likelihood a first-grade teacher reported using art materials in his or her classroom on a weekly basis dropped from 80% to 58%, and the likelihood of using science materials weekly dropped from 42% to 29%. Similarly, the likelihood that first-grade teachers reported their students never use musical instruments or cooking materials each increased by 19 percentage points.
Taken together, these findings suggest that in the late ’90s, kindergarten and first-grade classrooms differed in their focus and time use. Since then, both grade levels experienced reductions in time spent on the arts and potentially science as well.
Although kindergarten classrooms did become more similar to first-grade classrooms, kindergarten teachers were still somewhat more likely to have daily social studies instruction and substantially more likely to have daily art and music instruction.
The bottom panel of Table 5 compares the frequency of standardized testing reported by kindergarten teachers in 2010 to that of first-grade teachers in 1999. Recall that in 1998, kindergarten teachers were not asked this question. We find that in 2010, just under 30% of kindergarten teachers report using standardized tests at least once per month. By comparison, only 11% of first-grade teachers in 1999 reported using standardized tests this frequently. On the dimension of standardized test use, our results suggest that kindergarten classrooms in the later period devote considerably more time to standardized tests than first-grade teachers did 11 years earlier.
Differences in Patterns Across Schools
The preceding analyses highlighted substantial changes across nearly all measures examined. To assess whether these patterns of change differed across schools based on their demographic composition, we ran a set of exploratory logistic regressions. Table 6 presents results from these analyses, in which we consider 15 measures that have changed meaningfully between 1998 and 2010 (e.g., beliefs about reading in kindergarten, use of textbooks, time spent on art) and assess whether changes were more pronounced in schools serving higher proportions of children eligible for FRPL or children who are non-White. Results from similar logistic regressions for all measures presented in Tables 1 through 5 are presented in supplementary online appendices. The pattern of those results is largely similar to the pattern described here.
Logit Models Predicting Changes in Teachers’ Beliefs and Assessment Practices 1998 to 2010, by School Demographic Composition Measures

Note. Models include all public school kindergarten teachers and include controls for school characteristics (e.g., total enrollment, urbanicity, region of the country, provision of preschool) as well as teacher characteristics (e.g., gender, race, experience, certification). Sample sizes are between 3,700 and 4,000, rounded to the nearest 50 as per National Center for Education Statistics requirements. FRPL = free or reduced-price lunch.
p < .05. **p < .01. ***p < .001.
We present the odds of each kindergarten outcome for each school type in each period. For instance, the first column examines the likelihood that teachers agree or strongly agree that incoming kindergarteners need to know the alphabet. We see that in 1998, the odds of a teacher holding this belief was .51 among teachers working in schools in the highest quartile with respect to children eligible for FRPL. In schools serving relatively fewer eligible children, the odds are only .34. The statistically significant difference indicates that teachers serving more school lunch-eligible children were more likely to hold this belief.
Above, we already showed that on average, teachers in 2010 were far more likely to hold this belief than their counterparts in 1998. The results here indicate that although these increases were not isolated to those teachers serving the most school lunch-eligible children—we see substantial increases across both groups—they were more pronounced in schools serving the most low-income children. By 2010, the “gap” in this belief for schools serving more low-income children had broadened substantially, from 0.17 to 1.00. Patterns are quite similar when we consider schools based on their racial composition. To summarize, then, the results from this first column indicate that in both periods, teachers working in schools serving more FRPL-eligible or non-White children were significantly more likely to believe alphabet knowledge was critical for incoming kindergarteners. While both groups experienced substantial increases in this belief by 2010, the gap between them had broadened substantially.
It is important to note that our approach to examining interactions is based on the odds ratio metric and that had we used a probability metric, the interaction terms of interest may suggest different patterns (Buis, 2010). As an illustration, the raw probability that a kindergarten teacher indicated that knowing the alphabet was important or very important in 1998 was .33 among teachers working in schools with the most children eligible for FRPL, compared to .27 for schools serving lower percentages of lunch-eligible children. By 2010, the analogous figures were .69 and .60. For this particular outcome, using a probability metric rather than an odds measure still suggests that teachers working in schools serving the most low-income children experienced a larger increase in this outcome over time (.37 versus .33). However, this difference is modest and not statistically significant. Given the potential for a different interpretation depending on metric, we also considered the raw probabilities for all outcomes considered in Table 6 and briefly summarize those trends after presenting the results based on the odds metric.
Turning back to the findings presented in Table 6, we see that the patterns for most variables mirror those described above for alphabet knowledge. In 25 of 30 cases, we find that teachers in schools serving more low-income and more non-White children are more likely to report higher academic expectations, didactic approaches to teaching, and fewer centers for hands-on learning (although these gaps vary in magnitude and are statistically significant for only 16 of 30 cases). By 2010, we observe across-the-board increases in academic beliefs, focus on assessments, classroom structure, and use of didactic instructional approaches. As with the earlier period, teachers in schools serving more low-income and more non-White children are still more likely to hold these beliefs; in all 30 cases, the direction of the difference is consistent with this pattern, and these differences are statistically significant in 21 of 30 cases.
To fully address our research question, we examine whether the changes in the kindergarten experience over this period systematically differed in schools serving high proportions of children eligible for FRPL or children who are non-White. Specifically, we test whether the gaps across schools, which were observed across both periods, broadened or narrowed over time. We do find that gaps broadened substantially with respect to teacher beliefs and textbook use. For instance, the “marginal effect” of being in a school serving a high percentage of FRPL-eligible children with respect to believing most children should learn to read in kindergarten is 0.28 in 1998 but 2.87 in 2010. Marginal effects for daily textbook use for math increased from .04 to .16. In other words, gaps that were already present in 1998 were exacerbated by 2010.
Notably, other gaps, for instance those with respect to having access to particular learning centers (e.g., art area, science area) actually narrowed. For instance, in 1998, kindergarten teachers in schools serving more non-White children were less likely to report their classroom had an art area relative to those teachers serving lower percentages of non-White children. Although this pattern was still present in 2010, the gap had narrowed substantially. The same pattern also emerges for a teacher reporting his or her classroom had a science area. However, even in those cases where we observe narrowing, we still saw across-the-board drops in access to these centers, and we find gaps that suggest schools serving fewer low-income and non-White children are still more likely to offer these types of centers.
Taken together, the results shown in Table 6 show that in 1998, there were significant differences in kindergarten teachers’ beliefs and practices based on schools’ demographic composition, with those schools serving more low-income and non-White children generally reporting a higher focus on academic and didactic instruction. Our findings indicate that the large average changes we document in this paper occurred across the board. In 2010, the differences across school demographics were still present and in many cases were even larger than before, although in a few cases we do also find some narrowing.
As mentioned above, our analysis focuses on the odds ratio metric, which can produce a different pattern of interaction results and indeed does for some of the outcomes considered in Table 6. That said, when we consider changes over time in the raw percentage of teachers reporting each of these beliefs or practices, we still find that teachers in schools serving the most children eligible for FRPL and those serving the most non-White children reported greater increases with respect to textbook use and teacher-directed instruction and also find larger drops in music, art, dramatic play, and so on.
In additional models, available upon request, we also examined whether our findings were sensitive to more flexible regression specifications. These included models in which all covariates were interacted with the indicator for the 2010 cohort, to allow for changes over time in the relationship between school and teacher characteristics and kindergarten classroom characteristics, and models in which we simultaneously considered school poverty and school racial composition. These models all yielded substantively similar results, although larger standard errors led to fewer statistically significant coefficients.
Discussion
This paper is the first to provide nationally representative empirical evidence on the changing nature of public school kindergarten over a period characterized by heightened accountability pressures in elementary schools as well as heightened investments in early childhood education. We consider changes along five broad dimensions and find meaningful shifts across all five. We show that relative to their counterparts in 1998, public school kindergarten teachers in 2010 are far more likely to believe that academic instruction should begin prior to kindergarten entry. They are also more than twice as likely to expect that most children will leave their classrooms knowing to read. We observe a corresponding increase in literacy and math content instruction in kindergarten classrooms, with particularly large increases in time spent on “challenging” topics previously considered outside the scope of kindergarten.
Given the substantial shift toward full-day kindergarten over the period investigated, it was conceivable that we would find increases in time devoted to all subjects. However, this was not the case. We document substantial reductions in time spent on art, music, and science (but not social studies, PE, or recess).
Further, teachers in 2010 were far less likely to indicate that their classroom included various activity centers, including art areas, dramatic play areas, science areas, or water/sand tables. These trends are consistent with the possibility that a heightened focus on literacy and math instruction crowded out coverage of other subjects. Taken together with the drops we document in child-selected activities and the increases in teacher-directed instruction as well as the heightened use of textbooks, workbooks, and worksheets, our results may also suggest important shifts in the pedagogical approaches to kindergarten instruction.
We document striking increases in the use of standardized tests in early elementary classrooms. In 2010, roughly 30% of public school kindergarten teachers reported using standardized tests at least once a month. This is 2.6 times more often than the rate reported by first-grade teachers in 1999. Further, there was a 20-percentage-point increase in both kindergarten and first-grade teachers indicating that they consider children’s performance relative to state or local standards very important or essential.
Overall, our results suggest that public school kindergarten classrooms became increasingly similar in structure and focus to typical first-grade classrooms of the late ’90s but that first-grade classrooms have also shifted away from art, music, and science instruction and increased their emphasis on assessment. We do note that our exploratory analysis of changes to the first-grade teaching practices reflects responses from teachers of kindergarteners who were not retained and may yield somewhat distinct patterns if the first-grade teachers of children retained in kindergarten were also included.
Finally, our findings indicate that although changes to kindergarten classrooms were pervasive, in many cases they were more pronounced among schools serving high percentages of low-income and non-White children, particularly with respect to teacher expectations and didactic instruction.
Implications and Next Steps
It is not yet clear how much the large changes documented in this study have impacted children’s development. Existing evidence is conflicting, with some studies suggesting that a heightened focus on academic instruction will improve children’s learning trajectories and narrow achievement gaps, and others suggesting that a focus on early academic content is unnecessary and potentially harmful.
A number of recent papers show that children’s academic skills during early childhood—particularly their math skills—are the strongest predictors of their later performance on a number of cognitive and noncognitive outcomes (Claessens, Duncan, & Engel, 2009; Claessens & Engel, 2013; Duncan et al., 2007; Watts, Duncan, Siegler, & Davis-Kean, 2014). There is also evidence that exposure to academic content in preschool and kindergarten (particularly, engaging and advanced content) can be beneficial for student learning (Claessens et al., in press; Clements & Sarama, 2011; Engel et al., 2015). Magnuson, Ruhm, and Waldfogel (2007), for example, show that more academically oriented early elementary experiences can help children who did not attend preschool catch up with their peers.
At the same time, studies have also suggested that an early focus on literacy instruction and academic content more broadly has negative consequences (Copple & Bredekamp, 2009; Huffman & Speer, 2000; Marcon, 1999; Stipek, Feiler, Daniels, & Milburn, 1995). Stipek (2006), for example, suggests that a heightened focus on academics may be stressful for children and may negatively impact their motivation, self-confidence, and attitudes toward school. Nobel laureate James Heckman argues that the focus on cognitive and academic skill building in early childhood programs is misplaced and that the long-term benefits of early childhood interventions are driven through their impact on noncognitive social and behavioral skill building (Heckman, Krueger, & Friedman, 2004).
The emergence of the Common Core State Standards, which provide specific content standards for kindergartens in literacy and mathematics, has led to vigorous debates about appropriate instruction in the early grades (Carlsson-Paige, McLaughlin, & Almon, 2015). It is important to point out, as do the researchers embedded in these debates, that engaging literacy and math instruction need not be at odds with “play” and other types of pedagogical approaches considered developmentally appropriate in early childhood (Bassok, Claessens, & Engel, 2014; Clements & Sarama, 2014; Pondiscio, 2015). Indeed, the definition of developmentally appropriate instruction has evolved over time. Increasingly, developmental scientists agree that there are ways to meaningfully engage young children in literacy and math learning and that the effectiveness of such efforts depends on the pedagogical approach, the quality of teaching, and the connection of the instruction to young children’s curiosity (Katz, 2015; Snow & Pizzolongo, 2014).
To summarize, the key contribution of the current study is that it provides careful documentation of very large changes in kindergarten over a relatively short, 12-year period. Our findings suggest a shift toward more challenging (and potentially more engaging) literacy and math content. However, they also highlight a concerning drop in time spent on art, music, science, and child-selected activities, as well as much more frequent use of standardized testing.
Further research is needed, and is currently under way, to understand how much the large changes documented in this study impacted children’s development in both cognitive and social domains during the kindergarten year and beyond. Additional research is also needed to better understand the drivers of these changes, focusing in particular on the heightened role of high-stakes accountability as well as the expanded access to school-based public preschool and changes in home parenting practices. A better understanding of the causes for these changes is critical, as the effects of these changes may depend on the extent to which the changes are driven by pressures to meet heightened accountability requirements in the later grades versus efforts to be responsive to children who are starting kindergarten with more academic exposure and classroom experiences than their counterparts in the late ’90s.
Footnotes
Appendix
First-Grade Teachers’ Assessment Philosophies, Marginal Effects From Logit Models

| Variable | The following is “very important” or “essential” for evaluating students in 1st grade |
||||||
|---|---|---|---|---|---|---|---|
| Achievement relative to class | Achievement relative to state/local standards | Improvement or progress over past performance | Effort | Classroom behavior or conduct | Cooperation with other children | Ability to follow directions | |
| Differential changes by percentage eligible for FRPL | |||||||
| 1998, low % FRPL | 1.10 | 1.28 | 45.48 | 94.17 | 20.40 | 13.20 | 72.60 |
| 1998, high % FRPL | 1.20 | 1.84 | 43.17 | 27.86 | 13.58 | 10.12 | 29.14 |
| Difference in 1998 | 0.10 | 0.56* | -2.31 | -66.31* | -6.83 | -3.08 | -43.46 |
| 2010, low % FRPL | 1.35 | 3.83 | 65.02 | 50.77 | 69.48 | 11.56 | 57.65 |
| 2010, high % FRPL | 1.99 | 4.05 | 57.12 | 33.43 | 32.85 | 7.44 | 29.27 |
| Difference in 2010 | 0.64** | 0.23 | -7.90 | -17.33 | -36.63* | -4.12** | -28.38* |
| Difference in difference (2010 - 1998) | 0.53 | -0.33 | -5.59 | 48.97 | -29.80 | -1.04 | 15.09 |
| Differential changes by percentage non-White | |||||||
| 1998, low % non-White | 0.99 | 1.28 | 50.26 | 65.64 | 17.16 | 11.62 | 51.82 |
| 1998, high % non-White | 1.59 | 1.69 | 46.18 | 120.82 | 36.27 | 18.01 | 72.06 |
| Difference in 1998 | 0.60* | 0.41 | -4.07 | 55.18 | 19.11 | 6.39 | 20.23 |
| 2010, low % non-White | 1.35 | 3.82 | 68.60 | 47.83 | 75.22 | 11.22 | 50.75 |
| 2010, high % non-White | 1.97 | 4.44 | 53.95 | 37.30 | 27.81 | 7.92 | 35.64 |
| Difference in 2010 | 0.62** | 0.62 | -14.65 | -10.53 | -47.41** | -3.29* | -15.11 |
| Difference in difference (2010 - 1998) | 0.02 | 0.21 | -10.57 | -65.72 | -66.52** | -9.69 | -35.34 |
Note. Table presents marginal effects from models that include an indicator for cohort, an indicator for school demographic characteristic, and the interaction of the two. All models also include controls for full-day status, class size, school enrollment, whether a school offers preK, region of the country, urbanicity, and teachers’ gender, race, certification, and experience level. Sample includes all public school kindergarten teachers, and sample sizes are between 3,500 and 3,800, rounded to the nearest 50 as per National Center for Education Statistics requirements. Standard errors are clustered at the school level. FRPL = free or reduced-price lunch.
p < .05. **p < .01. ***p < .001.
Acknowledgements
The authors thank Mimi Engel, William Gormley, Jason Grissom, Susanna Loeb, and Sara Rimm-Kaufman for helpful feedback.
Funding
The author(s) disclosed receipt of the following financial support for the research, authorship, and/or publication of this article: This research was supported by a 2011 grant from the American Educational Research Association, which receives funds for its AERA Grants Program from the National Science Foundation under Grant No. DRL-0941014. Scott Latham was also supported by the Institute of Education Sciences, U.S. Department of Education, through Grant No. R305B090002 to the University of Virginia. Opinions reflect those of the authors and do not necessarily reflect those of the granting agencies.
Notes
Authors
DAPHNA BASSOK is an Assistant Professor of Education and Public Policy at the Curry School of Education, University of Virginia. Her research addresses early childhood education policy, with a particular focus on the impacts of policy interventions on the well-being of low-income children.
SCOTT LATHAM is a doctoral student at the Curry School of Education, University of Virginia. His research focuses on issues of access and quality in early childhood education.
ANNA ROREM is a policy associate at the Weldon Cooper Center for Public Service at the University of Virginia.