
Abstract
Using data from the Educational Longitudinal Study (2002), this study employed latent class analysis (LCA) to explore the relationship between students’ engagement-related dispositions and their behavioral engagement in home, school, and community activities. The primary aim was to identify and describe the engagement characteristics of distinct subpopulations of students. Our higher-order LCA models yielded five subpopulation profiles of students’ social-ecological engagement. In contrast to extant participation-identification models, these new profiles suggested that the relationship between students’ behavioral engagement and their school-related identities and dispositions is nonlinear and nonhomogeneous. This major finding recommends comprehensive school–community improvement models as well as nuanced interventions that are tailor-made to fit the engagement needs and identity-related characteristics of each student subpopulation.
Keywords
R
Although the connection between student engagement and positive educational outcomes is well known, finding ways to improve the engagement of high school students remains a work in progress. For instance, in the United States, an estimated 7,000 students drop out of school each day (National Assessment of Educational Progress, 2009). In the same vein, the probability of graduating from high school in some of the poorest urban school districts in the United States is a coin toss (Balfantz & Byrnes, 2012). What is more, when researchers have analyzed students’ long-term engagement trajectories, a persistent pattern has emerged. Overall, student engagement tends to decline from elementary school to high school (National Research Council & Institute of Medicine, 2004).
As the search continues for more effective ways to engage high school students at school and in the classroom (e.g., Cooper, 2014; Turner, Christensen, Kacker-Cam, Trucano, & Fulmer, 2014), some scholars have widened the lens of their research to include analyses of their engagement during out-of-school time (e.g., Lauer et al., 2006). The idea has been that by studying how engagement “works” during nonschool hours, researchers might come to better understand the conditions that facilitate engagement in classrooms and school overall.
One promising line of this research focuses on high school students and their engagement in school- and community-based extracurricular activities (ECAs). This line of research is promising because the majority of today’s high school students report active engagement in some kind of (after-school) ECA either at school or in the community (Feldman & Matjasko, 2005).
ECAs often attract the engagement of high school students because they provide them with opportunities to develop skills, interests, and social contacts in settings that are often less restrictive than formal classrooms (Larson, 2000). For this reason, some scholars have suggested that ECAs represent important contexts for positive youth development (e.g., Forneris, Camire, & Williamson, 2014). This potential for positive youth development is the most pronounced when ECAs help students develop new skills and competencies, explore their emergent ideas and interests, and forge important social ties with peers and positive adult role models (Lerner et al., 2005).
Beyond their immediate appeal, research indicates that ECA engagement correlates with other important benefits for high school students and the schools they attend. One of these benefits is enhanced student engagement in academic work (Feldman & Matjasko, 2005). Here, research indicates that when ECAs help students develop engagement-relevant skills, such as planning, goal setting, and initiative taking, students may employ those skills to complete their academic work, graduate from high school on time, and successfully pursue postsecondary educational careers (Larson, 2000).
Given the importance attached to student engagement in the current Race to the Top educational policy environment (e.g., M. Lawson & Lawson, 2013), these findings hold special significance. Where research is concerned, they highlight needs for studies that provide theoretical and practical insight into a process that might be called “skill and competency transfer” (e.g., Lave, 1997). Where practice and policy are concerned, they invite data-driven models of engagement that can help educators facilitate this transfer across a broader cross-section of students and schools.
The present study was designed with these needs in mind. The goal was to explore subpopulation differences in how high school students transfer their engagement-related skills and competencies across different activities (e.g., ECAs and academics) and social-ecological contexts (i.e., home, school, and community). In pursuit of this goal, we drew a nationally representative sample of 10th-grade public high school students who participated in the Educational Longitudinal Survey of 2002 (ELS). We then used a particular type of statistical technique called latent class analysis (LCA) to explore a novel conceptual-analytic model for student engagement research. This model depicts student engagement as the intersection between students’ behavioral engagement patterns at home, school, and the community and their thoughts, feelings, and identity beliefs about school (i.e., their engagement dispositions).
In this study, students’ behavioral engagement patterns were analyzed using multiple measures of student experience, such as their school- and community-based ECA engagement, their school conduct patterns (i.e., attendance, suspensions, and class-cutting behaviors), and their home engagement preferences (e.g., their television-watching and homework patterns). Students’ engagement dispositions were modeled using measures of students’ academic motivations and competency beliefs, their affective school attachments, and their aspirations for the future (M. Lawson & Masyn, 2015). LCA was employed to analyze relations among these diverse constructs and indicators and to classify students’ engagement experiences into identifiable subpopulation profiles.
The result of these analyses is a social-ecological view of student engagement. New in one respect, this conceptualization closely mirrors Bronfenbrenner’s (1979) classic ecological systems theory and today’s social-ecological theory (e.g., Fleury & Lee, 2006). It is noteworthy that this view takes researchers, practitioners, and policymakers outside the school to examine how student engagement in external social settings might relate to their engagement in schools and classrooms. For this reason, results from this study are especially relevant for researchers interested in the social ecology of student learning, engagement, and motivation (e.g., Eccles & Roeser, 2011). They are also important for educational leaders and policymakers interested in school improvement models that provide a more expansive, engagement-focused reach into students’ peer, family, and community ecologies (e.g., Walsh et al., 2014).
The ensuing analysis provides the relevant details. We begin by briefly summarizing research that examines student engagement in particular contexts and settings. We then build from these setting-specific works by highlighting studies that offer a more expansive, social-ecological view of student engagement and its attendant processes. Following a discussion of our conceptual-analytic framework, we present our LCA-derived subpopulation profiles of students’ social-ecological engagement. We conclude by offering select implications for enhanced, engagement-focused educational policies and practices.
Literature Review and Conceptual Framework
Academic and School Engagement Research
Much of the extant literature has framed engagement as a meta-construct consisting of emotional, cognitive, and behavioral elements (e.g., Fredricks, Blumenfeld, & Paris, 2004). Most of these studies have examined students’ engagement experiences in classroom settings, that is, their academic engagement (Skinner & Pitzer, 2012). In these studies, emotional engagement typically refers to students’ feelings of identification and belonging to school as well as the level of interest, enjoyment, happiness, boredom, and/or anxiety they experience conducting academic work (e.g., Appleton, Christenson, & Furlong, 2008; Pekrun & Linnenbrink-Garcia, 2012). Cognitive engagement refers to students’ psychological investments in learning tasks (Fredricks et al., 2004), the cognitive effort students exert while studying (Finn & Zimmer, 2012), and the extent to which they persist when academic work becomes difficult (Corno, 1993).
Research on students’ behavioral engagement typically draws on the notion of participation (Fredricks et al., 2004). Some of these studies examine students’ prosocial conduct, such as the amount of time students spend on homework (Finn & Volkl, 1993) and/or the extent to which they comply with school rules (Finn, Folger, & Cox, 1991). Other studies, particularly those in the dropout literature, employ these measures as proxies for student disengagement and disaffection (Skinner & Pitzer, 2012). Here, researchers have found that increases in student absenteeism, class cutting, and suspensions represent key contributing factors for ongoing school difficulty and dropout (Rumberger & Rotermund, 2012).
While students’ academic engagement in classrooms represents the primary unit of analysis for engagement research, some studies have proceeded with a broader view of students’ behavioral engagement experiences. Here, researchers have employed the concept of school engagement as they have examined participation in school-based ECAs, such as interscholastic athletics, student government, school-based music and arts programs, and/or school clubs (e.g., Bohnert, Fredricks, & Randall, 2010).
Overall, researchers have found that students’ school engagement supports important educational outcomes, such as higher grades (Eccles & Barber, 1999) and higher chances of completing high school (Mahoney & Cairns, 1997). Increases in school engagement have also been shown to reduce the prevalence of problem behaviors, such as school suspensions and juvenile delinquency (Bohnert et al., 2010).
Youth Development and Leisure Studies Research
A related category of behavioral engagement research is interdisciplinary. It is located in the youth development and leisure studies literatures. This research emphasizes students’ out-of-school time (OST) and especially family and community settings for youth development. We use the compound term home-community engagement to describe this category of research, with the reminder that it includes a broad range of home- and/or community-based activities.
In this study, two specific types of home-community engagement activities are of particular interest. The first type involves student engagement in relaxed leisure activities, like watching television, playing video games, listening to music, and hanging out with friends. These activities are typically described by researchers as “relaxed” because they are unstructured and do not require much cognitive or psychological effort from students (Eccles & Barber, 1999). This lack of structure has been cited as a key reason why relaxed leisure activities are generally not associated with positive educational or developmental outcomes (Feldman & Matjasko, 2005).
The second type of home-community engagement activity examined by researchers involves constructive leisure activities in the community, such as participating in organized clubs, faith-based groups, sports teams, and civic engagement activities (e.g., Voight & Torney-Purta, 2013). These activities are typically described as “constructive” by researchers because they require students to develop and practice new skills and competencies in settings that are often structured and supervised by adults (e.g., Forneris, Camire, & Williamson, 2014). Perhaps for this reason, research has associated engagement in constructive leisure activities with a host of positive developmental outcomes (Eccles, Barber, Stone, & Hunt, 2003; Larson, 2000). Examples of the outcomes associated with these activities include (a) enhanced student perceptions of their academic and social competence, (b) enhanced student connections to positive role models and peer groups, (c) enhanced caring and compassion toward others, and (d) enhanced student contribution to the welfare of their schools, peers, families, and communities (Lerner et al., 2005).
Although research has not fully articulated the mechanisms that link constructive leisure activities to positive social and educational outcomes, scholars have identified three primary variables that, when properly manipulated, can enhance this important relationship (after Bohnert et al., 2010; Gardner, Roth, & Brooks-Gunn, 2008). These variables are the number of times per week students engage in particular activities (i.e., the frequency of their engagement), the average amount of time they spend at each activity sitting (i.e., the intensity of their engagement), and the number of activities (or activity contexts) they are engaged in at particular points in time (i.e., the breadth of their engagement).
Toward a More Expansive Conceptual Engagement Framework
The preceding review highlights the prized role of engagement as a metaconstruct consisting of affective, cognitive, and behavioral elements. Most of this research has analyzed these elements in classrooms, that is, their academic engagement. However, some behavioral engagement researchers have extended the study of engagement to include a broader range of activities and settings. Research that focuses on students’ school-based ECA experiences can be classified as school engagement. Studies that focus on student experiences in constructive and relaxed leisure activities outside of school can be labeled home-community engagement.
Notwithstanding the important strengths of these setting specific works, our review of the literature reveals two important research needs and opportunities. The first need is to better integrate engagement’s affective, cognitive, and behavioral elements into single research studies. This need is evident because most studies include only one element of engagement in their research designs (Christensen et al., 2012; Fredricks et al., 2004). Studies that examine two or more remain unusual (for exceptions, see Wang & Eccles, 2012; Wang & Peck, 2013).
The second need is to better understand the relationship between students’ academic, school, and home-community engagement experiences. This need is evident because students’ experiences at school, home, and community span their entire social lifeworlds. Consequently, in order for engagement researchers to better attend to the engagement-related strengths, needs, and challenges of the “whole child,” social-ecological studies of engagement are needed (Eccles & Wang, 2012; M. Lawson & Lawson, 2013). In the following sections, we provide the conceptual foundations for one such social-ecological engagement model. This model was derived from four important lines of engagement research.
Engagement as Participation and Identification
The first line of research that informed this study’s conceptualization is Jeremy Finn’s (1989) participation-identification model. In this model, student participation is operationalized as students’ school conduct and classroom compliance, their initiative taking, their ECA engagement, and their participation leadership activities at the school (Finn et al., 1991). Students’ school identification is an affective variable that is measured along two dimensions: (a) students’ perceptions of school belonging and (2) students’ affective valuing of school (e.g., Finn & Zimmer, 2012; Voelkl, 2012).
In Finn’s (1989) work, student participation and identification are depicted as continuous variables that operate in synergy, which is to say that they are expected to increase or decrease in tandem. For example, the more students participate in school, the more they are expected to positively identify with school norms and activities and vice versa.
In contrast, students who do not participate in school activities are expected to develop weaker school attachments and comparatively more limited affiliations with prosocial peers. Over time, these undesirable dynamics have been shown to limit students’ academic performance and eventually reduce their chances of completing high school (see also Ream & Rumberger, 2008).
Engagement and Students’ Identity Development
While Finn’s (1989) participation-identification model depicts engagement as a set of interrelated, continuous measures or variables, some leisure studies scholars have conceptualized engagement as a set of categorical constructs (e.g., Bartko & Eccles, 2003). This categorical view of engagement follows research that suggests that students often interpret their social worlds differently, even when they engage in similar activities, contexts, and settings (e.g., Martin et al., 2015). This important and consistent research finding has contributed to a second line of engagement research, one that focuses on the relationship between students’ school engagement practices and their developing social identities.
The relationship between students’ school engagement and identity beliefs is perhaps best exemplified in Eccles and Barber’s (1999) now-classic “Breakfast Club” study. In this study, Eccles and Barber began by surveying students about their school-based ECA engagement. They then supplemented these analyses by analyzing the relationship between students’ ECA engagement and their identity constructions.
Eccles and Barber (1999) drew characters from the popular 1980s movie The Breakfast Club when they asked students to classify themselves as a “jock,” “princess,” “brain,” “basket case,” or “criminal.” When these character-driven identities were matched with students’ school engagement profiles, Eccles and Barber found that (a) the princesses and jocks were disproportionately engaged in school-based ECAs, (b) the brains were disproportionately engaged in volunteering and faith-based activities, and (c) students who characterized themselves as criminals generally reported low involvement in all manner of school-based ECAs. These findings led Eccles and Barber to conclude that students’ “school-based activity identities” represent a critical mechanism for helping students engage in school and pursue postsecondary educational careers (see also Eckert, 1989).
Person-Centered Engagement Research
A third important line of engagement research takes a broader, “person-centered” view of students’ behavioral engagement. These studies are often described as person centered because they provide an especially holistic view of how student engagement “works” across a diverse array of activities (e.g., ECA engagement, household chores, and work) and social contexts (i.e., home, school, and community).
To facilitate this holistic view, some engagement scholars have analyzed their engagement variables using a particular type of person-centered statistical technique called cluster analysis (e.g., Linver, Roth, & Brooks-Gunn, 2009; Peck, Roeser, Zarrett, & Eccles, 2008). Cluster analysis has been a preferred analytical tool for these engagement researchers because it enables them to identify students who share similar school, home, and community engagement patterns. Researchers then use these engagement patterns or “clusters” to classify students’ behavioral engagement experiences into identifiable subpopulation profile groups (Roeser & Peck, 2003).
For example, Peck et al. (2008) used cluster analysis to model the behavioral engagement profiles of 1,350 African American and White students who participated in the Maryland Adolescent Development in Context study. Their analyses yielded nine distinct profiles of student engagement behaviors at home, school, and the community. Of these profiles, five included engagement in school-based sports activity, another involved student participation (volunteerism and work) in the community but not at school, and another involved engagement in ECAs at school that did not include sports. Their final behavioral engagement cluster was characterized by students who largely stayed at home, read, and watched large amounts of television.
Using a comparable design, Linver et al. (2009) conducted cluster analyses on a nationally representative sample of about 1,700 students ages 10 to 18 from the Child Development Supplement of the Panel Study of Income Dynamics. Their analysis revealed five distinct clusters of behavioral engagement. These five clusters were (a) a “sports” cluster, which was characterized by high sports participation and lower participation in other activities; (b) a “sports plus” cluster, populated by students who participated in multiple activities including sports; (c) a “school groups” cluster, characterized by high rates of participation in school activities and lower participation in other activities; (d) a “religious groups” cluster, whose members participated in faith-based youth groups; and (e) a “low-involved” cluster, whose members manifested low mean levels of participation across all measured activities.
Significantly, additional regression analyses indicated that these behavioral engagement clusters were predictive of variations in students’ connectedness with school (i.e., their emotional engagement). For example, Linver et al. (2009) found that students involved in sports plus other ECAs had school connectedness scores that were nearly half of a standard deviation higher than students who participated in sports alone. They also found that students who were involved exclusively in sports had significantly higher school connectedness scores than students who were not involved in school-based ECAs.
Social-Ecological Engagement Research
A final line of engagement research follows M. Lawson and Lawson’s (2013) recent review of extant engagement research and theory, with particular interest in the social-ecological model of engagement they recommended. This model emphasizes relations between two primary engagement components: (a) students’ behavioral engagement patterns at home, school, and the community and (b) students’ thoughts, feelings, attitudes, and identity beliefs about school (their engagement dispositions). This dual focus on behavioral engagement and engagement dispositions derives from Finn’s (1989) foundational research.
M. Lawson and Lawson’s (2013) broad conceptualization of behavioral engagement included relevant indicators of students’ school, academic, and home-community experiences, and it followed these researchers’ argument that engagement research, policy, and practice needed to become more nuanced and less formulaic. Such a nuanced approach was grounded in twin ideas: (a) Students’ behavioral engagement “works” differently across the social settings for engagement, and (b) in lieu of research focused on a general categorization of “the students,” researchers need to look for situational uniqueness and subpopulation difference. Consistent with these ideas, M. Lawson and Lawson recommended that researchers examine students’ behavioral engagement patterns using person-centered research designs (e.g., Peck et al., 2008).
The second component in M. Lawson and Lawson’s (2013) engagement model is the nascent and perhaps controversial concept of a student engagement disposition (see also Crick, 2012; Crick & Goldspink, 2014; M. Lawson & Masyn, 2015). This disposition construct is derived from Finn’s (1989) work on school identification as well as scholarship that links student engagement to students’ school-based identity constructions (e.g., Eccles & Barber, 1999; Eccles & Roeser, 2011).
As articulated by M. Lawson and Lawson (2013), an engagement disposition develops from interactions between students’ thoughts and feelings about school, their behaviors, and the quality and characteristics of their social environment (see also M. Lawson & Masyn, 2015).
Like the school identification concept (Finn, 1989), an engagement disposition has an affective dimension indicated by students’ school valuing and affective belonging (e.g., Voelkl, 2012). In addition, an engagement disposition includes a cognitive dimension. This cognitive dimension reflects students’ perceptions of “will” and the “skill” they bring to academic learning as well as to the school overall. Together, these two dimensions frame an engagement disposition as a particular kind of school-related identity, one that reflects students’ thoughts and feelings about who they are in school, who they have been, and who they want to become (see also Goldin, Epstein, Shorr, & Warner, 2011; Oyersman, Johnson, & James, 2011).
A final difference between Finn’s (1989) pioneering work and the M. Lawson and Lawson (2013) social-ecological model extends to differences in how their respective primary variables are treated analytically in research designs. These differences are consequential for student engagement research, theory, and practice because they provide researchers, educators, and policymakers with qualitatively different views of the participation-identification relationship. For example, in Finn’s research, student participation and identification are operationalized as continuous variables that are expected to enjoy a linear, synergistic relationship. In contrast, in M. Lawson and Lawson’s model, students’ engagement behaviors and dispositions are conceptualized as categorical constructs whose relationship may not follow a simple line of linear prediction.
Thus, while Finn’s (1989) work facilitates a synergistic view participation-identification relationship, M. Lawson and Lawson’s (2013) model provides researchers with fresh opportunities to explore those factors that might lead some students to participate in but not identify with school as well as those that might lead others to identify with school but not participate. Accordingly, this study was designed to capture the nuance of the participation-identification relationship by way of a person-centered, social-ecological model for student engagement research.
An Emergent Typology of Student Engagement Dispositions
In a previous study, the authors made progress in modeling M. Lawson and Lawson’s (2013) two-component engagement model. This effort began by using a unique kind of person-centered statistical method called LCA to identify different subpopulation profiles of student engagement dispositions. This LCA approach was applied to data drawn from a nationally representative sample of public high school students who participated in the ELS.
In the above-mentioned study, a student engagement disposition was formulated as a categorical concept defined by a discrete typology of student identification (and dis-identification) toward academics and school overall. Guided by M. Lawson and Lawson’s (2013) theoretical framework, these different types (or profiles) of student engagement dispositions were modeled using those ELS survey items that we believed best characterized students’ thoughts, feelings, attitudes, and identity beliefs toward school. As detailed in Appendix A, these ELS survey items measured students’ interest and enjoyment toward academics, their affective school attachments, and their educational and occupational aspirations. Moreover, because interest resided in understanding how students might engage or identify with some aspects of schooling but not others, our LCA models included several indicators of students’ student ambivalence (Priester & Petty, 1996) and dis-identification (Steele, 1997) toward school.
Our LCA of these indicators yielded six characteristically distinct profiles of student engagement dispositions. To assist reader interpretation of these profiles, a graphic depiction of each student engagement disposition is provided in Figure 1. A brief summary of each profile follows.

Profiles of student engagement dispositions.
The first disposition profile yielded from the M. Lawson and Masyn (2015) study was the academic initiative class. Students belonging to the academic initiative class generally enjoyed both math and reading, and they approached their academic work with senses of efficacy, effort, and persistence. The second disposition profile was the academic investment class. In contrast to the more intrinsic forms of academic engagement exhibited by the academic initiative class, academically invested students appeared to engage in school not because they enjoyed it but because they perceived it would yield future educational benefits and occupational rewards.
The third disposition profile was the low-effort/efficacy class. Students in this profile generally did not feel efficacious about their academic work, nor did they put forth their best effort when studying. They also generally did not persist when academic work became difficult. They did, however, believe that they would attend and complete a 4-year college or university.
The fourth disposition profile was the boredom class. Consistent with this moniker, students in this profile did not find school interesting, challenging, or enjoyable even though they generally viewed themselves as efficacious in school. The fifth disposition profile was the ambivalence class. These students were characterized as ambivalent because they appeared generally unsure about their prospects for educational and/or occupational success. For example, fewer than half of these students believed that they would graduate from a 4-year college or university, and only 50% thought it was important to be successful in their future line of work.
The sixth and final disposition profile was the dis-identification class. Students in the dis-identification profile appeared cognitively and affectively detached from their current or future educational pursuits. For instance, they were unlikely to find academic work interesting, challenging, or enjoyable, and they did not think that getting good grades was important. They also had less than a 50% chance of perceiving that their educational careers would advance beyond high school.
The Present Study
The present study examines a novel social-ecological model for student engagement research. This conceptualization depicts student engagement as the intersection between students’ behavioral engagement in academic, school, and home-community settings and their respective dispositions toward school and schooling. Because interest resided in exploring multiple aspects of this engagement model and framework, the analyses were organized to attend to three complementary research objectives.
The first research objective was to analyze the behavioral engagement component of M. Lawson and Lawson’s (2013) social-ecological model. Guided by our review of relevant research, we used LCA to analyze 15 different indicators of students’ behavioral engagement at school, home, and the community. These indicators included measures of engagement in “constructive leisure” activities, like school-based and community-based ECAs, as well as measures of “relaxed leisure” activities at home, such as watching television and playing video games. Moreover, because we were interested in understanding how students might engage with—or disengage from—some activities/settings and not others, we analyzed measures of student attendance, class cutting, and suspensions as indicators of students’ behavioral engagement (see also Wang & Peck, 2013) rather than an outcome or consequence of it (e.g., Eccles & Barber, 1999).
The second research objective of this study was to advance a data-driven view of engagement that could inform the development of more responsive, engagement-focused teaching and learning practices. To assist in the development of these models, we used latent class regression analysis to estimate associations between a vector of student background factors (e.g., student socioeconomic status [SES], ethnicity, and ninth-grade grade point average [GPA]) and students’ behavioral profile membership. The main idea here was to help educators, school leaders, youth development specialists, and policymakers understand the social-demographic characteristics associated with each behavioral engagement profile group.
Our third and final research objective was to analyze relations between the two primary engagement components depicted in M. Lawson and Lawson’s (2013) social-ecological model. To accomplish this objective, we used LCA to model relationships between the behavioral engagement profiles yielded from this present study and the six profiles of student engagement dispositions identified from previous work (i.e., M. Lawson & Masyn, 2015). These analyses yielded the social-ecological profiles of student engagement that represent this study’s primary theoretical and practical contribution to the research literature.
Method
Data Source and Sample
Participants in this study were recruited into the ELS. The ELS is a nationally representative cohort study sponsored by the National Center for Educational Statistics (2004). It includes multiple waves of student data starting in the base year of 2002, when students were high school sophomores, and concluding in 2012, when students were 6 years out of high school.
In the present study, we analyzed restricted data from the first two waves of the ELS data set. Data from the first or “base year” ELS data file were used to estimate our behavioral engagement and engagement disposition profile models. Data collected from the first ELS follow-up study of 2004 (when most of these students were high school seniors) were used to analyze predictors of student membership in each behavioral profile group.
Consistent with our previous analysis on students’ engagement dispositions (M. Lawson & Masyn, 2015), the sample for the present study was delimited to 10th-grade students attending public high schools in the United States who also had follow-up data in 2004. Because the LCA approach employed in this study allows for missing data on measured indicators (no students had missing data on all measured LCA indicators), our LCA models were based on results culled from a sample of 12,760 tenth-grade students attending nearly 600 different public high schools in the United States. 1
Measures
A total of 15 binary and ordinal variables, based on responses to single or multiple items from the ELS survey, were used as observed indicators of the latent typology of students’ behavioral engagement, specified in this study as a categorical latent class variable. Informed by our literature review, these variables—which are referred to as “manifest variables” in LCA—were organized into three conceptual groups. The first conceptual group consists of items that measured student engagement in school-sponsored ECAs, including school sports, school arts, school service, and community service. The second category of manifest variables includes measures of the intensity of students’ behavioral engagement in constructive and relaxed leisure activities at school, home, and the community. The third category of manifest variables, indicators of student conduct, includes ELS items that measured student attendance, suspensions, and class-cutting behaviors. A complete account of these variables can be located in Appendix B. A brief summary of each follows.
Indicators of Engagement in School-Sponsored ECAs
Seven manifest variables were used as indicators of students’ behavioral engagement in school-sponsored ECAs. These ECA variables were coded as dichotomous items because the activity questions in the ELS survey did not allow us to capture the number of ECAs students were engaged in at particular points in time. In light of this limitation, we followed the recommendation of Bohnert et al. (2010) and created dichotomous variables for each school-based ECA. This strategy was employed so that we could model the breadth of students’ school engagement experiences (e.g., sports, arts, and service). Each of these variables was coded 1 if students reported that they were engaged in that particular type of school-sponsored ECA and 0 if they did not.
The first such indicator of school-based ECA breadth was structured interscholastic sports (“sports”). This variable measured whether students engaged in individual or team sports at the school. The second sports-related variable, unstructured school sports (“intramural”), measured whether students were engaged in intramural sports activities at the school. The third variable, school arts (“arts”), measured whether students were engaged in school band, chorus, or a play/musical.
The next four ECA variables were coded to capture student engagement in school-sponsored clubs and related service activities. The first of these variables, school service (“service”) measured whether students were engaged in one or more of the following activities at the school: student government, school yearbook or newspaper, school service clubs, and/or school hobby clubs. The vocational club (“voclub”) variable measured whether students engaged in at least one vocational development opportunities at school, such as job shadowing or professional internships. The academic club (“saclub”) variable measured whether students engaged in at least one academic club at the school, including activities such as participating in the National Honor Society. Finally, the community service (“comserve”) variable measured whether students engaged in school-sponsored civic engagement and service activities in the community.
Indicators of Activity Intensity
Activity intensity refers to the amount of time students devoted to engaging in constructive or relaxed leisure activities during the day or week (Bohnert et al., 2010). Five ordinal variables were utilized to measure the intensity of students’ behavioral engagement in these kinds of activities. The first of these variables captured the intensity of students’ behavioral engagement in school-sponsored ECAs (“ecin”). This ordinal manifest variable was coded 2 if students engaged in school-sponsored ECAs for more than 2 hours a day during the week, 1 if they engaged for 2 or fewer hours a day, and 0 if they reported that they did not participate in school-sponsored ECAs.
The second intensity indicator measured the amount of time students engaged in community-based ECAs (“ost_in”), such as taking language or music classes or engaging in community-based sports teams. Similar to the other remaining indicators of activity intensity, this variable was worded in ELS in a way that captured not only the intensity of student’s community-based ECA engagement but also the extent to which students engaged in these activities at all. For this reason, this ordinal variable was coded 2 if students reported that they engaged in structured community-based constructive leisure activities two or more times per week, 1 if they engaged less than two times per week in OST activity, and 0 if they did not participate at all in structured OST activities.
The third indicator of activity intensity measured the amount of time students spent engaging in relaxed leisure activities during the weekday. For this study, student engagement in relaxed leisure activity was operationalized as the amount of time students spent watching television and playing video games during the weekday (“tv_vid”). This ordinal variable was coded 2 if students reported spending 4 or more hours a day watching television or playing video games, 1 if they spent from 1 to 4 hours a day watching television or playing video games, and 0 if they spent less than an hour a day watching television or playing video games during weekdays.
The fourth measure of activity intensity captured student reports of the amount of time they devoted to their homework (“hw”) each school day. This ordinal variable was coded 2 if students devoted more than 2 hours a day to homework, 1 if they worked on their homework for 1 to 2 hours each day, and 0 if they did not do their homework (or if no homework was assigned).
The final indicator of activity intensity measured the amount of time students spent engaging in reading (“read”) that was not assigned by the school. Although this variable was coded in ELS to accommodate multiple hours of reading activity, few students in the ELS data set reported reading materials that were not assigned by the school. As a consequence, in contrast to the other variables, which were coded to accommodate three response categories, this dichotomous variable was coded 1 if students reported reading for 1 or more hour a day and 0 if they did not.
Indicators of School Conduct
Following the work of Wang and Peck (2013), three measures of student conduct were employed to capture students’ behavioral engagement and disengagement in academics and school overall. The first such variable, student class cutting (“cut”), was coded 2 if a student reported cutting class three or more times during the first quarter/semester of their sophomore year, 1 if they cut class one or two times, and 0 if they did not engage in class-cutting behaviors.
The second conduct indicator analyzed in this study was student absences (“abs”). In order to avoid mistaking mild illness for disengagement, students who reported being absent from school on two or fewer occasions were coded 0. Students who reported three to six absences during the first few months of school were coded 1, and students who reported seven or more absences during the first semester/quarter of the school year were coded 2.
The third and final indicator of student conduct was student suspensions (“susp”). In this study, student suspensions was a composite variable that includes incidents of both in-school and out-of-school suspensions. This variable was coded 2 if students reported that they were suspended three or more times during the first quarter/semester of the school year, 1 for students who were suspended once or twice, and 0 for students who had not been suspended.
Predictors of Behavioral Profile Membership
Four predictor variables were utilized to help identify the social-demographic features of each LCA behavioral profile. The first two variables, students’ SES and students’ ninth-grade GPA in core academic courses, were scaled in ELS as continuous variables. The second two variables, student race/ethnicity (African American, Hispanic, Asian, Other, or White) and gender (male or female), were recoded into dummy variables. White and female students were entered as the reference group for the ethnicity and gender dummies, respectively.
Student Engagement Dispositions
The typology of student engagement disposition was represented as six-category latent class variable based on a previous LCA of the same sampled population (e.g., M. Lawson & Masyn, 2015). These profile classes were labeled (a) academic initiative, (b) academic investment, (c) low-effort/efficacy, (d) boredom, (e) ambivalence, and (f) dis-identification.
Analytic Approach
Our analytic approach was designed to attend to the three primary research objectives that were highlighted at the end of our literature review. In this section, we provide a conceptual overview of the analytic procedures we used to pursue these objectives. A more detailed, technical account of our analytic procedures can be located in Appendices C, D, and E. All analyses for this study were conducted using the software program Mplus 7.3 (Muthén & Muthén, 2014).
First-Stage Analytic Approach: Latent Class Enumeration and Split-Half Cross-Validation
The first objective of this study was to identify different subpopulation profiles of students’ behavioral engagement at home, school, and the community. In order to measure students’ engagement behaviors in these settings as distinct subpopulation profiles, we utilized a particular form of person-centered statistical modeling called LCA.
LCA can be thought of as a type of stochastic, model-based clustering technique. A population model is specified wherein the overall joint distribution of the observed variables (i.e., the latent class indicators) is assumed to be the result of a mixing of two or more unobserved subpopulations, or latent classes, each with its own unique class-specific distribution of the observed indicators (Masyn, 2013). These class-specific distributions are what characterize the typology of a particular phenomenon of interest. The number and nature of the latent classes is unknown at the onset of the analysis—assumed a priori is that the overall population heterogeneity can be represented by a finite number of homogeneous subpopulations. Latent classes are extracted from the data using statistical and substantive criteria based on model-data consistency, relative fit, and substantive utility, interpretability, and distinctness of the resultant classes, as detailed below.
The first step in conducting LCA is to determine the correct or optimal number of latent classes in the data—a process commonly known as latent class enumeration (Masyn, 2013). The latent class enumeration process begins by estimating a LCA model that has one latent class. From there, researchers add successive latent classes until there are no conceptual or empirical improvements in their models (Nylund, Bellmore, Nishina, & Graham, 2007; Van Horn et al., 2008).
As a general rule, researchers typically evaluate the relative empirical fit of their LCA models by comparing the values of the three primary fit indices. These indices are the Bayesian information criterion (BIC), the consistent Akaike information criterion (CAIC), and the approximate weight of evidence criterion (AWE). In each case, the LCA model that yields the smallest value on a given index is judged as best among the models under consideration (Masyn, 2013).
Beyond the fit indices referenced above, the Lo-Mendell-Rubin likelihood ratio test (LMR-LRT) has also been shown to help researchers identify the optimal number of latent classes in their data. For this reason, we used it together with BIC, CAIC, and AWE to guide our latent class enumeration procedure. The LMR-LRT provides a p value for a K-class model versus a (K + 1)-class model, with the first nonsignificant p value indicating a lack of statistically significant improvement in model fit adding another class in the enumeration.
In addition to measures of statistical fit, researchers often evaluate their LCA models by judging the substantive utility of the emergent classes, using two particular statistical parameters of interest: class probabilities and item probabilities. Class probabilities represent the relative size of each latent class—for example, the estimated proportion of the student population who belong to each latent class (Masyn, 2013; Nylund, 2007). Item probabilities represent the probability of endorsing a particular item conditional on class membership (Masyn, 2013). For example, if class k had an estimated item endorsement of .85 for participation in interscholastic sports, then a student belonging to class k would have an estimated probability of .85 of positively endorsing that item. Alternatively stated, 85% of the students in class k would report participating in interscholastic sports. Thus, the class-specific item probabilities can be used to identify responses that typify members of a given latent class. They can also be used to distinguish members of one latent class from another.
Split-half validation
In addition to the metrics highlighted above, our latent class enumeration process was further guided by a split-half cross-validation procedure. This procedure was conducted to gauge the extent to which our profile findings might replicate to an independent data set. In this procedure, we randomly divided our total sample from the ELS data set into two equally sized split halves (see Table 1; Van Horn et al., 2008). From there, we conducted the above-referenced latent class enumeration procedures on the calibration sample (Sample A), evaluating the BIC, CAIC, AWE, and LMR-LRT. Then, we conducted a smaller set of LCA models on the validation sample (Sample B) using the top-fitting models from Sample A. Ultimately, our final latent class solution was the one that yielded results (i.e., item probabilities and class probabilities) that were the most closely replicated across our calibration and validation samples.
Descriptive Comparison of Calibration and Validation Samples

Note. SE = linearized standard error; GPA = grade point average.
Proportion of students who report more than 2 hours of homework per night.
Proportion of students who watch television/video games for 4 or more hours daily.
Proportion of students who were absent three or more times during first semester of 10th grade.
Proportion of students who cut class at least once during first quarter of 10th grade.
Proportion of students who were suspended at least once during first quarter of 10th grade.
Second-Stage Analytic Approach: Analyzing Predictors of Students’ Behavioral Engagement
The second objective of this study was to understand the social-demographic features associated with each behavioral engagement profile. In order to analyze these associations, we fit a series of latent class regression models. Following the procedures documented elsewhere (M. Lawson & Masyn, 2015), we conducted these analyses using 10 imputed data sets of covariates and plausible latent class membership that were estimated using the full ELS data set of 12,760 tenth-grade students. In these models, our LCA-derived profiles of students’ behavioral engagement were specified as a multinomial outcome variable, while variables such as student SES, ethnicity, gender, and ninth-grade GPA were positioned as predictors of behavioral engagement class membership.
Evaluating the results and significance of latent class regression models
One of the challenges of conducting latent class regression analysis stems from the complexity involved in interpreting multinomial logistic regression models. This difficulty is especially pronounced in studies, like this one, where the multinomial outcome variable of interest lacks a conceptually meaningful reference category. In such cases, in order for researchers to explain the meaning and significance of each coefficient yielded from their models, they often have to conduct a series of pairwise tests (e.g., the odds of being in Latent Class 1 versus Class 2 for Black students compared to White students, conditional on membership in Class 1 or 2; the odds of being in Latent Class 1 versus Class 3 for Black students compared to White students, conditional on membership in Class 1 or 3; and so forth). Unfortunately, when the number of multinomial outcomes categories and/or predictors is large, these pairwise analyses can quickly become unwieldy.
Two analytic strategies were employed to address these challenges. First, in order to enhance reader interpretation of our results, we converted the conditional log odds ratios yielded from our latent class regression models into a probability scale. This approach allows readers to compare results between and within outcomes categories using a more user-friendly statistical metric.
Second, in order to evaluate the statistical significance of each multinomial logistic regression coefficient, we conducted a series of “global hypothesis tests.” Essentially, each of these global hypothesis tests evaluates simultaneously whether all of the multinomial logistic regression coefficients associated with a particular predictor are equal to zero. This null hypothesis corresponds to “no association” between the predictor and the multinomial outcome, controlling for all other predictors. Thus, a significant p value translates to statistically significant evidence of an adjusted association between the given predictor and latent class membership.
Third-Stage Analytic Approach: Analyzing Profiles of Students’ “Social-Ecological” Engagement
The third research objective of this study was to explore how different profiles of students’ behavioral engagement related to their engagement dispositions. Using the “three-step” approach to LCA described in Appendix D and elsewhere (e.g., Nylund-Gibson, Grimm, Quirk, & Furlong, 2014), these associations were analyzed in two ways. First, we fit a multinomial logistic regression model where our profiles of student engagement dispositions were specified as a latent multinomial outcome variable with six categories while students’ behavioral engagement profiles were specified as a multinomial predictor variable with seven categories. 2 These analyses were conducted to understand the extent to which students’ behavioral engagement profiles were distributed across all disposition class groups.
Our second set of relational models analyzed the dominant patterns of student engagement that emerged across all of the latent dispositional and behavioral classes. Here, we used a similar three-step LCA method to specify a higher-order model of student engagement. In this approach, our LCA-derived dispositional and behavioral profile variables served as indicators for a higher-order latent class variable that represented our social-ecological profiles of student engagement. A detailed description of the methods used to estimate these higher order LCA models is provided in Appendix E.
Results and Discussion
Identifying Optimal Class Solutions
Results of the class enumeration process for students’ behavioral engagement profiles are provided in Table 2. The models with more than nine classes were not well identified, meaning that they did not converge or they included one or more latent classes that included less than 1% of the student population (a sign of potential overextraction of classes). Moreover, as shown in the table, the identification of the optimal latent class solution for students’ behavioral engagement was not entirely straightforward. Specifically, there was conflicting information across the fit indices. The LMR-LRT indicated no significant improvement in model beyond the six-class solution. The AWE achieved a minimum value at the six-class solution. Last, the BIC and CAIC had the smallest values at the eight-class solution. This ambiguity required us to evaluate the six- through eight-class model solutions with respect to their conceptual merits as much as their empirical fit and replicability across the spilt halves.
Fit Indices for Latent Class Analysis of Students’ Behavioral Engagement (Sample A, n = 6,380)

Note. Boldface type within the table denotes the optimal latent class solution according to each fit index. LL = log likelihood; npar = number of free parameters; BIC = Bayesian information criterion; CAIC = consistent Akaike information criterion (CAIC); AWE = approximate weight of evidence criterion; LMR-LRT = Lo-Mendell-Rubin likelihood ratio test.
Ultimately, we chose the seven-class solution as the best model for classifying students’ behavioral engagement into subpopulation profiles. We chose this model because the eight-class solution did not replicate from the calibration to the validation sample. In addition, the seven-class model included a disaffected behavioral profile that mirrored extant research and theory on behavioral disengagement (e.g., Skinner & Pitzer, 2012). The six-class model did not include a disaffected engagement subtype.
Latent Class Behavioral Profile Findings
For the seven-class model, our split-half cross-validation procedure yielded only slight differences in the corresponding item and class probabilities between our calibration and validation samples. The overall replication of our behavioral profile findings was important because it provided important preliminary support for their measurement validity.
Using the results from our validation sample, Figure 2 presents the conditional item probabilities for each behavioral profile. These conditional item probabilities are provided in seven stacked bar graphs. Each bar graph presents the abbreviated names for each latent class indicator along the x-axis, while the probabilities of endorsing each item are evident along the y-axis. The first seven items in each plot are categorical items that measure student engagement in school-sponsored ECAs (i.e., sports, intramural, arts, service, voclub, saclub, and comserve). These variables have two response categories (0, 1). For these manifest variables, the gray bars indicate the probability of endorsing the second response category (1).

Profiles of students’ behavioral engagement.
The rest of the manifest variables included in our analyses are ordinal items. Seven of these ordinal items have three response categories (0, 1, 2)—only the read variable is coded to include two response categories. For the three-response-category ordinal items (i.e., ecin, ost_in, tv_vid, hw, cut, abs, and susp), the dark regions of the bars depict the probability of endorsing the third response category (2), and the gray-shaded regions depict the probability of endorsing the second response category (1). As noted earlier, the items are grouped according to the subdomains of students’ behavioral engagement identified in the Method section. The corresponding labels for each of these subdomains are noted across the top of the stacked bar groupings.
The Student Athletes
The first behavioral profile culled from our analysis was estimated to represent a quarter of our validation sample (25.1%). It consists of students who participated in both interscholastic and intramural sports at the school as well as structured ECAs in the community. We refer to this behavioral profile as the Student Athletes. This class closely mirrors Linver et al.’s (2009) “sports-only” cluster as well as the “jock” student identity identified in Eccles and Barber’s (1999) Breakfast Club study.
As shown in Figure 2, Student Athletes tend to engage in school- and community-based activities with moderate to high intensity. Nearly 90% of Student Athletes participated in school-based (and mostly sports-oriented) ECAs at least 1 hour per day (ecin), with 50% engaged in school-based ECAs for more than 2 hours per day. In addition, an estimated quarter of Student Athletes engaged in community-based ECAs once a week, while about half of these students engaged in community-based activities at least twice a week (ost_in).
Beyond participation in ECA’s, most Student Athletes (83%) devoted 1 to 2 hours a day to their homework. About half watched television or played video games for 4 or more hours each day. Finally, as evident in Figure 2, students belonging to the Student Athletes profile were unlikely to experience behavioral challenges at school.
When examined holistically, the behavioral patterns of the Student Athletes class reflect a kind of behavioral engagement that can be characterized as concentrated school-community engagement. Here, school-community engagement refers to student tendencies to participate in organized activities at school and in the community. The adjective concentrated describes student tendencies to engage in activities that revolve almost exclusively around sports. By virtue of this kind of behavioral engagement, research suggests that students who belong to the Student Athletes class may gain access to important social resources, opportunities, and networks (peer groups, friends, adults) that they can leverage to enhance their social-academic standing and overall school success (e.g., Fredricks & Eccles, 2006).
The School Engaged Profile
The second behavioral profile yielded from LCA was estimated to represent nearly 20% of our validation sample. We refer to this profile as the School Engaged class because it consists of students who participated in school- and community-based ECAs that did not involve sports. Empirically, this profile appears very similar to the “school groups” cluster first identified by Linver et al. (2009).
As evident in Figure 2, students who belong to the School Engaged behavioral profile appear the most drawn to school-based arts and service activities. Nearly 90% of these students participated in these school-based activities for at least an hour a day. Significantly, about half of these students supplemented their engagement in school-based ECAs with participation in community-based ECAs. However, in contrast to the high-intensity engagement demonstrated by the Student Athletes, students in the School Engaged class generally engaged in these community-based activities less than twice a week.
Beyond their ECA engagement, students in the School Engaged class generally devoted 1 to 2 hours a day to their homework. About 45% of these students watched television or played video games for 4 or more hours a day. Last, as shown in Figure 2, these students were unlikely to experience behavioral difficulty at school.
When viewed in the round, the students’ behavioral patterns of the School Engaged class reflect a kind of behavioral engagement that might be called low-intensity school-community engagement. This kind of engagement reflects the tendency of these students to spend less time participating in ECAs than the other ECA-related behavioral profiles. Readers should remain mindful, however, that the “low-intensity” nature of this engagement may simply represent an artifact of the time requirements needed for school arts and service activities relative to sports and perhaps the logistical challenges of engaging in out-of-school community-based ECAs (Bohnert et al., 2010). The benefits and competencies yielded from these activities may be similar to that of higher-intensity ECAs.
The Multitaskers
The third behavioral profile culled from our analyses was estimated to represent about 10% of our validation sample. It consists of students engaged in a broad range of activities (both sports and nonsports related) at school and in the community. We refer to this group as the Multitaskers. This behavioral profile closely resembles the “sports-plus” cluster yielded by Linver et al.’s (2009) study.
The Multitaskers can be readily identified by the breadth of their behavioral engagement across settings. For instance, about 90% of the Multitaskers engaged in school sports, while 75% engaged in school service clubs. In addition, 45% of the Multitaskers participated in school-sponsored arts activities, and over 50% were engaged in community service. Significantly, the multitaskers generally engaged in these activities with high levels of intensity: Nearly 60% of these students engaged in school-based ECAs for more than 2 hours a day.
In addition to their school engagement, nearly 90% of the Multitaskers reported engagement in community-based ECAs. In fact, 60% of these students participated in community-based ECAs at least twice a week. This finding indicates that the majority of Multitaskers engaged in both school and community-based ECAs with levels of high intensity.
Beyond their engagement in constructive leisure activities at school and in the community, the multitaskers generally devoted 1 to 2 hours each day to homework. Although they were unlikely to read outside of school, they often engaged in fewer hours of relaxed leisure activities than the other behavioral profiles. They were also unlikely to experience behavioral problems at school.
When examined holistically, the behavioral patterns of the Multitaskers reflect a kind of behavioral engagement that might be characterized as high-intensity/high-breadth school-community engagement. Research indicates that the high-intensity/high-breadth nature of this engagement may provide the Multitaskers with a broad range of skills, competencies, and social contacts that can be leveraged for school success (Bohnert et al., 2010; Gardner et al., 2008).
The Troubled Athletes
The fourth behavioral profile was estimated to represent nearly 10% of our validation sample. We refer to this profile as the Troubled Athletes. Students who belong to the Troubled Athletes class had about a 70% chance of cutting class at least once during the first semester of 10th grade, while about 80% of this profile was absent three or more times during the same time period. In addition, nearly a quarter of the Troubled Athletes were suspended three or more times during the first semester of their sophomore year in high school.
Beyond their vulnerability for school difficulty, the Troubled Athletes generally engaged in sports-oriented school- and community-based ECAs. For instance, the vast majority of the Trouble Athletes engaged in interscholastic (84%) and intramural sports (75%) activities at the school. In addition, the Troubled Athletes generally engaged in community-based ECAs with the same estimated intensity as the Student Athletes behavioral profile.
In home settings, nearly 70% of the Troubled Athletes class watched television or play video games for more than 4 hours a day. In addition, while the Troubled Athletes were unlikely to report reading outside of school, they generally devoted 1 to 2 hours a day to their homework.
When viewed together, the behavioral patterns of the Troubled Athletes reflect a kind of engagement that might be categorized as selective school-community engagement with the risk of academic disaffection. The engagement of the Troubled Athletes was “selective” because their overall conduct patterns did not appear to fit very well with the norms, habits, and routines prioritized by their high schools. However, this tendency for behavioral difficulty did not preclude these students from engaging in other formal activities in the school and/or community. For this reason, the social and educational outcome trajectories of the Troubled Athletes may be particularly especially fluid when compared to other behavioral profiles. Some of these students may present ongoing risks for school difficulty, while others may leverage their ECA engagement to help them stay in school, graduate, and pursue postsecondary careers (e.g., Mahoney, 2000).
The Homebodies
The fifth behavioral profile culled from our analysis was estimated to represent 11% of our validation sample. This behavioral profile consists of students with unusually high chances of engaging in academically and educationally relevant activities in home settings. In light of this key engagement-related feature, we refer to this profile as the Homebodies.
As shown in Figure 2, nearly 95% of the Homebodies engaged in homework activity for 2 or more hours a day—which was the highest among all seven behavioral profile groups. In addition, while the Homebodies had exceptionally high chances (98%) of watching television or playing video games for 4 or more hours each day, nearly all of these students read material that was not assigned by the school. This characteristic was significant because the Homebodies were the only student subpopulation that reported consistent engagement in reading as a (constructive) leisure activity.
When viewed together, the academically oriented behaviors of the Homebodies behavioral profile reflect a kind of behavioral engagement that might be characterized as high-intensity academic engagement. At first glance, these students appear to represent the most likely candidates to have engagement dispositions characterized by academic enjoyment, interest, and efficacy. They also appear the best positioned to experience academic success.
The Non-Involved
The sixth behavioral profile was estimated to represent nearly 20% of our validation sample. It consists of students who generally did not report engagement in school- or community-based ECAs. We refer to this behavioral profile as the Non-Involved. Empirically, this group closely mirrors the “low-involved” cluster identified in the Linver et al. (2009) study.
As shown in Figure 2, Non-Involved students generally engaged in the same breadth activities as the homebodies (watching TV, playing video games, and doing their homework), although they generally did so with less intensity. Non-Involved students were also similar to the homebodies in that they presented low risk for conduct problems at the school.
In light of these engagement-related characteristics, the behavioral patterns exhibited by Non-Involved students appear to reflect a kind of behavioral engagement that might be characterized as low-intensity academic engagement. This low-intensity academic engagement was characterized by these students’ tendencies to devote at least an hour each day to academic work as well as their overall lack of conduct problems at the school. At the same time, the more limited breadth and intensity of their school engagement were noteworthy, especially since these students represent a considerable portion of the American (public) high school population.
The Disaffected
The seventh behavioral profile was estimated to represent 5.3% of our validation sample. We refer to this class as the Disaffected because it included students with significant histories of behavioral challenges at school. Conceptually, this profile closely resembles Eccles and Barber’s (1999) “criminals” identity.
As shown in Figure 2, students who belong to the Disaffected profile generally did not engage in school-based ECAs. However, nearly half of these students reported engagement in community-based ECAs. Beyond ECA engagement, nearly two thirds of students in the Disaffected profile watched television or play video games for 4 or more hours a day. About 30% of these students did not engage in homework activity.
Last and most significantly, these students were especially vulnerable to experiencing behavioral problems at school. For instance, students in the Disaffected profile had nearly a 90% chance of cutting class at least once, while an estimated 56% of this class reported skipping class three or more times in the first quarter/semester of their sophomore year in high school. In addition, 56% of Disaffected students reported that they missed school seven or more times during the first quarter/semester of their 10th-grade year, while nearly 40% were suspended three or more times during the same time period.
When viewed in the round, the behavioral difficulties experienced by the Disaffected appear to reflect a kind of behavioral engagement that can be characterized as high-intensity behavioral disengagement from school. This behavioral disengagement is notable because of its known relationship to early school leaving and overall school failure (e.g., Henry, Knight, & Thornberry, 2012; Rumberger & Rotermund, 2012). At the same time, the community-based activities reported by these students should not be ignored. Because more than 50% of these students play nonschool sports, take sports lessons, and/or take music, arts, or language lessons in the community, they should be viewed as possessing competencies that can be leveraged to promote their school engagement and academic success.
Student Background Factors and Behavioral Profile Membership
In this section, we present the results of a multinomial logistic regression of students’ behavioral engagement on their ninth-grade GPA, SES, race/ethnicity, and gender. These results are provided in Table 3. As noted earlier, these results are provided using the model-estimated class proportions for each predictor’s critical values (adjusted for the other predictors) rather than individual regression coefficients (i.e., conditional log odds ratios). Readers should be mindful that because these analyses were conducted using imputed data sets involving the full ELS sample of public high school students (N = 12,760), the estimated proportion of students belonging to each behavioral profile differs slightly from the results reported above. These “revised” estimates can be found at the top of each column in the table. Results from our Wald tests of parameter constraints can be located in Table 4.
Estimated Probability of Behavioral Profile Membership by Student Background Characteristics (N = 12,760)

Note. SES = socioeconomic status; GPA = grade point average.
Wald Test of Parameter Constraints

Note. SES = socioeconomic status; GPA = grade point average.
Ethnicity and Behavioral Profile Membership
The top set of results in Table 3 present the model-estimated probability for behavior class membership by student ethnicity, controlling for gender, SES, and students’ ninth-grade GPA. These analyses show that African American and Hispanic students were unlikely to experience behavioral difficulty when they were engaged in school- and community-based ECAs, all else equal (e.g., Feldman & Matjasko, 2005). They also show that African American and Hispanic students were among the most likely candidates to experience behavioral difficulty when they were not engaged in formal ECAs at school.
Meanwhile, White students had the highest relative chances of belonging to the Multitaskers behavioral profile. This finding indicates that White students may not only be especially well positioned (and coached) to take advantage of those opportunities; they may also live in school communities where those opportunities are the most present (Sharkey, 2009).
Finally, our findings painted an alternative portrait of the behavioral engagement patterns of Asian students, a portrait that runs counter to a conventional stereotype. Although this stereotype might prompt the assumption that Asian students would be highly represented in a behavioral profile characterized by high-intensity academic engagement, our models provide a different picture. In fact, Asian students had the lowest chances of belonging to the behavioral profile that best fit those behavioral patterns (i.e., the Homebodies). Moreover, these same Asian students had the highest combined chances of belonging to a behavioral profile characterized by ECA-oriented school engagement.
Gender and Behavioral Profile Membership
The second set of results provided in Table 3 present the model-estimated probabilities of behavioral profile membership by student gender, controlling different students’ ethnicities, SES, and students’ ninth-grade GPA. As evident in Table 3, these models revealed important gender differences in the Student Athletes, School Engaged, and Multitaskers profiles. For instance, males had higher chances than females of belonging to the Student Athletes profile (31.5% to 23.6%). In contrast, females had higher chances of belonging to the School Engaged (21.9% to 14.2%) and Multitaskers (16.4% to 9.2% to) profile groups. More broadly, males were only slightly more likely than females (18% vs. 14%) to belong to a behavioral profile group characterized by school conduct problems (i.e., the Troubled Athletes and Disaffected profiles).
Student SES and Behavioral Profile Membership
The third set of results in Table 3 present the model-estimated probabilities of membership in behavioral engagement profiles by discrete levels of students’ socioeconomic standing, adjusting for student ethnicity, gender, and students’ ninth-grade GPA. As evident in Table 3, the influence of SES varied among the different behavioral profiles culled from our analyses. Although student SES was used as a continuous predictor of behavioral engagement class membership in the model, the practical importance of this association is most evident when the class distribution is viewed at these discrete SES levels.
For instance, students who were in the 5th percentile of SES had more than a 50% chance of belonging to the Homebodies profile group, all else equal. However, once students’ SES standing increased beyond the 5th percentile, the model estimated chance of belonging to the Homebodies profile decreased precipitously, such that students in the 50th SES percentile were estimated to have only a 2% chance of belonging to that activity group, all else equal. At first glance, this finding was both striking and unexpected; we did not anticipate that the behavioral profile characterized by the most robust academic engagement (i.e., the Homebodies) would be disproportionately represented by the most economically poor students attending public high schools in the United States.
In addition to the Homebodies, there was other evidence that suggests that students’ behavioral engagement patterns may be stratified by SES. Specifically, as shown in Table 3, our model indicated that students in the 5th percentile of the SES distribution enjoyed only a 22% chance of belonging to the Student Athletes, School Engaged, or Multitaskers profile groups, ceteris paribus. However, when students reached the 25th percentile of the SES distribution, they had nearly a 62.5% chance of belonging to one of these groups. Significantly, this chanced increased to 75% for students in the top quartile of SES.
Finally, while student SES represented an important predictor for membership in the Student Athletes, School Engaged, and Multitaskers profiles, it was notable that it was not a strong predictor for behavioral difficulty at school, all else equal. Specifically, although the chance of belonging to the Disaffected behavioral profile was the smallest for students from the wealthiest families, the probability of belonging to the Troubled Athletes class was relatively constant for students with SES values that fell between the 10th and 75th percentiles of the SES distribution. These findings indicate that SES is associated with enhanced opportunities for ECA engagement. It does not appear strongly associated with behavioral disaffection when student gender, ethnicity, and prior academic performance are controlled in the statistical model.
Prior Academic History and Behavioral Profile Membership
The final set of results in Table 3 present the model-estimated probabilities of behavioral profile membership by discrete levels of student ninth-grade GPA in core academic subjects, adjusting for student ethnicity, gender, and SES. Similar to SES, GPA was used as a continuous predictor of behavioral engagement class membership in the model, but we present the class distribution at meaningful points on the GPA scale. As shown in Table 3, our models supported a generally positive relationship between ninth-grade GPA and membership in the Student Athletes, Multitaskers, and School Engaged behavioral profiles. In contrast, our models yielded an inverse relationship between ninth-grade GPA and belonging to the Troubled Athletes, Homebodies, Non-Involved, and Disaffected behavioral profiles, all else equal. Specifically, students who received a 1.0 GPA in ninth grade were estimated to have nearly a 30% chance of belonging to the Troubled Athletes or Disaffected profile groups, all else equal. Meanwhile, students who earned a 4.0 GPA in ninth grade were estimated to have only a 3% chance of belonging to these behavioral profiles. Thus, students who perform well academically had virtually no chance of belonging to those behavioral profile groups characterized by moderate-to-severe behavioral challenges at school, all else equal.
While low prior academic performance was associated with elevated risk of membership in profiles characterized by later conduct challenges, low prior academic performance was also associated with membership in profiles that did not include engagement in school-based ECAs. Specifically, students with a 1.0 GPA in ninth grade were estimated to have a nearly 34% chance of belonging to the Homebodies or Non-Involved profiles compared to the 13% chance of their 4.0-GPA peers.
Profiles of Students’ Social-Ecological Engagement
The next statistical model analyzed intersections (i.e., the joint distribution) of students’ dispositional and behavioral engagement profiles. The results of this analysis are presented graphically in Figure 3 as a stacked bar graph. In this figure, student membership in each of the seven behavioral profile groups is represented along the x-axis. The y-axis then depicts the conditional probability of belonging to student engagement disposition class k given membership in behavioral profile j. The results are further summarized in Table 5, showing the model-estimated joint and conditional probabilities of dispositional and behavioral profiles.
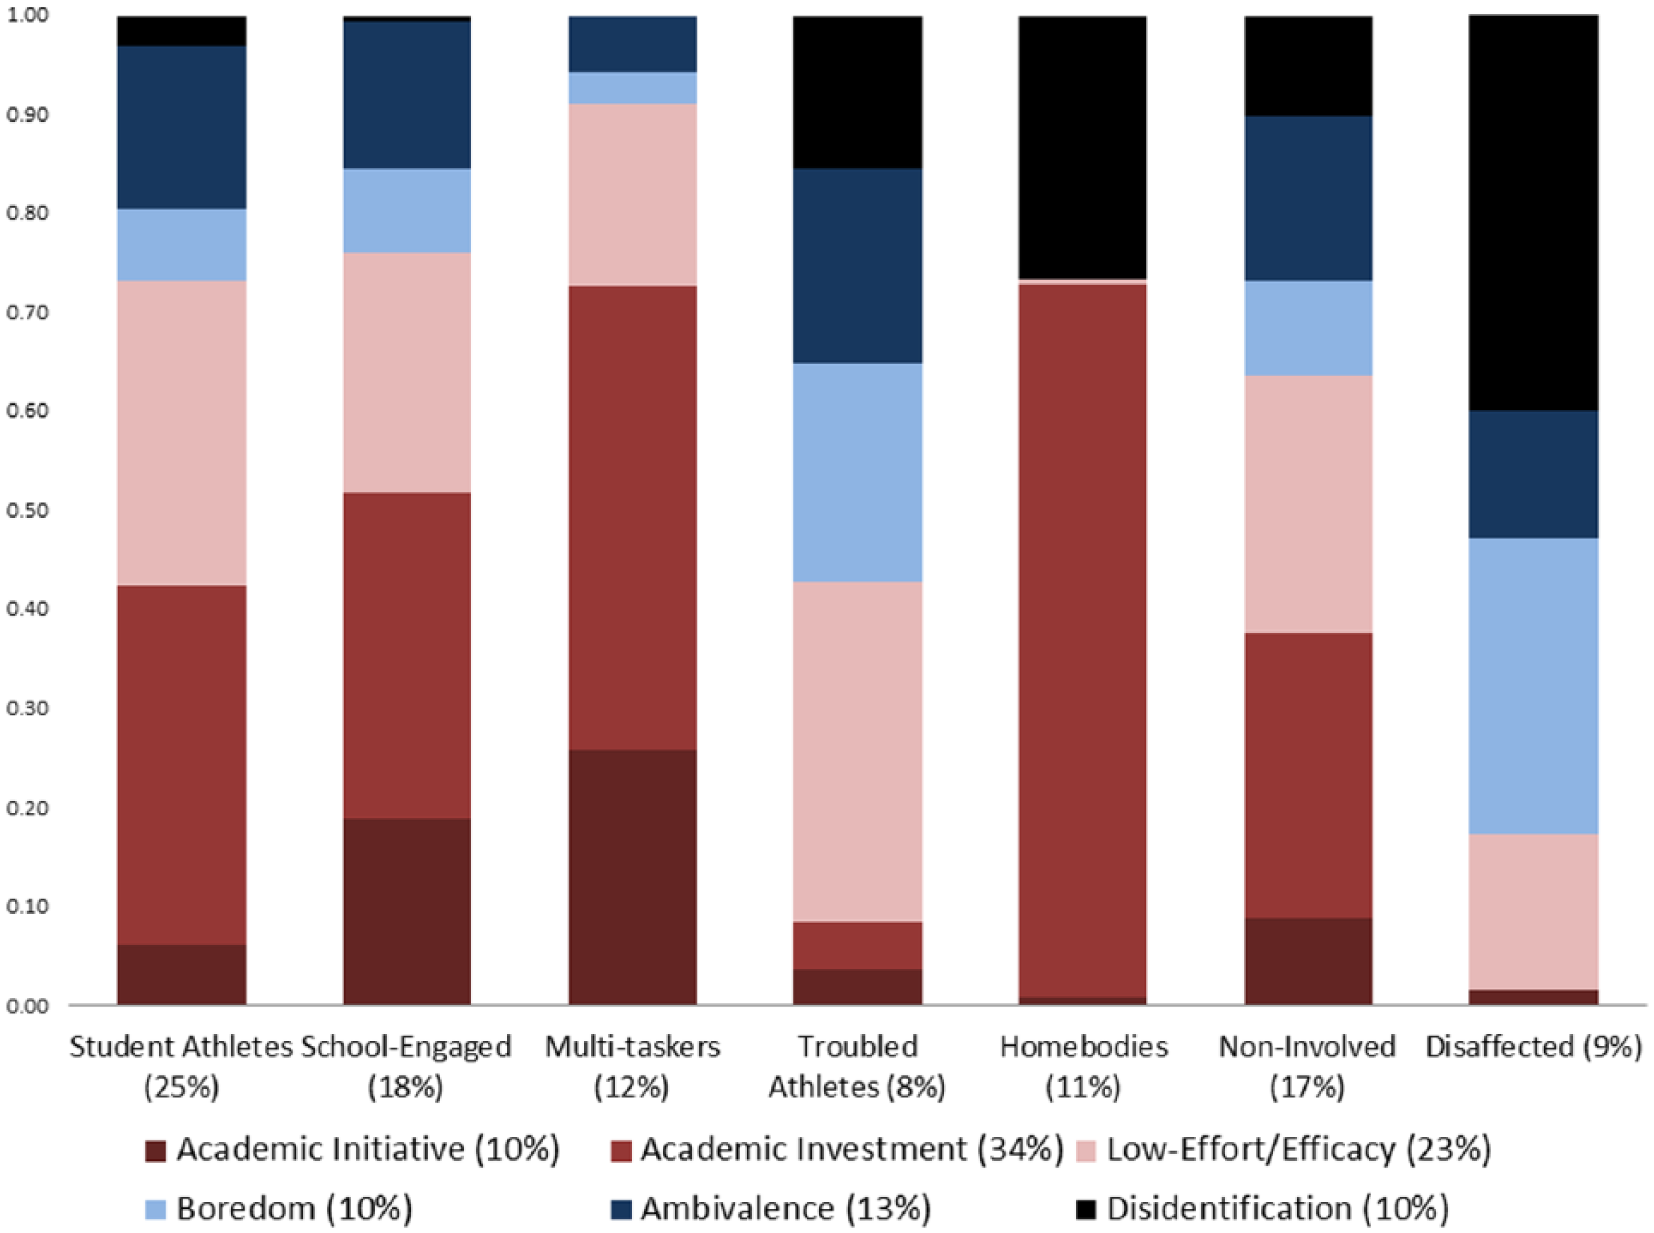
Relational profiles of students’ social-ecological engagement.
Model-Estimated Intersection of Disposition Profile Membership (CED) and Behavioral Profile Membership (CEB): Joint Distribution (Cell %), CED Conditional on CEB (Column %), and CEB Conditional on CED (Row %), in Percentages (N = 12,760)

Note. Percentages less than 0.5 are not printed.
Overall, this “relational” profile model yielded two significant research findings. The first such finding pertained to the sheer diversity of students’ engagement experiences. Specifically, out of the 42 possible behavior-by-disposition profile intersections that were analyzed in this model, 31 had model-estimated joint probabilities greater than 0.5% (see Table 5, “Cell %”). This finding was noteworthy because it provides an important empirical reminder that students’ behaviors represent only one component of their engagement; their thoughts, feelings, and identity beliefs also stand as important, characteristic features of their engagement and overall school experiences.
The second finding that can be derived from this relational model pertains to the dispositional patterns that were evident within each behavioral profile (see Table 5, “Column %”). Here, our results indicated that students who were engaged in ECAs and did not get in trouble at school (i.e., Student Athletes, School Engaged, and Multitaskers) often had the most optimal dispositions toward school and schooling (i.e., they often belonged to the academic initiative or investment classes). Moreover, as shown at the top of Figure 3, these students were also the least likely candidates to have engagement dispositions characterized by ambivalence and dis-identification. In fact, in these models, students who belonged to the School Engaged and Multitaskers profiles had virtually no chance of dis-identifying with school.
In contrast, as indicated by the blue and black shaded bars in Figure 3, students in the Troubled Athletes, Homebodies, Non-Involved, and Disaffected profiles had the highest combined chances of belonging to those disposition groups characterized by ambivalence, boredom, or academic dis-identification (Finn, 1989; Skinner & Pitzer, 2012). Moreover, with the notable exception of the Homebodies, students in these behavioral groups had relatively low chances of belonging to either the academic initiative or academic investment disposition profile groups. This finding was important because it indicated that an overall lack of engagement in constructive leisure activities can limit students’ academic engagement and overall school identification.
Examining Students’ Social-Ecological Engagement as a Higher-Order Construct
Although the joint distribution of dispositional and behavioral profiles provided in Table 5 and Figure 3 provide an important, fine-grained view of students’ overall engagement experiences, their endemic complexity makes them less than useful for intervention planning and policy development. Therefore, in order to provide a more parsimonious view of students’ social-ecological engagement, we explored an alternative measurement specification. In this approach, we fit an LCA model that specified our behavioral and disposition profiles as indicators of a higher-order latent construct that we labeled students’ social-ecological engagement.
As detailed in Appendix E, five characteristically distinct profiles of students’ social-ecological engagement were yielded from this higher-order LCA approach. A graphic depiction of these profiles is provided along a panel of bar graphs in Figure 4. A brief summary follows.
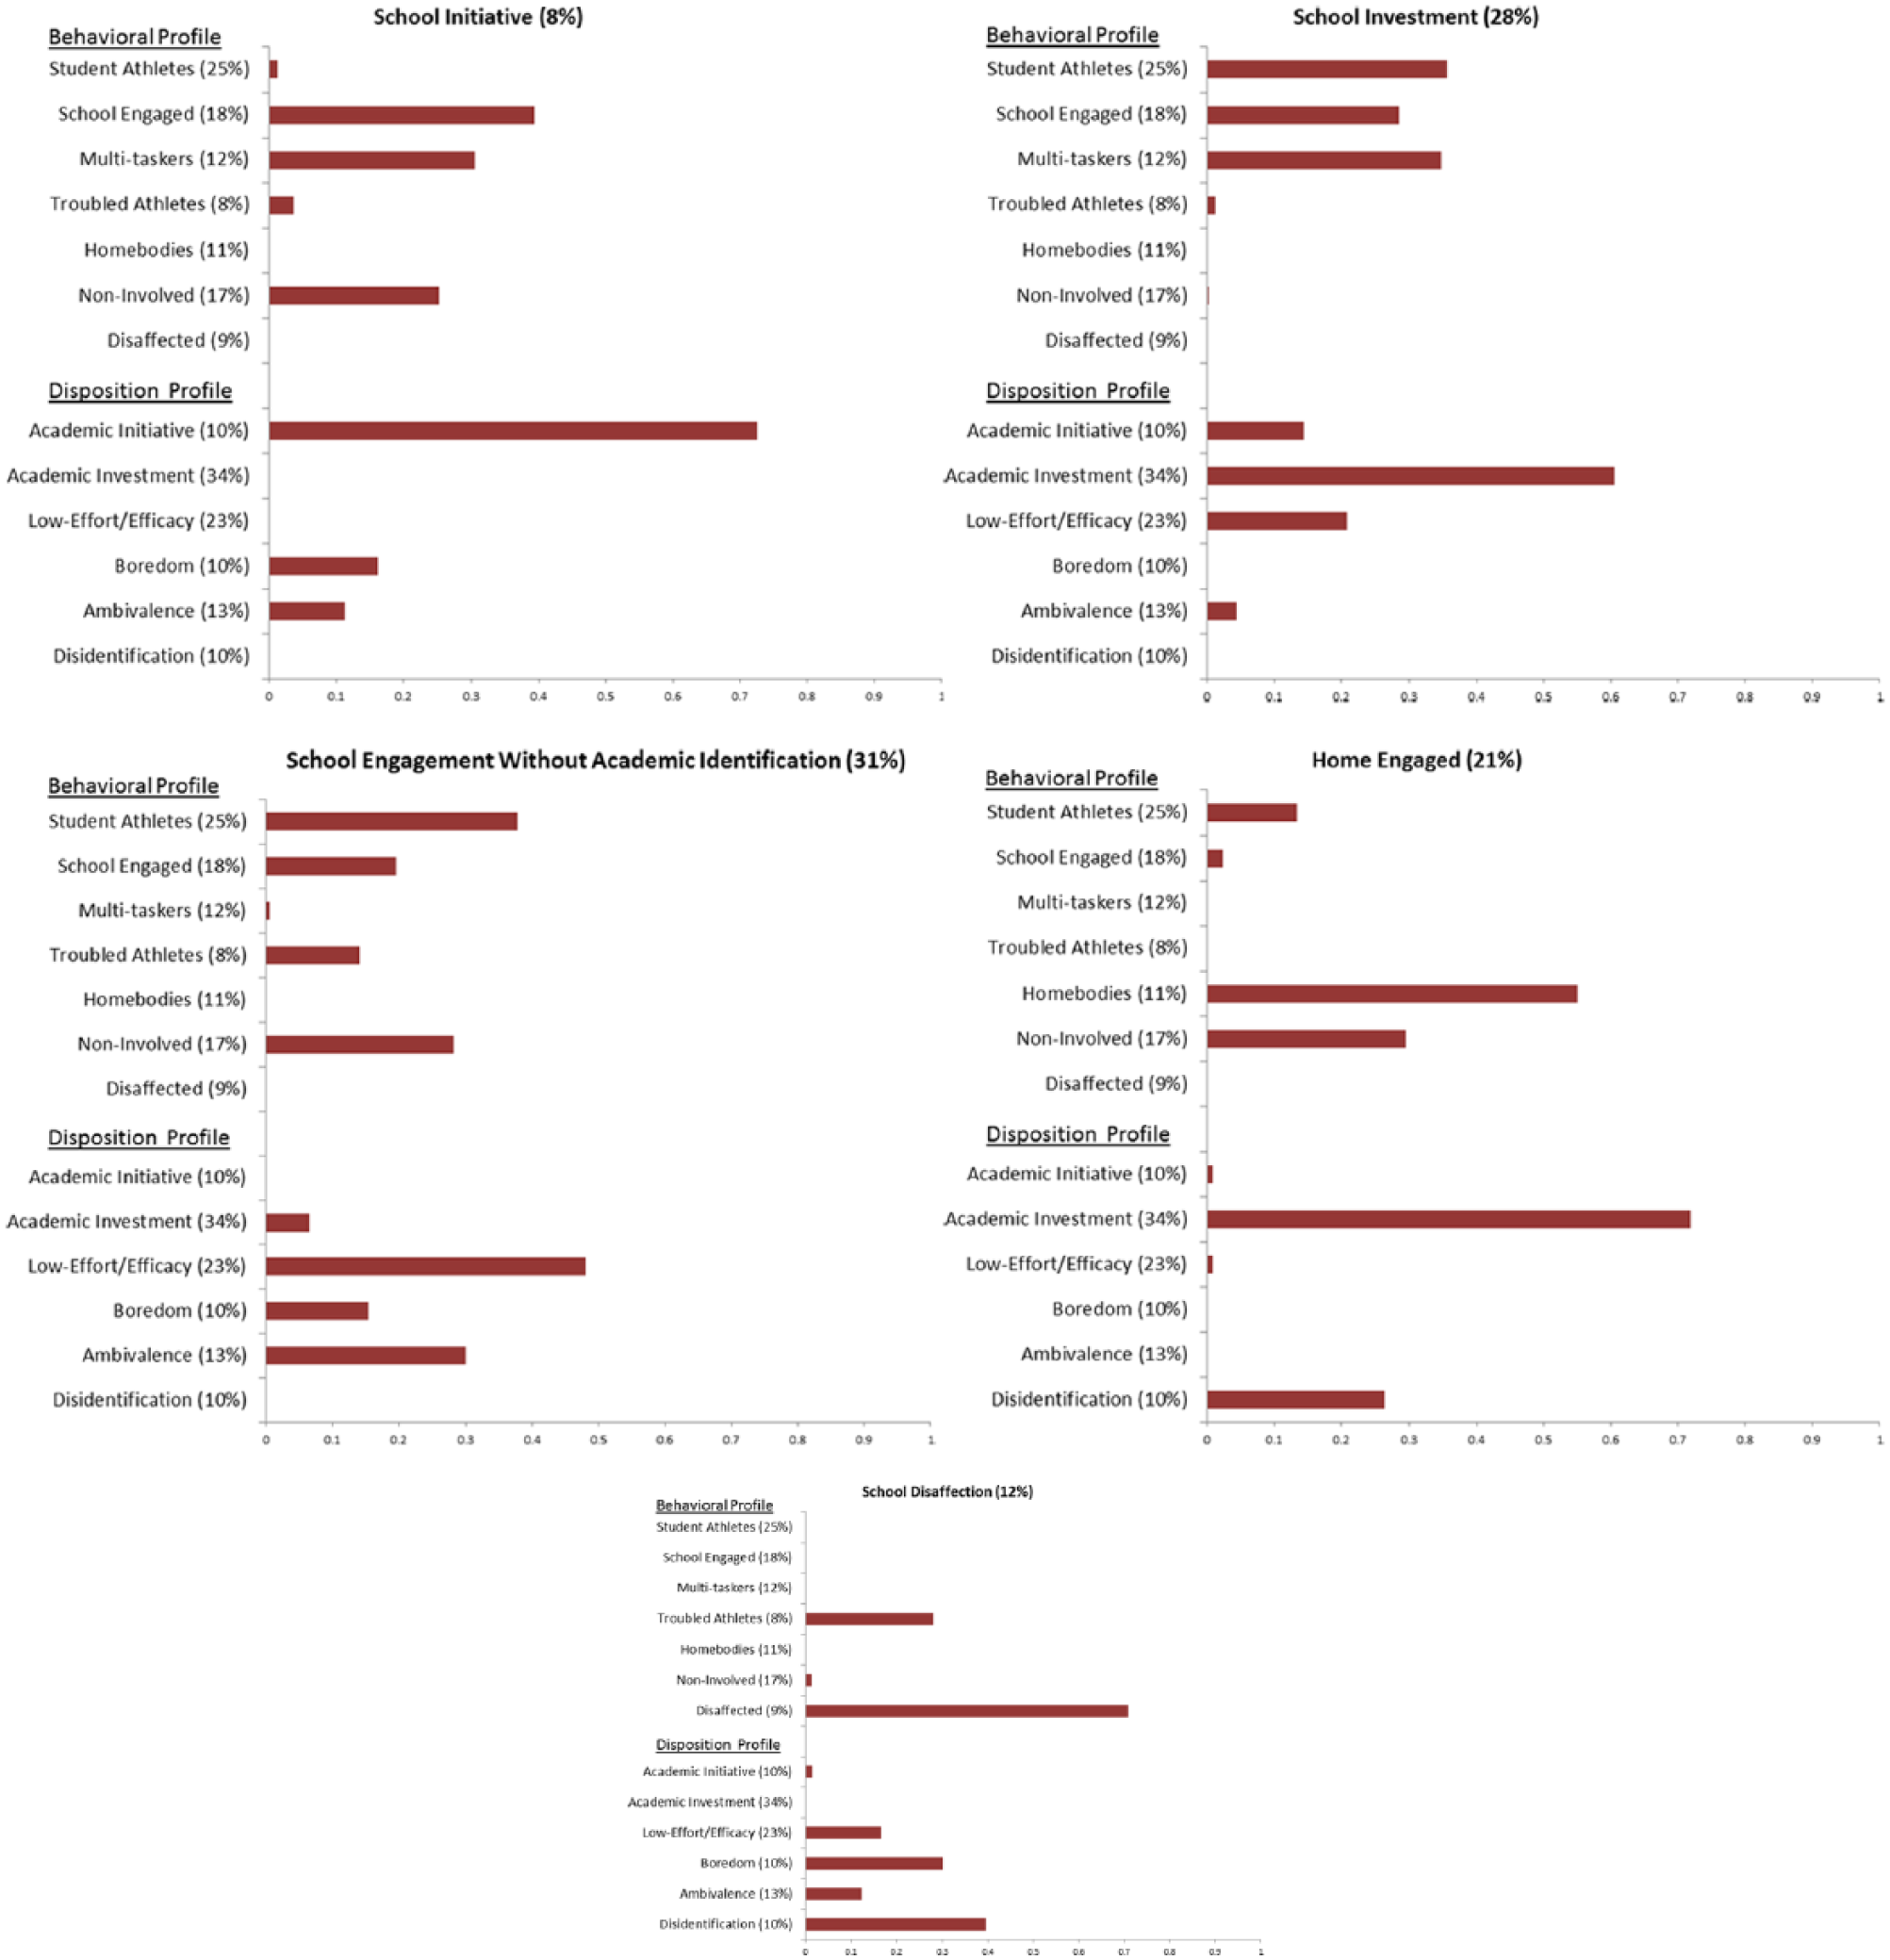
Higher-order profiles of students’ social ecological engagement.
The first higher-order social-ecological profile was estimated to represent 8% of the ELS sample. It consists of students who belong mostly to the academic initiative disposition profile (75%) as well as the School Engaged and Multitaskers behavioral groups (70%). We refer to this social-ecological profile as the “school initiative” class because of these students’ apparent intrinsic enjoyment of, and identification with, both ECAs and academics (see also Larson, 2000).
The second social-ecological profile was estimated to represent 28% of the ELS student sample. This group consists almost entirely of Student Athletes, School Engaged, and Multitaskers who have engagement dispositions characterized by a strong belief in the overall importance of school and schooling. We refer to this group as the “school investment” class because of these students’ apparent commitments to both academics and constructive leisure activities at school. Readers should be mindful, however, that by virtue of having an 80% chance of belonging to either the academic investment (60%) or low-effort/efficacy disposition (20%) groups, most of these students do not, on the whole, enjoy academic work. For this reason, this profile should be considered characteristically distinct from the school initiative class, which tends to exhibit the most authentic form of academic identification.
The third social-ecological profile was estimated to represent 31% of the ELS student sample. This group consists mostly of students in the Student Athletes, School Engaged, Troubled Athletes, and Non-Involved behavioral groups who belong to either the low-effort/efficacy (48%) or ambivalence (30%) disposition profiles. Because most of these students approach academic work without much enjoyment or efficacy, we labeled this social-ecological profile the “school engagement without academic identification” class, with the reminder that this lack of identification is not synonymous with academic dis-identification.
The fourth social-ecological profile included 21% of the ELS student sample. This profile consists mostly of students who belong to either the Homebodies or Non-Involved behavioral profile groups. Because these student’s behavioral engagement preferences were rooted in the home, we characterized this profile as the “home engaged.”
Although these students shared similar home-based behavioral engagement patterns, an analysis of these students’ engagement dispositions suggests that this profile includes, at minimum, two primary engagement subtypes. The first subtype includes the 70% of home-engaged students who have engagement dispositions characterized by academic investment toward school. The second subtype includes the 30% of Homebodies and Non-Involved students who dis-identify with academics and school overall. Presumably, these sharp differences in engagement dispositions stand as important predictors for these students’ long-term educational outcome trajectories (e.g., Eccles et al., 2003; M. Lawson & Masyn, 2015).
The fifth and final social-ecological profile was estimated to represent 12% of the ELS student sample. This profile consists almost entirely of Disaffected (70%) students and Troubled Athletes (28%) who also belong to the dis-identification (39%), boredom (30%), or ambivalence (12%) disposition profile groups. Because these students seem behaviorally, cognitively, and emotionally dissatisfied with school and academic work, we labeled this profile the “school disaffected.”
Although research and theory indicate that students in the school-disaffected profile are the most likely candidates for school failure and other social problems (Eccles et al., 2003; Henry et al., 2012), the range of dispositions included in this group indicate that this profile is not a monolith. In fact, some of these students (i.e., Troubled Athletes and Disaffected) possess engagement-related strengths and competencies that might be used to foster their academic engagement, reengagement, and overall school success.
Contributions and Conclusions
This study was designed to explore a novel conceptual-analytic model for student engagement research. Drawing on the work of M. Lawson and Lawson (2013), this model depicted student engagement as the intersection between students’ behavioral engagement in school, home, and community settings and their thoughts, feelings, attitudes, and identity beliefs about school—that is, their engagement dispositions. LCA was used analyze these constructs and their relations using data drawn from a nationally representative sample of students attending public high schools in the United States.
We began this study with a core assumption—namely, that we would find a strong link between student behavioral profiles characterized by engagement in constructive leisure activities at school, at home, and in the community and engagement dispositions characterized by academic engagement in schools and classrooms. This assumption was founded primarily on Jeremy Finn’s (1989) participation-identification model of engagement. This model predicts a recurrent pattern: Behaviorally engaged students will identify with school, while behaviorally disengaged students will not.
Results from this study indicate that the participation-identification relationship modeled by Finn (1989) is not simple or automatic. To the contrary, it appears significantly more nuanced than originally proposed. This study serves to affirm, amend, and extend Finn’s model while also highlighting the complexity of the participation-identification relationship as nonlinear and nonhomogeneous.
Four primary conclusions help to categorize this relationship and its endemic complexity. First, for many students, participation does not uniformly or equivocally lead to academic engagement or identification. This conclusion was grounded in a finding presented earlier, that is, 31% of students belonged to the “school engagement without academic identification” social-ecological profile. It was also evident in the approximately 30% of Homebodies who dis-identified with academics and school overall. Together, these two profiles suggest that educational interventions that proceed with a strict behavioral focus may be destined to fall short of their desired outcomes.
The second conclusion is that, in the main, student participation in ECAs all but eliminates the probability of school dis-identification. This conclusion follows models that indicated that students in the School Engaged, Multitasker, and Student Athletes profiles had virtually no chance of belonging to the disposition profile characterized as dis-identification. Together, these profile findings indicate that although student participation in ECAs may not be by itself sufficient for academic identification, it may act as critical safeguard against the problems associated with disengagement, starting with dropout and encompassing other forms of social withdrawal (e.g., Henry et al., 2012).
The third conclusion is that while behavioral difficulty all but eliminates the prospect of academic engagement and identification, it seldom leads to school dis-identification. Here, our relational models indicated that a large majority of Disaffected students and Troubled Athletes belong to a disposition group other than the dis-identification class. This finding is important because it signals considerable interstudent variability among students with persistent conduct problems. The ready implication is that one-size-fits-all behavioral interventions for so-called troubled students are unwarranted. Indeed, formulaic interventions universally applied to all manner of students have the potential to cause harm (Ferguson, 2001).
The fourth conclusion is consistent with Finn’s (1989) prediction. That is, with only a few exceptions, academic identification operates in synergy with participation. This important relationship was especially evident in our analysis of the behavioral patterns of students in the academic initiative class—that is, the student subgroup that intrinsically identified with academics and school overall. Here, the data indicated that 83% of those in the academic initiative class belonged to a behavioral class characterized by participation in school-based ECAs.
In summary, our findings indicate that while participation does not ensure identification (e.g., only 29% to 43% of Student Athletes, School Engaged, and Multitaskers were in the academic initiative or academic investment disposition classes), academic identification nearly always includes some sort of school-community engagement and participation. Thus, in its most optimal form, student engagement might be best characterized as identification-participation. One implication is that in order to facilitate more optimal forms of academic engagement and identification in schools and classrooms, educational policy and practice may need to prioritize the development of students’ identity-related drivers (i.e., their engagement dispositions), with particular attention toward how these drivers might be fortified by students’ behavioral engagement in constructive leisure activities at school, at home, and in the community (M. Lawson & Lawson, 2013).
The Importance of Identity Transfer and Stage-Environment Fit
The preceding discussion implicates a promising engagement strategy, one that helps students transfer their engagement and identification from one activity setting to others. To realize this promise, educational leaders and policymakers will need to invest in three related educational practice and policy priorities. The first is to create opportunities for every student to engage in a structured leisure activity of their interest either at school or in the community (Oyersman et al., 2011). This priority follows findings that indicated that participation and engagement in school-based or community-based ECAs provides a safeguard against school disengagement, dis-identification, and social withdrawal. For this reason, ECA engagement appears to represent a promising strategy for enhancing high school completion outcomes (Skinner & Pitzer, 2012), especially for the 1,500 American public high schools dubbed as “dropout factories” (Balfantz & Byrnes, 2012).
The second educational policy and practice priority is to create more robust opportunities for “skill, competency, and identity transfer” (e.g., Larson, 2000). This need is evident because of the uneven synergy that appears to exist between students’ ECA/school engagement and their academic engagement in schools and classrooms. Although our findings indicate that ECAs can help to ignite this synergy, they also indicate that more explicit transfer strategies are needed, especially ones that connect students’ students’ extraschool interests and identities to academics and formal classroom settings (e.g., Nasir & Hand, 2008).
The third policy priority is for educational leaders and policymakers to help synchronize opportunities for engagement across school, home, and community settings. To realize this objective, schools, families, and community agencies will need to work together to create social environments that “fit” the developmental needs and priorities of today’s diverse high school student populations (Eccles & Roeser, 2011). As stage-environment fit theorists suggest (e.g., Eccles, 2014), this fit can best be facilitated by enhancing student access to five related kinds of engagement opportunities: (a) opportunities for social interactions with adults and a positive peer group; (b) opportunities to exercise autonomy; (3) opportunities to develop educationally relevant skills, competencies, and interests; (d) opportunities for participation and contribution; and (e) opportunities for mattering.
What is striking about these opportunities is how at odds they may be with conventional “walled-in” school improvement models, especially those that emphasize standardized curricula and one-size-fits-all teaching and learning strategies. For this reason, improvement models characterized as partnership models (e.g., H. Lawson, 2014), community collaboration models (e.g., Anderson-Butcher et al., 2010), multiservice and extended-service schools (Dyson & Todd, 2010), and community schools (Blank, Berg, & Melaville, 2006) provide an attractive place-based alternative to more standardized models of schooling.
However, for these models to realize their promise, engagement will need to become an explicit improvement priority. Presently it is not, in part, because their improvement discourses tend to focus on health and social services or perhaps sharing decision-making power and authority with parents, young people, and other local residents (e.g., Ishimaru, 2014). In our view, these current models might be expanded from the current focus on removing barriers to engagement and learning (e.g., Adelman & Taylor, 2005), or more narrowly, preventing disengagement (Rumberger & Rotermund, 2012), to developing those setting-level characteristics and opportunities that are known to foster engagement by way of stage-environment fit (Eccles, 2014).
Finally, in order to help facilitate the synchronization and/or transfer of student engagement across home, school, and community settings, educational leaders, community, and youth development leaders will need to have access to expanded data sets. Here, local educational and social-health leaders, policymakers, and university faculty can take stock of the work undertaken by the Youth Data Archive (e.g., Nelson, London, & Stroebel, 2015) and develop data systems that track student engagement across schools, health and social service agencies, and local not-for-profit organizations. From there, researchers can use LCA to generate engagement profile models that can facilitate more comprehensive improvement planning and more nuanced policy development. Such is the potential of person-centered research models that are guided by social-ecological frameworks.
Limitations and Future Directions
We acknowledge several limitations. First, although the engagement profiles examined in this study appear well aligned with extant engagement research and theory, they are nonetheless dependent on the observed latent class indicators that were analyzed in this research. Thus, each of this study’s engagement profiles might have significantly altered (or enhanced) if we had included other indicators in our latent class models. For this reason, future research can help test the stability and replicability of our profiles by analyzing other “manifest variables” of engagement, including measures of paid and unpaid work, household chores, and engagement in faith-based activities (e.g., Peck et al., 2008).
A second and related limitation concerns the quality of the observed latent class indicators that were used to estimate our behavioral engagement and engagement disposition profile models. For instance, although the ELS data set provides researchers with access to a diverse array of ECA engagement indicators, the ELS survey items used to capture these experiences were not written with time stems (e.g., “In the past 6 months, have you . . .”). Because of this omission, we were unable to discern whether our behavioral profile models reflected what students have done in school, what they are doing, what they plan to do, or some combination thereof.
Another potential limitation of this study relates to the analytic specification of our disposition profile models. This limitation was suggested by an AERA Open reviewer who questioned whether some of our engagement disposition variables were better classified as indicators of students’ behavioral engagement. As others have noted (e.g., Fredricks et al., 2004), disentangling students’ cognitions from their behaviors is especially challenging in survey research, where items like student “effort” and “persistence” can readily be interpreted as either an action (i.e., a behavior) or an orientation to action (i.e., a thought or an identity belief). We chose to position these variables as indicators of students’ engagement dispositions because we believe that students’ attributions about their academic competence is best characterized as an identity belief rather than a specific, identifiable and/or verifiable behavior (see M. Lawson & Masyn, 2015, for a greater discussion of this issue). However, we recognize that others may disagree with this view. For this reason, future work should continue to test the construct validity of this study’s engagement profile models using alternative measurement strategies and analytic specifications.
A third limitation of this study involves needs to better understand those social-ecological influences that contribute to the development of students’ engagement behaviors and dispositions. Students’ peer groups and peer group identities represent two such constructs (e.g., Busch et al., 2014). These variables were not included in this study because of constraints in the ELS data set. However, future research will benefit by examining their potential mediating role in shaping students’ long-term engagement trajectories and educational outcomes.
Finally, future research should better attend to the localized conditions that facilitate (or constrain) engagement across students and schools. As a part of this effort, researchers can and should use local data to further test the content validity of the profiles advanced in this study. Such district- and countywide studies carry the potential to capture local patterns of engagement that may be silenced by this study’s aggregated model. In this sense, it is helpful to think about this study’s social-ecological profiles as a set of “ideal types” (Hearn, 1975). Viewed as ideal types, our profiles may not identify or capture the unique engagement-related characteristics of any particular student or case.
Notwithstanding these important design limitations, this study offered important insights into the heterogeneous nature of high school students’ engagement experiences. And, as part of mapping these complex contingencies, this study helped frame a robust pathway for future engagement research and practice, one that privileges inquiry into the mechanisms that facilitate student engagement in school-community life.
Footnotes
Appendix A
Variable Names and Codes for Indicators of Disposition Profile Membership

| Variable | Scale | ELS:2002 Variable and Description | ELS Coding | |
|---|---|---|---|---|
| Students’ future beliefs | ||||
| Postsecondary initiative (psin) | 0 = Use informal resources only |
Formal | 0 = No |
|
| BYS59A | Has gone to counselor for college entrance information | |||
| BYS59B | Has gone to teacher for college entrance information | |||
| BYS59C | Has gone to coach for college entrance information | |||
| BYS59I | Has gone to college representative for college entrance information | |||
| Informal | 0 = No |
|||
| BYS59D | Has gone to parent for college entrance information | |||
| BYS59E | Has gone to friend for college entrance information | |||
| BYS59F | Has gone to sibling for college entrance information | |||
| BYS59G | Has gone to other relative for college entrance information | |||
| Postsecondary investment (psinv) | 0 = No investment (response of 1 or 2) |
BYSTEXP | How far in school students will get | 1 = Less than high school |
| Academic initiative variables | ||||
| Academic flow (flow) | 0 = No flow experiences |
BYS87A | Gets totally absorbed in mathematicsGets totally absorbed in reading | 1 = Strongly agree |
| BYS87E | ||||
| Academic enjoyment (enjoy) | 0 = No academic enjoyment |
BYS87BBYS87C | Thinks reading is funThinks math is fun | 1 = Strongly agree |
| Academic initiative (init) | 0 = No academic initiative |
BYS27A | Classes are interesting and challenging | 1 = Strongly agree |
| Academic investment variables | ||||
| Academic efficacy (aceff) | 0 = No academic efficacy |
BYS89E | Can learn something really hard | 1 = Strongly agree |
| Academic persistence (pers) | 0 = No academic persistence |
BYS89O | Keeps studying even if material is difficult | 1 = Strongly agree |
| Academic effort (try) | 0 = No academic effort |
BYS89V | Puts forth best effort when studying | 1 = Strongly agree |
| Academic attention (atten) | 0 = No academic attention |
BYTE16 | How often is student attentive in class? | 1 = Never |
| Academic investment (acinv) | 0 = Not important |
BYS37 | Importance of good grades to student | 1 = Not important |
| School investment variables | ||||
| School social investment (schsoc) | 0 = Little or no investment |
BYS27E | School is a place to meet friends | 1 = Strongly agree |
| Civic investment (civinv) | 0 = Little or no investment |
BYS54F | Importance of helping others in community | 1 = Not important |
| Occupational investment (ocinv) | 0 = Little or no investment |
BYS54A | Importance of being successful in line of work | 1 = Not important |
| Postsecondary investment (psin) | 0 = No investment (student response of 1 or 2) |
BYSTEXP | How far in school students will get | 1 = Less than high school |
| School investment variables | ||||
| School social investment (socinv) | 0 = Little or no investment |
BYS27E | School is a place to meet friends | 1 = Strongly agree |
| Occupational investment (ocinv) | 0 = Little or no investment |
BYS54A | Importance of being successful in line of work | 1 = Not important |
| Civic investment (civinv) | 0 = Little or no investment |
BYS54F | Importance of helping others in community | 1 = Not Important |
| Ambivalence variables | ||||
| General ambivalence (amb) | 0 = No ambivalence |
(Sum of affirmative responses / 4) | “Somewhat agrees” or “unsure/don’t know” | |
| BYS38 | “Somewhat likes school” or “doesn’t know” | |||
| BYSTUEX | “Doesn’t know” how far they’ll get in school | |||
| BYS54A | “Somewhat important to be successful in work” | |||
| BYS54O | “Somewhat important to get good education” | |||
| School ambivalence (schamb) | 0 = No ambivalence |
BYS27C | Has nothing better to do than school For Peer Review | 1 = Strongly agree |
| Dis-identification variables | ||||
| Teacher alienation (talien) | 0 = No alienation experience |
BYS20H | In class often feels put down by teacher | 1 = Strongly agree |
| Peer alienation (palien) | 0 = No alienation experience |
BYS20I | In class often feels put down by students | 1 = Strongly agree |
| School dis-identification (schdis) | 0 = Does not disidentify |
BYS28 | How much likes school | 1 = Not at all |
Note. ELS = Educational Longitudinal Study.
Appendix B
Variable Names and Codes for Indicators of Behavioral Profile Membership

| Variable | Scale | ELS:2002 Variable and Description | ELS Coding | |
|---|---|---|---|---|
| Indicators of engagement in school-sponsored ECAs | ||||
| Structured interscholastic sports (sports) | 0 = Did not participate 1 = Participated in at least one |
BYBASEBL BYSOFTBL BYBSKTBL BYFOOTBL BYSOCCER BYTEAMSP BYSOLOSP BYCHRDRL |
Baseball Softball Basketball Football Soccer Other team sport Individual sport Cheerleading or drill team |
1 = No interscholastic team 2 = Did not participate 3 = Participated in JV 4 = Participated in varsity 5 = Varsity captain |
| Unstructured school sports (intramural) | 0 = Did not participate 1 = Participated in at least one |
BYS39A BYS39B BYS39C BYS39D BYS39E BYS39F BYS39G BYS39H |
Baseball Softball Basketball Football Soccer Other team sport Individual sport Cheerleading or drill team |
1 = No intramural team 2 = No (did not participate) 3 = Yes (did participate) |
| School arts (arts) | Music or Drama 0 = Did not participate 1 = Participated in at least one |
BYS41A BYS41B |
Participated in school band or chorus Participated in school play or musical |
0 = No 1 = Yes |
| School service (service) | 0 = Did not participate 1 = Participated in at least one |
BYS 41E BYS 41F BYS41H BYS41C |
Participated in school yearbook or newspaper Participated in school service clubs Participated in school hobby clubs Participated in student government |
0 = No 1 = Yes |
| Indicators of engagement in school-sponsored ECAs (student self-reports) | ||||
| School-sponsored vocational club (voclub) | 0 = Did not participate 1 = Participated in at least one |
BYS41I BYS71A BYS71B BYS71C BYS71F |
Participated in school vocational clubs Participated in cooperative education Participated in internship Participated in job shadowing Participated in school-based enterprise |
1 = Yes 0 = No |
| School academic club (saclub) | 0 = Did not participate 1 = Participated in at least one |
BYS41D BYS41G |
Participated in academic honor society Participated in school academic clubs |
0 = No 1 = Yes −1 = Don’t know |
| Community service (comserv) | 0 = Did not participate 1 = Participated |
BYS71E | Participated in community service | 0 = No 1 = Yes |
| Indicators of activity intensity (student self-reports) | ||||
| School-based extracurricular activity intensity (ecin) | 0 = None 1 = 1–2 hours of participation each day 2 = 2 or more hours of participation each day |
BYS42 | Hours spent each week on school-sponsored extracurricular activity | 0 = 0 hours 1 = 1 hour 2 = 2 hours 3 = 3 hours 4 = 4 hours |
| Out-of-school time extracurricular activity intensity (ost_in) | 0 = No activity 1 = Participates less than two times per week 2 = Participates two or more times per week |
BYS44F BYS44G BYS44H |
How often takes music, arts, or language classes How often takes sports lessons How often plays non-school sports |
1 = Rarely or never 2 = Less than once a week 3 = Once or twice weekly 4 = Everyday or almost |
| Unstructured out-of-school time (tv_vid) | 0 = 1 or less hours per day 1 = More than 1 but less than 4 hours per day 2 = 4 or more hours per day |
BYS 48A BYS49A |
Hours/day spent watching TV on weekdays Hours/day playing video or computer games on weekdays |
0 = 0 hours 1 = 1 hour 2 = 2 hours 3 = 3 hours 4 = 4 hours 5 = 5 hours 6 = 6 or more hours |
| Homework (hw) | 0 = None 1 = 1–2 hours daily 2 = More than 2 hours daily |
BYS34B | Hours/week spent on homework in and out of school | 0 = 0 hours 1 = 1 hour 2 = 2 hours 3 = 3 hours |
| Out-of-school time reading (read) | (Per week) 0 = Less than hour per day 1 = 1 or more hours per day |
BYS43 | Hours/week spent reading outside of school (non-school reading) | 0 = 0 hours 1 = 1 hour 2 = 2 hours 3 = 3 hours 4 = 4 hours |
| Indicators of student conduct (student self-reports) | ||||
| Student class cutting (cut) | 0 = None 1 = One to two times 2 = Three or more times |
BYS24B | How many times cut/skipped classes | 1 = Never 2 = One to two 3 = Three to six 4 = Seven to nine 5 = Ten or more |
| Student absences (abs) | (For the current quarter) 0 = Two or less absences 1 = Three to six 2 = Seven or more |
BYS24C | How many times absent from school | 1 = Never 2 = One to two 3 = Three to six 4 = Seven to nine 5 = Ten or more |
| Suspensions (susp) | (For the current quarter) 0 = None 1 = Once or twice 2 = Three or more |
BYS24E BYS24F |
How many times put on in-school suspension How many times suspended/put on probation |
1 = Never 2 = One to two 3 = Three to six 4 = Seven to nine 5 = Ten or more |
Note. ELS = Educational Longitudinal Study; ECA = extracurricular activity; JV = junior varsity.
Appendix C
Appendix D
Appendix E
Acknowledgements
The authors would like to thank Paul Heckman, Hal Lawson, editor Jacquelynne Eccles, and the anonymous reviewers from AERA Open for their helpful comments and criticisms on previous versions of this article.
Notes
Authors
MICHAEL A. LAWSON is an assistant professor (non–tenure track) in the Department of Educational Studies, College of Education, at the University of Alabama. His current research interests center on student engagement, improvement science, innovative designs for family and community engagement, and evaluations of school-based and community-based prevention programs.
KATHERINE E. MASYN is an associate professor and Second Century Initiative (2CI) Scholar in the Division of Division of Epidemiology and Biostatistics, School of Public Health, at Georgia State University. Her research focuses on the development and application of latent variable statistical models related to survival and event history analysis, latent transition growth mixture models, and more broadly, the characterization and parameterization of both observed and unobserved population heterogeneity in cross-sectional and longitudinal settings, for example, factor mixture models.