
Abstract
Although the number of Science, Technology, Engineering, and Mathematics (STEM) graduates is increasing, few studies have examined the implications of STEM credentials for the well-being of children. Using data from the 2018–2022 American Community Survey, this study examines racial and ethnic inequalities in poverty among the children of STEM graduates, and whether these inequalities are shaped by foreign-born status. The results show several patterns of inequality in child poverty, which are conditional on ethno-racial differences and the occupational outcomes of STEM graduates. For example, Black and Hispanic children, who have the highest poverty rates, are the most likely to have parents with STEM degrees who are not employed in STEM jobs and parents with jobs with lower levels of prestige. The results also show higher levels of child poverty in foreign-born compared to U.S.-born STEM households. However, in U.S.-born STEM households, the employment of STEM graduates in occupations in the highest quartiles is associated with a greater poverty advantage among Whites than non-Whites. Conversely, the employment of STEM graduates in occupations in the lowest quartiles accentuates the disadvantage of Blacks compared to non-Blacks. Finally, the results indicate that in foreign-born STEM households, the poverty outcomes of Black children of STEM graduates are identical to those of White children whose parents never went to college.
Introduction
The number of individuals with Science, Technology, Engineering, and Mathematics (STEM) degrees has significantly increased in recent decades (American Academy of Arts and Sciences 2017; Burdman 2024; Jenkins, Butler, and Mitchell 2013; Scherer and Leshner 2018). This increase is partly a result of efforts to develop a U.S. workforce that would increase America’s competitiveness in the global economy (Alper 2016; Atkinson and Mayo 2010). Furthermore, the increase has been accompanied by a rapid expansion of studies examining how STEM contributes to technological innovation, industrial progress, and economic development (e.g., Baran et al. 2016; Tytler 2020; Werum et al. 2020; Zaza et al. 2020). These developments have generally increased our understanding of the social significance of STEM credentials. However, less attention has been given to the micro-level implications of STEM for children and their families.
This gap in the literature has made it difficult for us to understand the extent to which the advantages associated with having STEM credentials can be translated into improvements in the well-being of children. Some studies suggest that having parents with STEM degrees can improve the socioeconomic attainment of children (e.g., Ing 2014; Blackwell and Pinder 2014). However, the specific mechanisms that drive this relationship are unclear. Furthermore, there are disparities in access to STEM education based on factors such as race-ethnicity and gender (Irizarry 2021; Ma and Liu 2015; Fry et al., 2021; Riegle-Crumb, King, and Irizarry 2019), which raise new questions about how the advantages associated with having STEM degrees (Beutel and Schleifer 2022; National Science Foundation [NSF] 2023) are filtered into the outcomes of children. To examine these issues, new studies are needed to clarify what variations in access to opportunity among STEM graduates could imply for the overall well-being of their children.
One of the most important determinants of the welfare of children is their exposure to poverty (Boyden et al. 2019; Schmidt et al. 2021). However, there are two dimensions of inequality in this exposure that are important for investigating how the economic welfare of children could be affected by the STEM credentials of their parents. The first dimension is associated with race-ethnic differences in child poverty, as reflected in the fact that children from disadvantaged racial minority groups (e.g., Blacks and Hispanics) are more likely to live in poverty compared to children who are White (Gibson-Davis, Keister, and Gennetian 2021; Heard-Garris et al. 2021). The second dimension is associated with foreign-born/immigrant status. As demonstrated in prior studies, child poverty rates are generally higher among immigrants than among the U.S. born (Acevedo-Garcia et al. 2021).
Beyond their implications for the dynamics of child poverty, these two dimensions of inequality are important because both race-ethnicity and foreign-born status are critical factors that determine access to opportunities in STEM (e.g., American Immigration Council 2019; Ma and Liu 2015; Roach and Skrentny 2021). For example, Blacks (7 percent), Hispanics (12 percent), Asians (11 percent), and other race individuals (4 percent) are less likely to have a bachelor’s degree in STEM compared to Whites (62 percent) (Fry, Kennedy, and Funk 2021). Corresponding disparities have also been found in the percentage of Blacks (9 percent), Hispanics (8 percent), Asians (13 percent), other race individuals (3 percent), and Whites (67 percent) employed in the STEM workforce (Fry et al. 2021). Evidence showing that STEM credentials contribute to improvements in the economic well-being of workers (Even, Yamashita, and Cummins 2023; NSF 2023) therefore creates new opportunities for examining the implications of differential access to these credentials for inequalities in the economic welfare of children.
To address this gap in the literature, this study examines racial and ethnic disparities in poverty among children in the families of STEM graduates as well as the extent to which these disparities are circumscribed by foreign-born status. Using data from the five-year 2022 sample of the American Community Survey (ACS), the study achieves three specific objectives. First, it investigates whether the children of STEM graduates are less likely to live in poverty compared to the children of graduates with other types of degrees. Second, it examines whether there are race-ethnic disparities in poverty among the children of STEM graduates and investigates whether these disparities are consistent in immigrant and U.S.-born households. Finally, the study investigates whether the patterns described above are influenced by variations in occupational stratification among parents with STEM credentials. By addressing these objectives, the analysis hopes to improve our understanding of the major barriers that can limit parents’ ability to translate STEM credentials into economic benefits for their children.
Theoretical Perspectives
Three major perspectives are important for understanding the various factors that could lead to disparities in poverty among children whose parents are STEM graduates. Such disparities can result in differential exposure to long-term consequences of child poverty such as adult unemployment, teenage pregnancy, and schooling dropout (Ratcliffe and McKernan 2010). The first perspective highlights the role of STEM degrees in the intergenerational transmission of socioeconomic well-being within families (e.g., Gottschalk, McLanahan, and Sandefur 2019), while the second underscores the importance of ethno-racial minority status as a countervailing influence that could affect these transmissions (e.g., Lissitsa and Chachashvili-Bolotin 2023). The third perspective incorporates the role of immigrant status as a factor that can not only contribute to additional patterns of ethno-racial stratification (e.g., Van Hook, Brown, and Kwenda 2004), but also have an independent influence on the intergenerational transmission of socioeconomic well-being. Apart from these, the conceptual framework also acknowledges the influence of other complementary factors (e.g., single-parent families) that are known to be more prevalent among some groups than among others.
STEM Degrees and the Intergenerational Transmission of Socioeconomic Well-being in Families
Studies on the intergenerational transmission of socioeconomic well-being between parents and children provide the most important foundational explanation for expecting the children of STEM graduates to have lower levels of poverty compared to other children (e.g., Plasman and Gottfried 2018). Some studies have documented similar transmissions in occupational status and educational outcomes between parents and children in STEM families (e.g., Boussiakou and Kalkani 2007; Plasman and Gottfried 2018). Correspondingly, given their comparatively higher levels of economic success (Beutel and Schleifer 2022; Even et al. 2023), STEM graduates are expected to be able to provide a greater level of economic security for their children compared to non-STEM graduates. In addition, parental STEM degrees can serve as a great equalizer that reduces social disparities in the outcomes of children between families (Bernardi and Ballarino 2016; Torche 2011). As previous studies suggest (e.g., Torche 2011), this equalizing role is particularly important for increasing the social mobility of low-status groups.
Ethno-racial Disparities and Occupational Disparities in STEM
At the same time, there is increasing evidence suggesting that ethno-racial differences can present a countervailing set of influences that could limit the transmission of socioeconomic resources between STEM graduates and their children (e.g., Thomson, Salazar, and Ecklund 2021). These differences can affect not only the access ethno-racial minorities have to STEM jobs, but also the occupational mobility they experience after securing these jobs. For example, Black STEM graduates are more likely to be unemployed compared to White STEM graduates (NSF 2023). In part, this is because of negative employer perceptions of degrees earned from Historically Black Colleges and Universities—HBCUs (Fogle 2012). Ethno-racial minorities in the STEM workforce also have fewer opportunities for professional advancement compared to Whites (Thomson et al. 2021). For example, research indicates that, relative to Whites, ethno-racial minorities experience higher levels of discrimination that can negatively affect their prospects of occupational mobility (e.g., Lissitsa and Chachashvili-Bolotin 2023). Other studies similarly indicate that STEM workers from countries such as India and Colombia are exposed to employer exploitation and workplace marginalization, which can negatively affect their occupational attainment (Banerjee and Rincón 2019).
In addition, many ethno-racial minorities face a high risk of experiencing downward occupational mobility, which could shift them into low-status jobs (e.g., Banerjee and Rincón 2019; Miech, Eaton, and Liang 2003). For example, Black workers are generally more likely to be stratified into less prestigious jobs compared to their White counterparts (Logan et al. 2000; Miech et al. 2003). Evidence also shows that STEM workers from some Asian and Hispanic groups experience downward patterns of occupational mobility in the labor market (Banerjee and Rincón 2019). Combined with the discriminatory experiences described above, these influences suggest that the transmission of socioeconomic resources from parents to children in STEM families is less likely to be constrained among Whites than among ethno-racial minorities.
Nativity Differences among Parents and the Socioeconomic Well-being of Children
Nativity differences can conceptually contribute additional constraints to the intergenerational transmission of resources in STEM families, either through their independent influence on parental socioeconomic attainment or their role in creating additional patterns of ethno-racial stratification. One example of their independent influence is found in evidence showing that children in immigrant families have a more elevated risk of living in poverty compared to children in the families of U.S. natives (Landale et al. 2011; Van Hook et al. 2004). As shown in previous research, these risks are highest in Black and Hispanic immigrant families (Landale et al. 2011). Immigrant parents also independently face unique disadvantages that could limit their ability to use STEM degrees. Compared to U.S. natives, for example, they are more likely to be unemployed (Bick 2025), less likely to be proficient in English (e.g., Fremstad 2003), and usually have foreign college degrees that are less desirable to employers compared to degrees earned in the United States (Tong 2010).
Other Complementary Influences
Apart from these influences, there is a diverse set of complementary factors that could also conceptually affect the relationship between parental STEM credentials and the economic well-being of children. For example, human-capital theory (e.g., Becker 1995; Parcel and Dufur 2001) suggests that STEM graduates would be less likely to have children living in poverty than non-STEM graduates, because of the greater premium placed on the human capital of the former than on that of the latter (Beutel and Schleifer 2022; Even et al. 2023). Other studies underscore the importance of parental work patterns, which capture their participation in income-generating activities (e.g., Chen 2013), as critical determinants of disparities in child poverty rates (Oropesa and Landale 2000). In addition, exposure to poverty among the children of STEM graduates could result from differences in the characteristics of their families. For example, child poverty rates are higher in single-parent than in two-parent families (Maldonado and Nieuwenhuis 2015). Accordingly, a higher prevalence of single-parent families among Black and Hispanic STEM graduates compared to their White counterparts could lead to corresponding disparities in their children’s exposure to poverty. Previous studies have also found a positive relationship between household size and child poverty (Fusco and Islam 2020). However, it is not clear whether their adverse implications for the well-being of children are substantial in the families of STEM graduates.
In summary, there is no question that STEM credentials can have positive implications for the economic well-being of graduates (e.g., Beutel and Schleifer 2022). However, existing studies provide mixed evidence about their potential for improving the economic well-being of children. On the one hand, evidence from some studies suggest that STEM credentials will increase the resources available to parents to buffer their children from poverty (Even et al. 2023; Roach and Skrentny 2021). On the other hand, other studies imply that race-ethnic differences in access to these resources, as well as exposure to other structural disadvantages, would create inequalities in exposure to poverty among the children of STEM graduates (e.g., Wright, Ellis, and Townley 2017).
This study attempts to resolve these issues by illuminating our understanding of the relationship between parental STEM credentials and child poverty in several important ways. First, it empirically clarifies whether there is a negative association between having parents who are STEM graduates and child poverty. Second, it demonstrates the importance of race-ethnicity and foreign-born status as critical factors that affect the poverty outcomes of the children of STEM graduates. Finally, the study highlights the importance of structural factors such as occupational stratification patterns, as key determinants of poverty among the children of STEM graduates.
Hypotheses
To achieve these objectives, the study examines the following four hypotheses.
H1: Children in STEM households are less likely to live in poverty compared to children in the households of graduates in other fields of study. The less adverse poverty outcomes of the former are expected to result from the comparatively higher expected levels of intergenerational transmission of socioeconomic well-being in STEM families (e.g., Beutel and Schleifer 2022; Boussiakou and Kalkani 2007; Plasman and Gottfried 2018).
H2: Among children in STEM households, those from disadvantaged racial and ethnic minority groups (i.e., Blacks and Hispanics) are more likely to live in poverty compared to their counterparts who are White. Accordingly, the disadvantage faced by ethno-racial minorities in the labor market is expected to impose greater constraints to the intergenerational transmission of economic well-being within their families (e.g., Lissitsa and Chachashvili-Bolotin 2023).
H3: Exposure to child poverty is higher in immigrant STEM households compared to U.S.-born STEM households, which is consistent with previous research on the unique disadvantages experienced by children in immigrant families (e.g., Van Hook et al. 2004).
H4: The racial poverty disadvantage of Black and Hispanic children is mostly concentrated among the children of STEM graduates who are stratified into low-status jobs. As shown in previous research (Banerjee and Rincón 2019; Logan et al. 2000; Miech et al. 2003), race-ethnic minorities are usually stratified into jobs with low prestige, which is expected to elevate the poverty risks faced by children in their families.
Data and Methods
These hypotheses are examined using pooled cross-sectional data from the 2018–2022 sample of the ACS, which are available in the archives of the Integrated Public Use Microdata Series (Ruggles et al. 2024). These data contain the largest source of information on the educational, occupational, and economic outcomes needed to achieve the study’s main objectives. Indeed, there are no other data sources that provide information on these outcomes for STEM graduates that are as extensive as that found in the ACS. 1 Another advantage of the ACS is that it contains unique household identification numbers that can be used to link the demographic and social characteristics of children with those of their parents. These linkages are used in the analysis to match the poverty outcomes of children with the social and economic characteristics of their parents.
The study’s main outcome of interest is a binary measure of poverty status among young children between ages 0 and 10. The analysis specifically focuses on child poverty outcomes in these ages because poverty in the early childhood ages can have negative long-term consequences for children’s physical and social development (e.g., Guo 1998). The study’s child poverty measure is thus coded as 1 for young children living in families that fall below the 100 percent poverty threshold of the ACS and 0 for those who do not. 2 Supplemental analyses were conducted using a 200 percent poverty threshold. The results (available on request) were largely identical to those reported in the analysis.
Four sets of key independent variables are used in the analysis. Race-ethnicity is measured by indicators that distinguish between children who are Hispanic, Black, White, Asian, or from other racial groups. Parental field of study is measured using information on the specific fields of study of college graduates found in the ACS. Using this information, the analysis identifies households (i.e., family households) with household heads and spouses of household heads who have degrees in the following five broad fields of study—STEM, Social Sciences, 3 Arts and Humanities, Business, and other fields of study (e.g., Physical Fitness, Parks, and Recreation studies). In cases where household heads and spouses have degrees in different fields of study, households are classified based on the fields of study of their household heads. 4
Following previous studies (e.g., Landale et al. 2011), children in immigrant and U.S.-born households are identified based on the foreign-born status of household heads and spouses. Accordingly, children in immigrant households are defined as children in households in which either the household head or the spouse of household head is foreign-born. On the contrary, children in U.S.-born households are defined as children in households with only U.S.-born parents. Among children in immigrant households, the analysis further distinguishes between first- and second-generation immigrant children, based on whether they were born in other countries or in the United States, respectively.
The final set of key independent variables contains three measures of occupational stratification. The first is STEM occupational matching, given its significance as a measure of stratification in the STEM workforce (Wright et al. 2017). This measure is constructed using occupational codes available in the ACS to identify STEM occupations. The analysis identifies 177 of the 539 occupational codes available in the ACS as STEM occupations, which is similar to the number identified in previous studies (e.g., Wright et al. 2017). STEM occupation matching is then coded as 1 for STEM graduates employed in STEM occupations and 0 for those who work in non-STEM occupations. The second measure of occupational stratification is a continuous indicator of occupational prestige. This measure is based on socioeconomic index (SEI) scores developed by R. M. Hauser and J. R. Warren (1997). SEI scores are then used to generate the third measure of occupational stratification, which is quartile of occupational prestige. The quartiles are used to rank the occupations of STEM graduates from those with the lowest levels of prestige—quartile 1 (e.g., childcare workers and cooks) to those with the highest—quartile 4 (e.g., computer systems analysts and software developers).
Several variables are used to control for the influence of other individual- and household-level characteristics. They include variables that account for the demographic characteristics (i.e., age, sex) of children, the sociodemographic characteristics of household heads, and household heads’ average number of working hours per week. English proficiency among household heads is measured as a binary outcome coded as 1 if they speak either only English or speak English very well and 0 if they do not. As done in previous studies (e.g., Mattoo, Neagu, and Özden 2008), a proxy measure is used to determine whether household heads were educated abroad to account for the limited transferability of foreign credentials. This measure uses data on both the highest level of schooling and age at arrival to assess whether foreign-born individuals arrived in the United States at ages before or after specific levels of education are usually completed. For example, based on this method, household heads and spouses with bachelor’s degrees, who also arrived in the United States at the age of seven are considered to be U.S.-educated. Added to this, the analysis also accounts for differences in household size and structure (i.e., single-parent vs. two-parent households).
Analytical Strategy
Empirically, the analysis is conducted using logistic regression models that examine the determinants of poverty among children. These models are estimated with robust standard errors that account for the clustering of children within households. The regression analyses are conducted in three stages. First, data on all young children are used to estimate regression models that investigate whether the children of STEM graduates are more likely to live in poverty compared to the children of graduates with degrees in other fields. The reference group in the analysis consists of children in households with no household head or spouse who graduated from college. Second, focusing exclusively on the outcomes of the children of STEM graduates, regression models are used to identify overall race-ethnic variations in the likelihood of living in poverty and the respective variations in this likelihood among the children in immigrant and U.S.-born households.
Finally, the analysis provides an in-depth examination of race-ethnic disparities in poverty among children within the specific occupational strata of household heads with STEM degrees. This allows us to observe race-ethnic differences in child poverty among children, conditional on the quartile of occupational prestige of their parents, and how these disparities vary between the children of immigrant and U.S.-born STEM graduates.
Results
Table 1 presents the racial distribution and summary characteristics of the sample of young children in the households of STEM graduates. Compared to the percentages of White (60.8 percent) and Asian (14.9 percent) children living in STEM households, Black (4.8 percent) and Hispanic (10.2 percent) children are considerably underrepresented in these contexts. However, this is consistent with the general underrepresentation of Blacks and Hispanics in STEM (e.g., Ma and Liu 2015). Table 1 also indicates that Asian children are the most likely to live in immigrant families, which is not surprising given the recent surge in the number of Asian immigrant STEM graduates working in U.S. tech companies (Lung-Amam 2015). 5 Additional analysis of the data indicated that the majority of these children had household heads from India (42.5 percent), China (12 percent), or the Philippines (7 percent). More importantly, the results show a clear pattern of household socioeconomic stratification among the children of STEM graduates that is similar to that observed among all young children, regardless of their parents’ level of educational attainment (Appendix E). 6
Descriptive Characteristics of Young Children between Ages 0 and 10 Living in STEM Families.
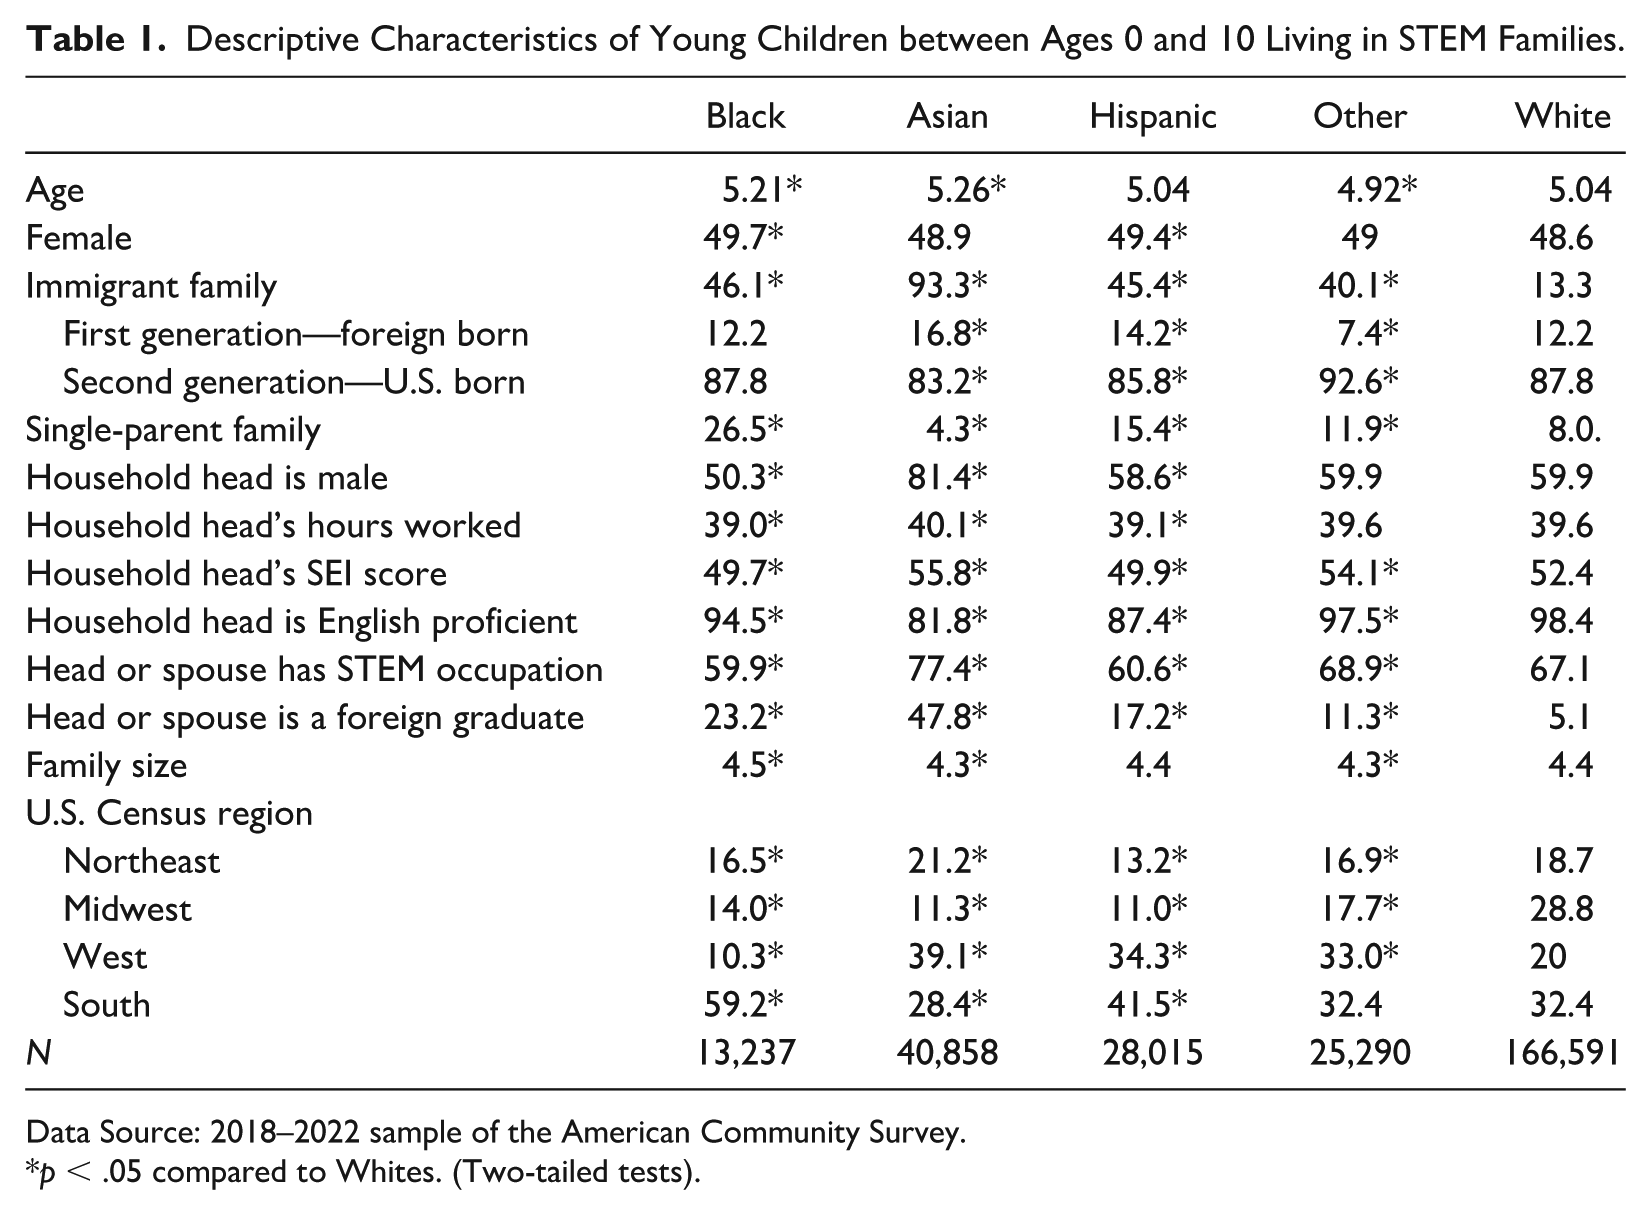
Data Source: 2018–2022 sample of the American Community Survey.
p < .05 compared to Whites. (Two-tailed tests).
At one end of the spectrum are White and Asian children, who generally live in households headed by parents with the highest levels of human capital and occupational attainment. Of these two groups, Asian children live in arguably the most favorable socioeconomic circumstances. They have the lowest percentage of children living in single-parent families, household heads who work for the longest hours, and household heads employed in the most prestigious jobs as measured by SEI scores (Table 1). Furthermore, Asian children are the most likely to live in households with STEM parents who actually work in STEM occupations. The only presumed socioeconomic limitations observed among Asians are the considerably low level of English proficiency of their household heads and the fact that they have the highest percentage of parents with foreign educational credentials.
At the other end of the spectrum are the outcomes of Black and Hispanic children, who tend to live in STEM households with clear socioeconomic disadvantages. For example, Table 1 shows that the highest percentage of children living in single-parent families is found among Blacks (26.5 percent). In addition, the corresponding percentage for Hispanics (15.4 percent) is the second highest in the sample. Equally important is the fact that Black and Hispanic children have household heads with some of the worst occupational outcomes. For example, their household heads are employed in the least prestigious jobs as measured by their SEI scores. Moreover, children in both groups are among the least likely to live in contexts with household heads and spouses of household heads with STEM degrees who are also employed in STEM occupations.
Figure 1 provides the first estimates of gross differences in poverty among young children in STEM households in the 2018–2022 ACS. On average, regardless of race-ethnicity, the children in these households are less likely to live in poverty compared to children in non-STEM households. Among the children in STEM households, however, the highest child poverty rates are found among Blacks (8.4 percent) and Hispanics (5.7 percent), while the lowest rates are found among Whites (2.5 percent) and Asians (2.8 percent). Another perspective on child poverty disparities can be derived from the examination of relative differences in poverty between children in the STEM and non-STEM households of each race-ethnic group. As Figure 1 suggests, the lowest percentage differences in child poverty between both contexts are found among Black and Hispanics. As such, living in households headed by STEM rather than non-STEM graduates appears to be associated with lower improvements in economic welfare among Black and Hispanic children compared to their Asian and White counterparts.
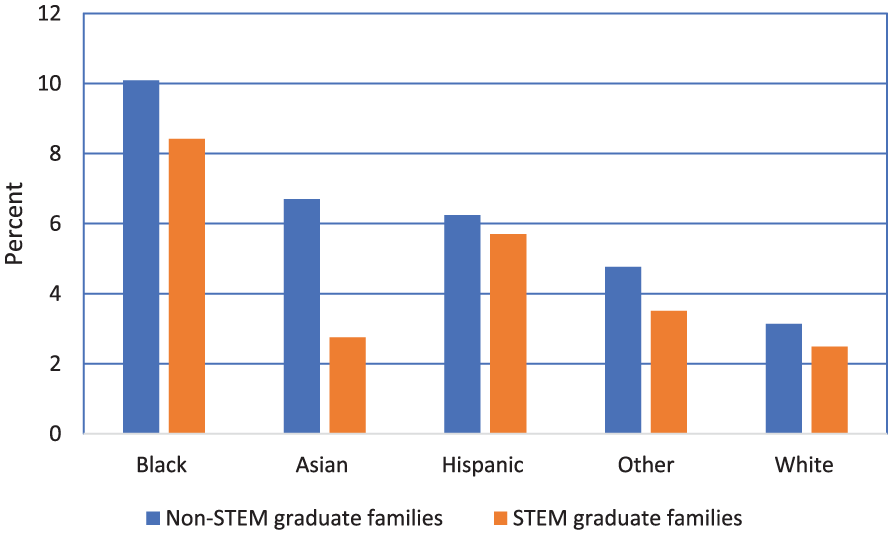
Poverty rates among young children in STEM and Non-STEM households.
A more robust analysis of poverty disparities among the children of STEM and non-STEM graduates is provided by results from logistic regression models presented in Table 2. Model 1, the baseline model, indicates that the odds of child poverty are generally lower in the households of the various college graduates compared to those of non-college graduates (i.e., the reference group). However, consistent with the first hypothesis, the lowest odds of living in poverty are observed among the children of STEM graduates. As the results indicate, these children are 88 percent less likely to live in poverty compared to their counterparts in the reference group. In Model 2, the results indicate that the relative odds of living in poverty associated with having parents with various types of college degrees remain unchanged after accounting for race-ethnic differences.
Results from Logistic Regression Models Examining the Odds of Poverty Among All Children between Ages 0 and 10.
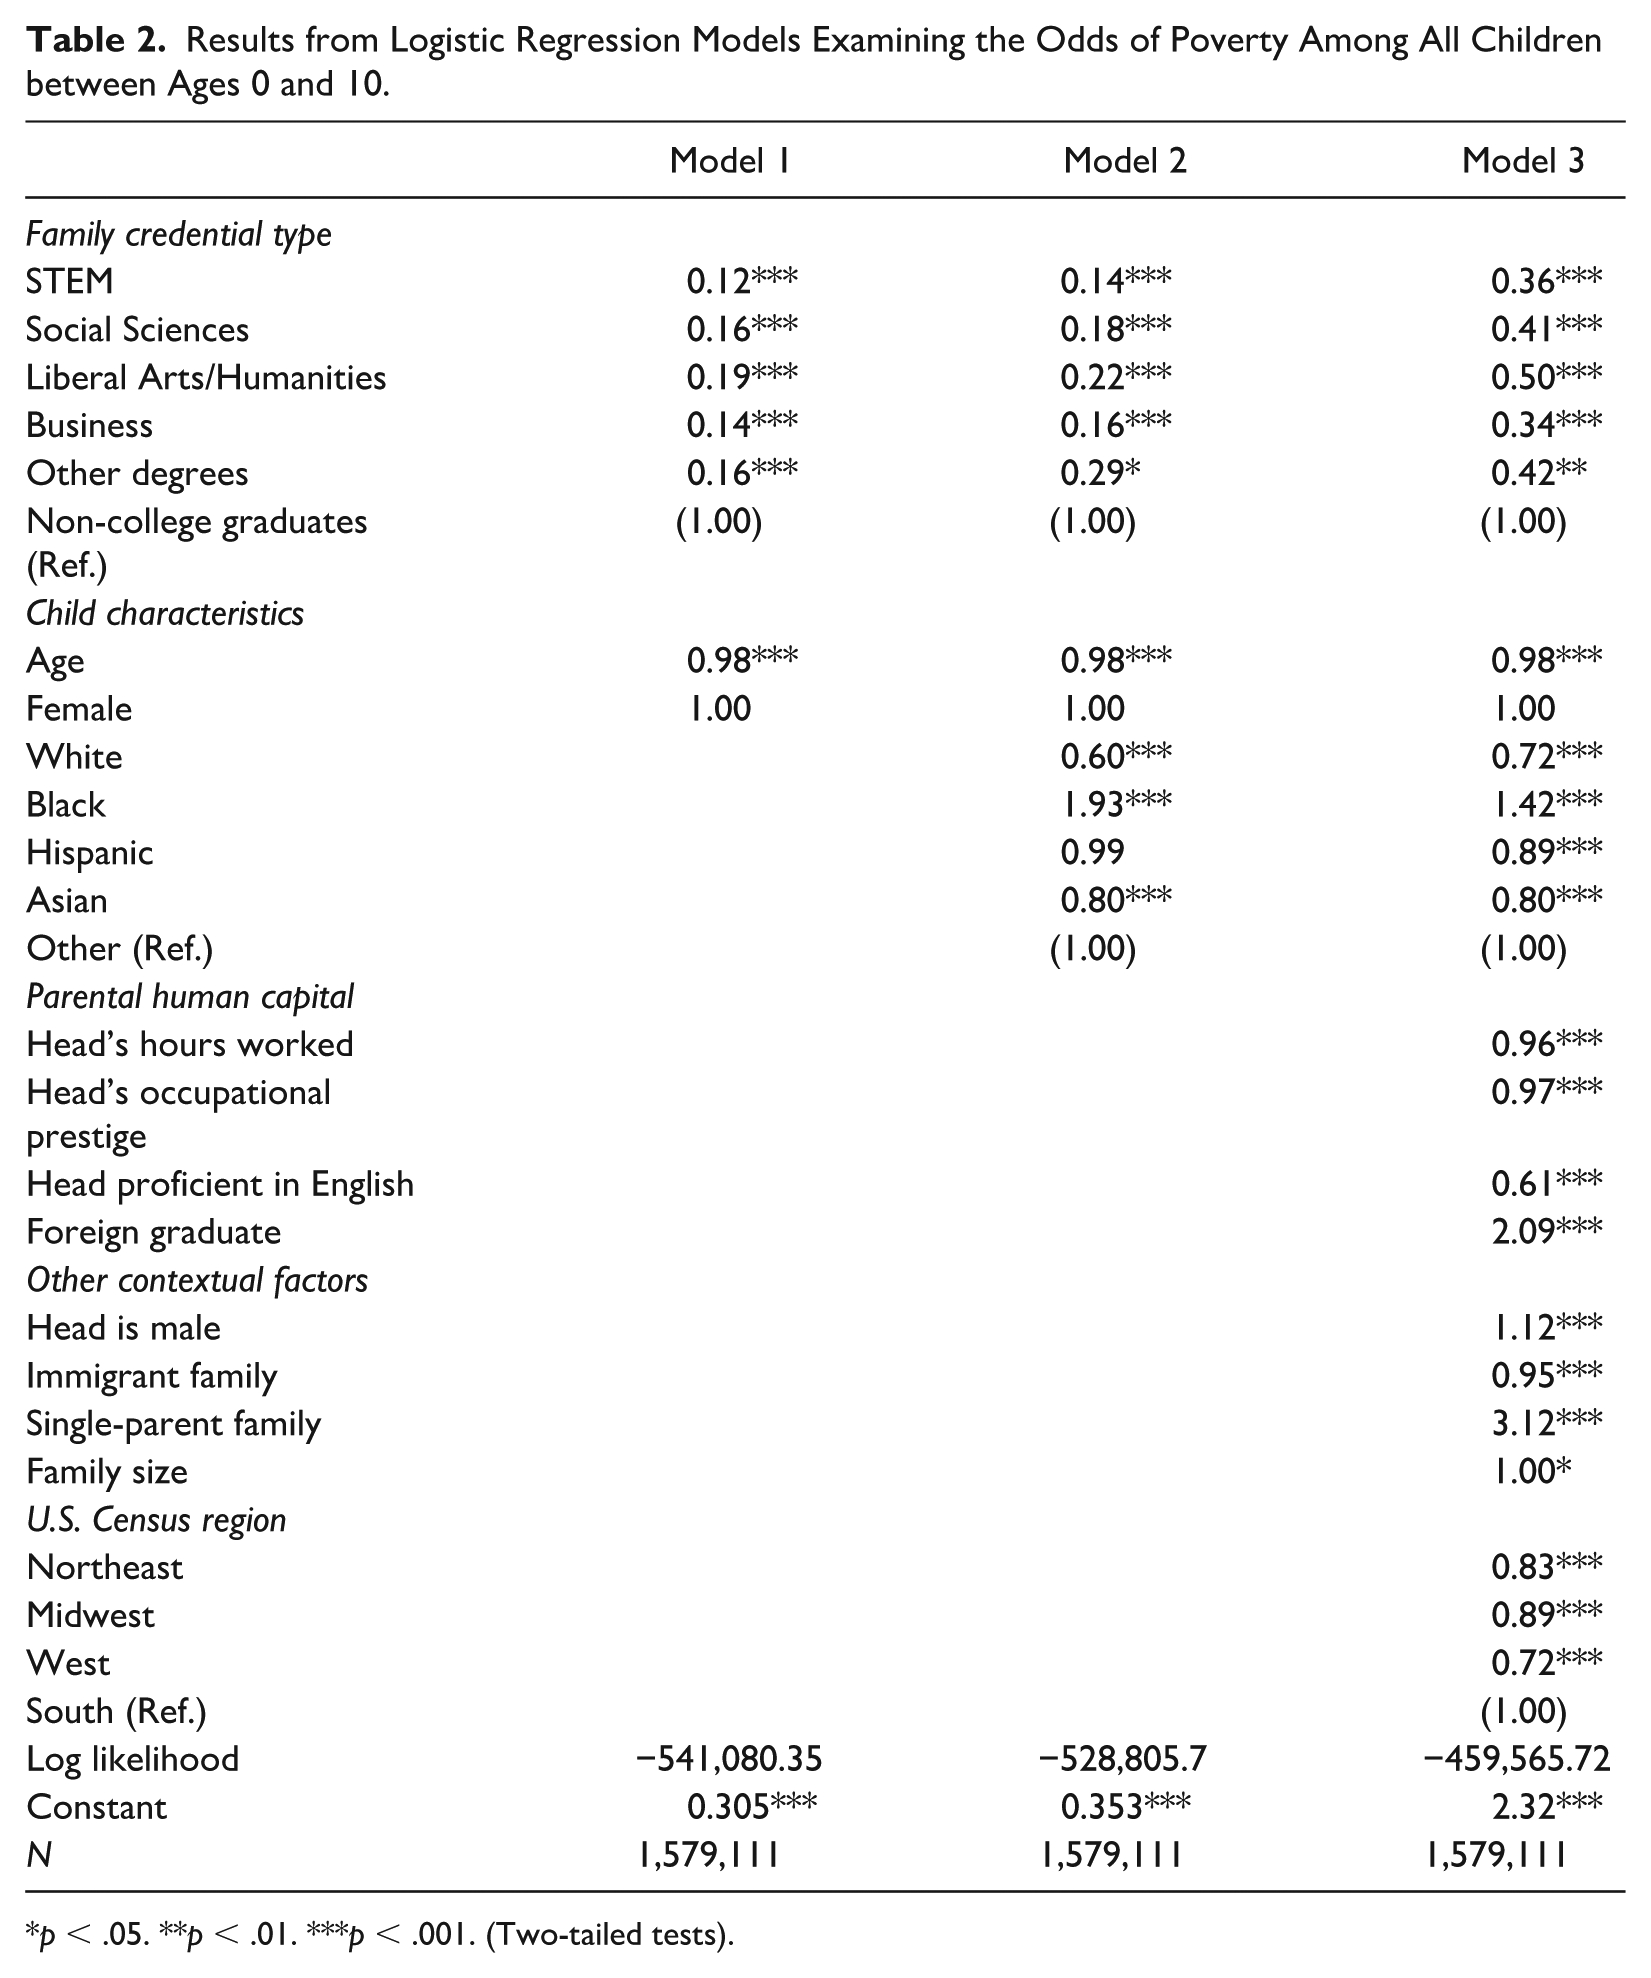
p < .05. **p < .01. ***p < .001. (Two-tailed tests).
A substantial part of the advantage associated with having parents with STEM degrees is explained by differences in other human-capital, household-level factors, and region of residence. Consequently, after accounting for these factors in Model 3, the relative odds of poverty among the children of STEM graduates decline from about 86 percent in Model 2 to 64 percent in Model 3. In addition, the odds of poverty among the children in STEM graduates are no longer indistinguishable from those of the children of business graduates after controlling for other factors in Model 3, p = 0.10; Chi2(1) = 2.68.
Model 3 further illustrates some of the specific ways in which child poverty is shaped by other household and human-capital characteristics. For example, it shows that the odds of child poverty decline by 4 percent as the hours worked by household heads increase, and by 3 percent with overall increases in their level of occupational prestige. After controlling for factors such as living in single-parent families, the odds of poverty are also 12 percent higher in households headed by males compared to those headed by females. In addition, English proficiency among household heads is negatively associated with the odds of child poverty. However, these odds are positively associated with living in single-parent households and having parents with foreign college credentials, but negatively associated with living in regions other than the U.S. South.
Restricting its focus to the sample of children in STEM households, Table 3 presents results from the analysis of the race-ethnic disparities observed in these contexts. Model 1, the baseline model, shows that the lowest odds of living in poverty are found among White children. They are 29 percent less likely to live in poverty compared to their counterparts in other races (i.e., the reference group) and their odds are closely followed by those of Asian children. Model 1 also provides support for the study’s second hypothesis by showing the comparatively higher odds of poverty found among Black and Hispanic children. However, of these two groups of children, the highest odds of poverty are found among Blacks.
Results from Logistic Regression Models Examining the Odds of Poverty among Children between Ages 0 and 10 Living in STEM Households.
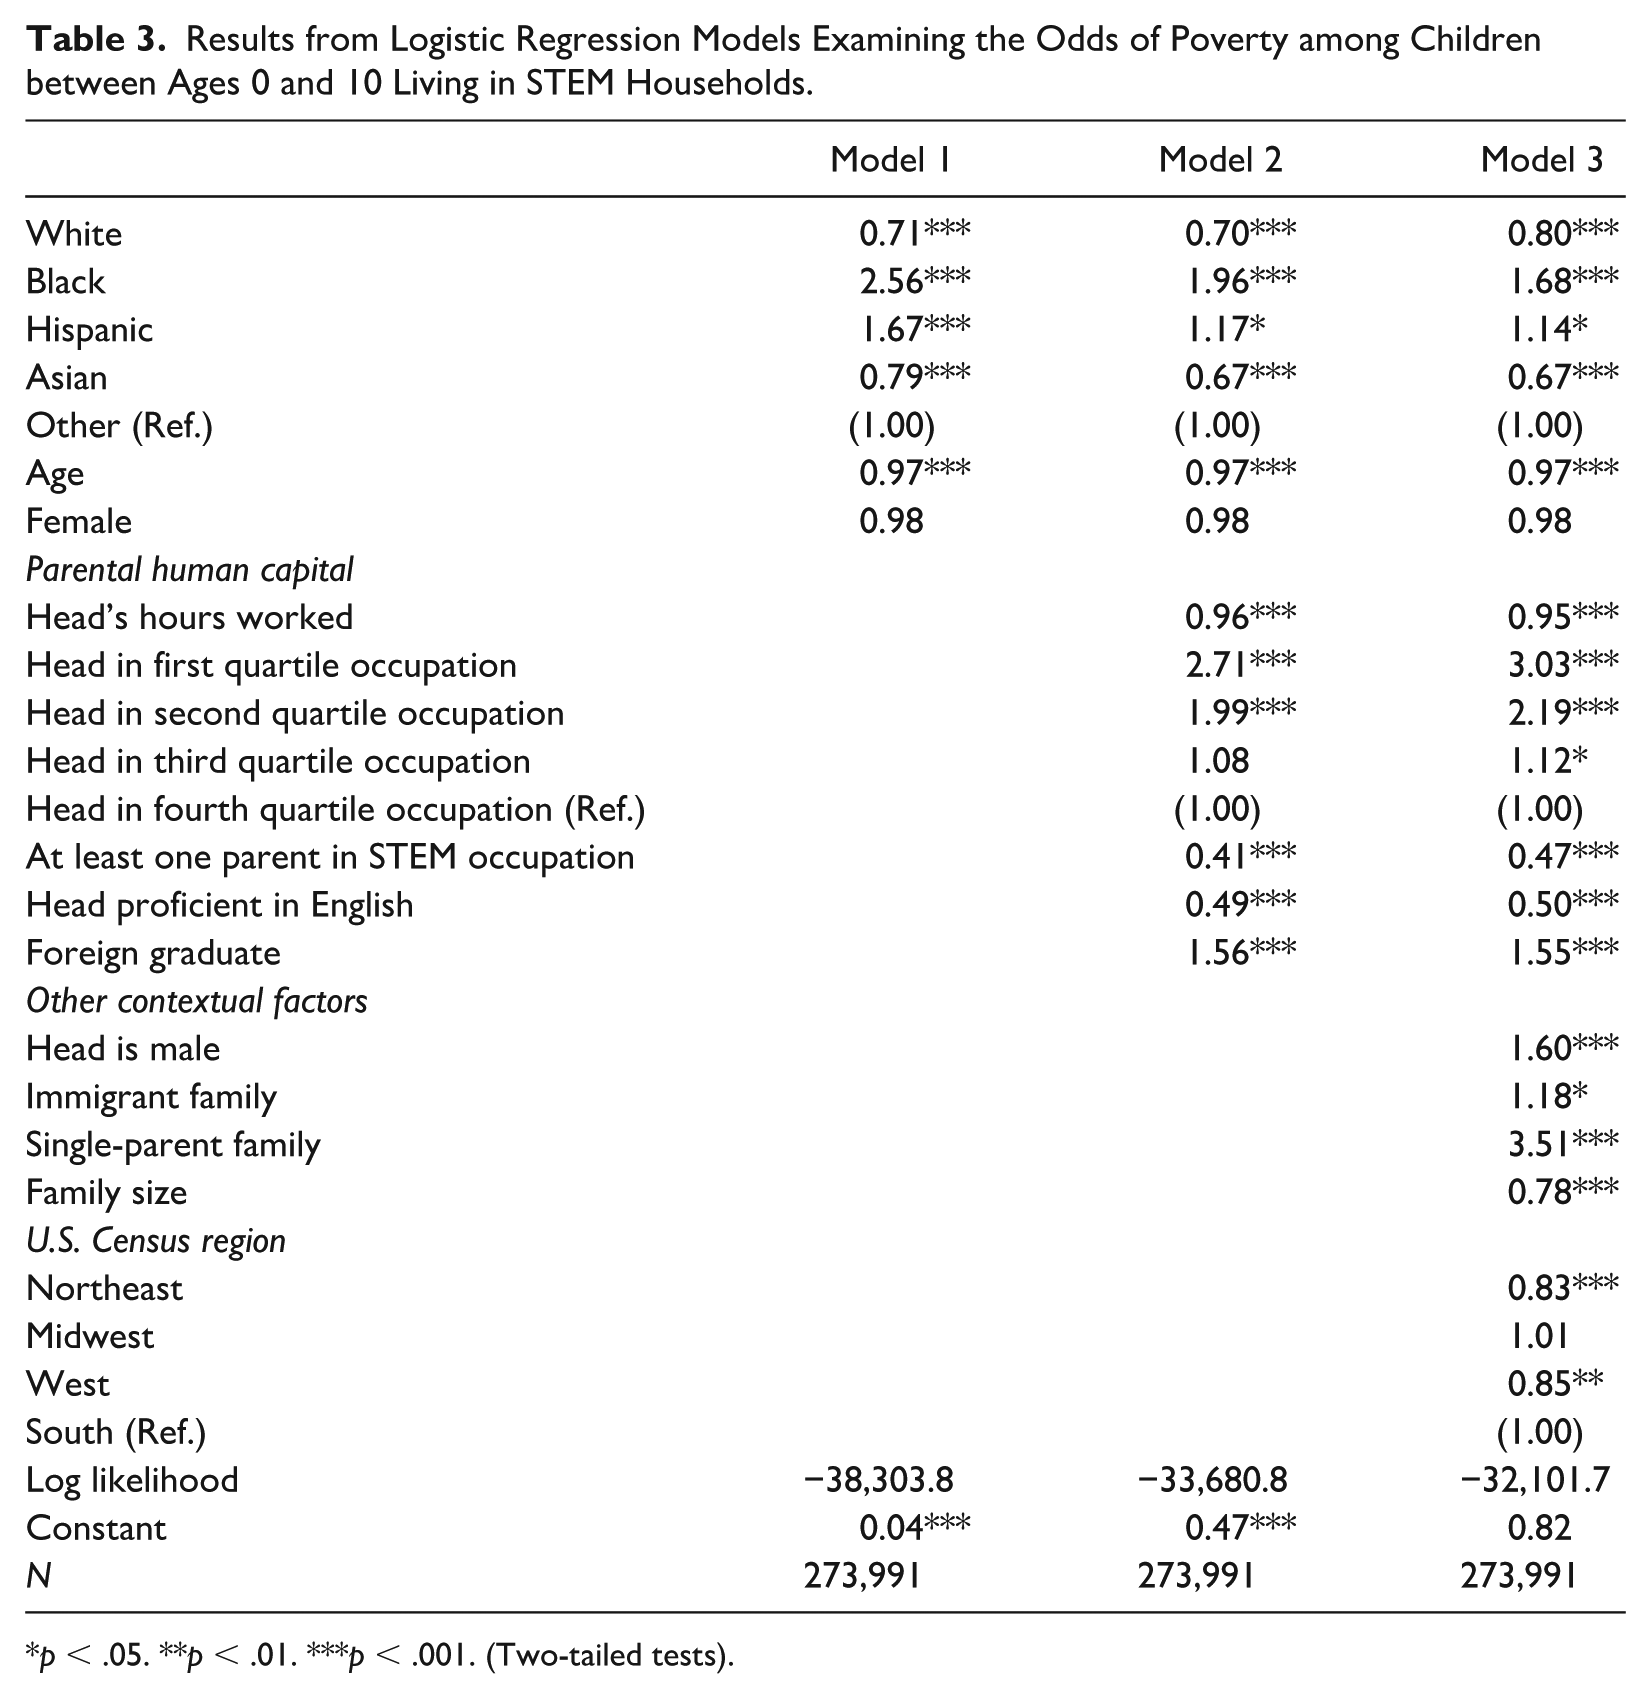
p < .05. **p < .01. ***p < .001. (Two-tailed tests).
Model 2 indicates that the poverty disadvantage of Black and Hispanic children substantially declines after controlling for the human-capital endowments and occupational stratification patterns of their household heads. In fact, the adverse poverty outcomes of these two groups of children continue to persist in Model 3 as do the less adverse poverty outcomes of their White and Asian counterparts. Model 3 also provides the first insight into poverty differences observed between children in immigrant and U.S.-born STEM households. It shows that children in the former are 18 percent more likely to live in poverty compared to children in the latter.
Overall, the results presented so far have two major implications. First, they suggest that the mechanisms that explain the adverse child poverty risks of disadvantaged racial minorities in STEM households are similar for Hispanics and Blacks. However, these factors are only partly responsible for the concentration of poverty among Black children in STEM households given the fact that their highest risk of exposure to poverty persists in all models. Second, the results suggest that having college credentials such as STEM degrees is largely inconsequential to efforts to address traditional patterns of poverty inequalities among children. Indeed, the patterns of child poverty inequality associated with differences in race-ethnicity and immigrant status in the sample are similar to the corresponding inequalities typically observed in the larger U.S. population.
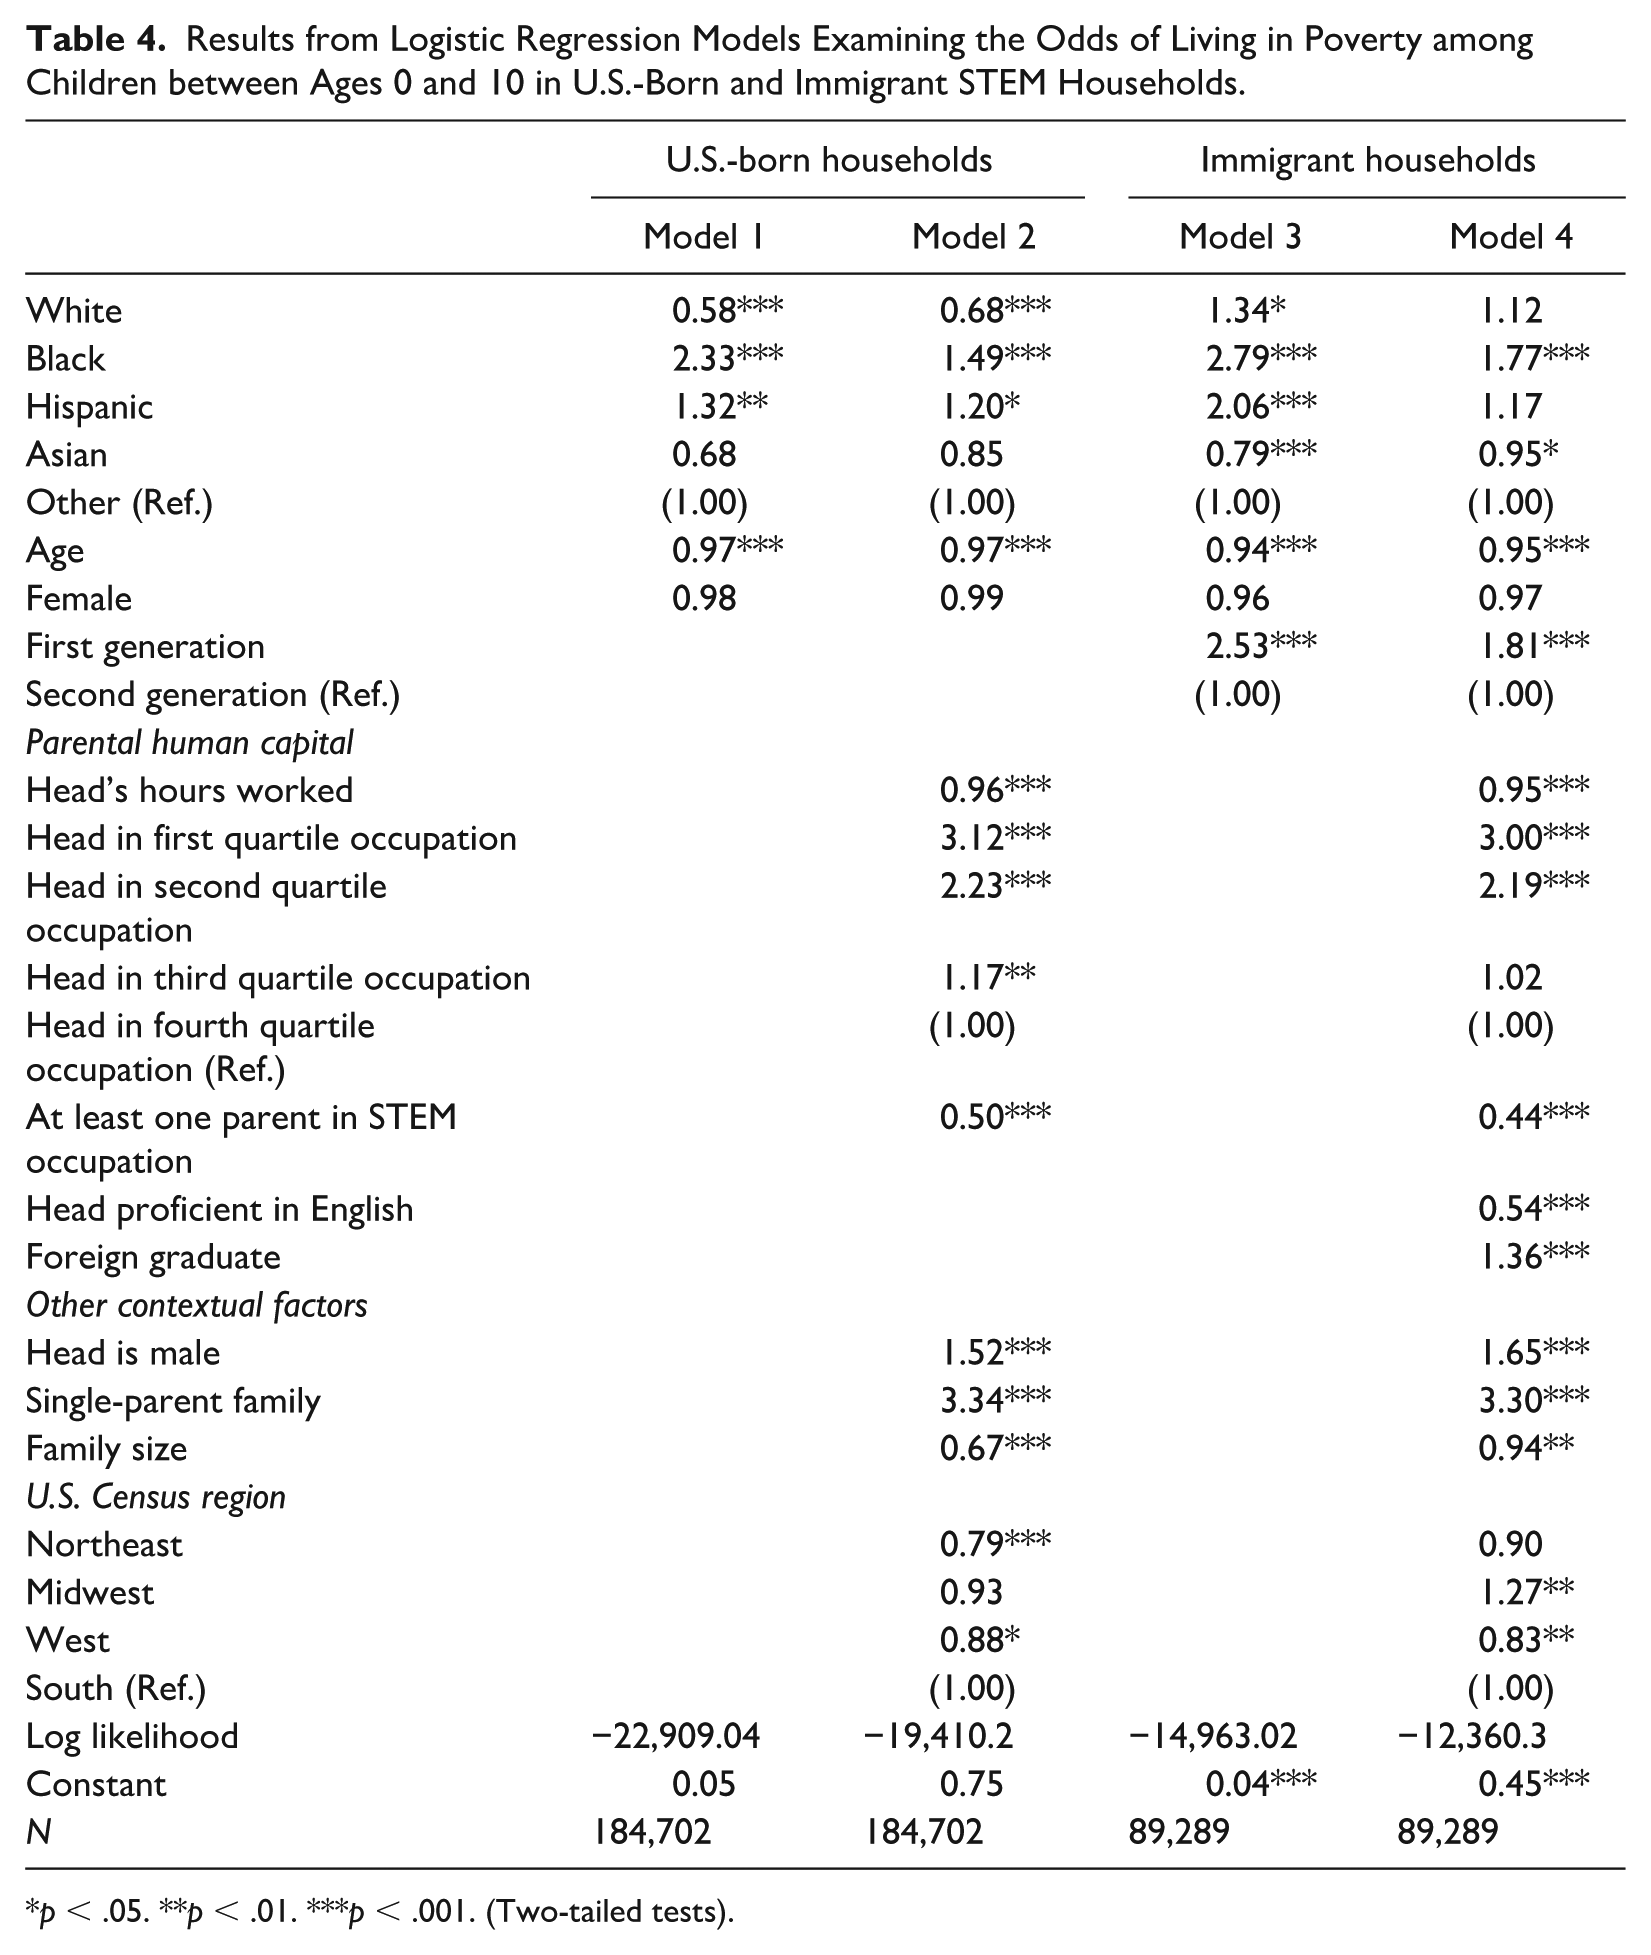
Table 4 investigates whether similar patterns of race-ethnic poverty disparities are observed in U.S.-born and immigrant STEM households. In general, the results show several patterns worth noting. For instance, they show that White children only have the lowest odds of poverty in U.S.-born STEM households (Models 1 and 2). By contrast, there is no corresponding White advantage observed among children in immigrant STEM households (Models 3 and 4). Instead, the lowest odds of child poverty in these contexts are found among Asian immigrants. This finding implies that among immigrants, non-Hispanic Whites (who are mainly from the Middle East, South America, and Eastern and Southern Africa) do not experience the same labor market advantages as those experienced by U.S.-born non-Hispanic Whites in U.S.-born households. In addition, Table 4 indicates that the comparative poverty advantage observed among Asian children is only statistically significant in immigrant STEM households.
Results from Logistic Regression Models Examining the Odds of Living in Poverty among Children between Ages 0 and 10 in U.S.-Born and Immigrant STEM Households.
p < .05. **p < .01. ***p < .001. (Two-tailed tests).
The only consistent pattern of racial stratification shown in Table 4 is that found among Black children. Specifically, the results show that these children have the highest odds of living in poverty in both U.S.-born and immigrant STEM households. A possible implication of this finding is that Black immigrant and U.S.-born STEM graduates experience similar racialized experiences in the labor market. This could limit their ability to use their STEM credentials in ways that best support the economic well-being of their children.
Most of the disparities described above are robust to the influence of the other characteristics of households and the human-capital characteristics of parents (Models 2 and 4). However, Models 2 and 4 provide additional insight into how institutional arrangements and immigrant-specific characteristics can influence children’s exposure to poverty. For example, in both household contexts, household head’s quartile of occupational prestige has a negative association with the odds of child poverty. The same is also true with having parents who are able to match their STEM degrees with employment in actual STEM jobs. Among children in immigrant STEM households (Model 4), the results show that those in the first generation are about twice as likely to be in poverty compared to their second-generation counterparts, and that children whose parents have foreign college credentials are about 36 percent more likely to live in poverty compared to children with U.S. educated parents. These findings indicate that the children of immigrant STEM graduates are exposed to unique economic adversities that are not necessarily experienced by children in U.S.-born STEM families.
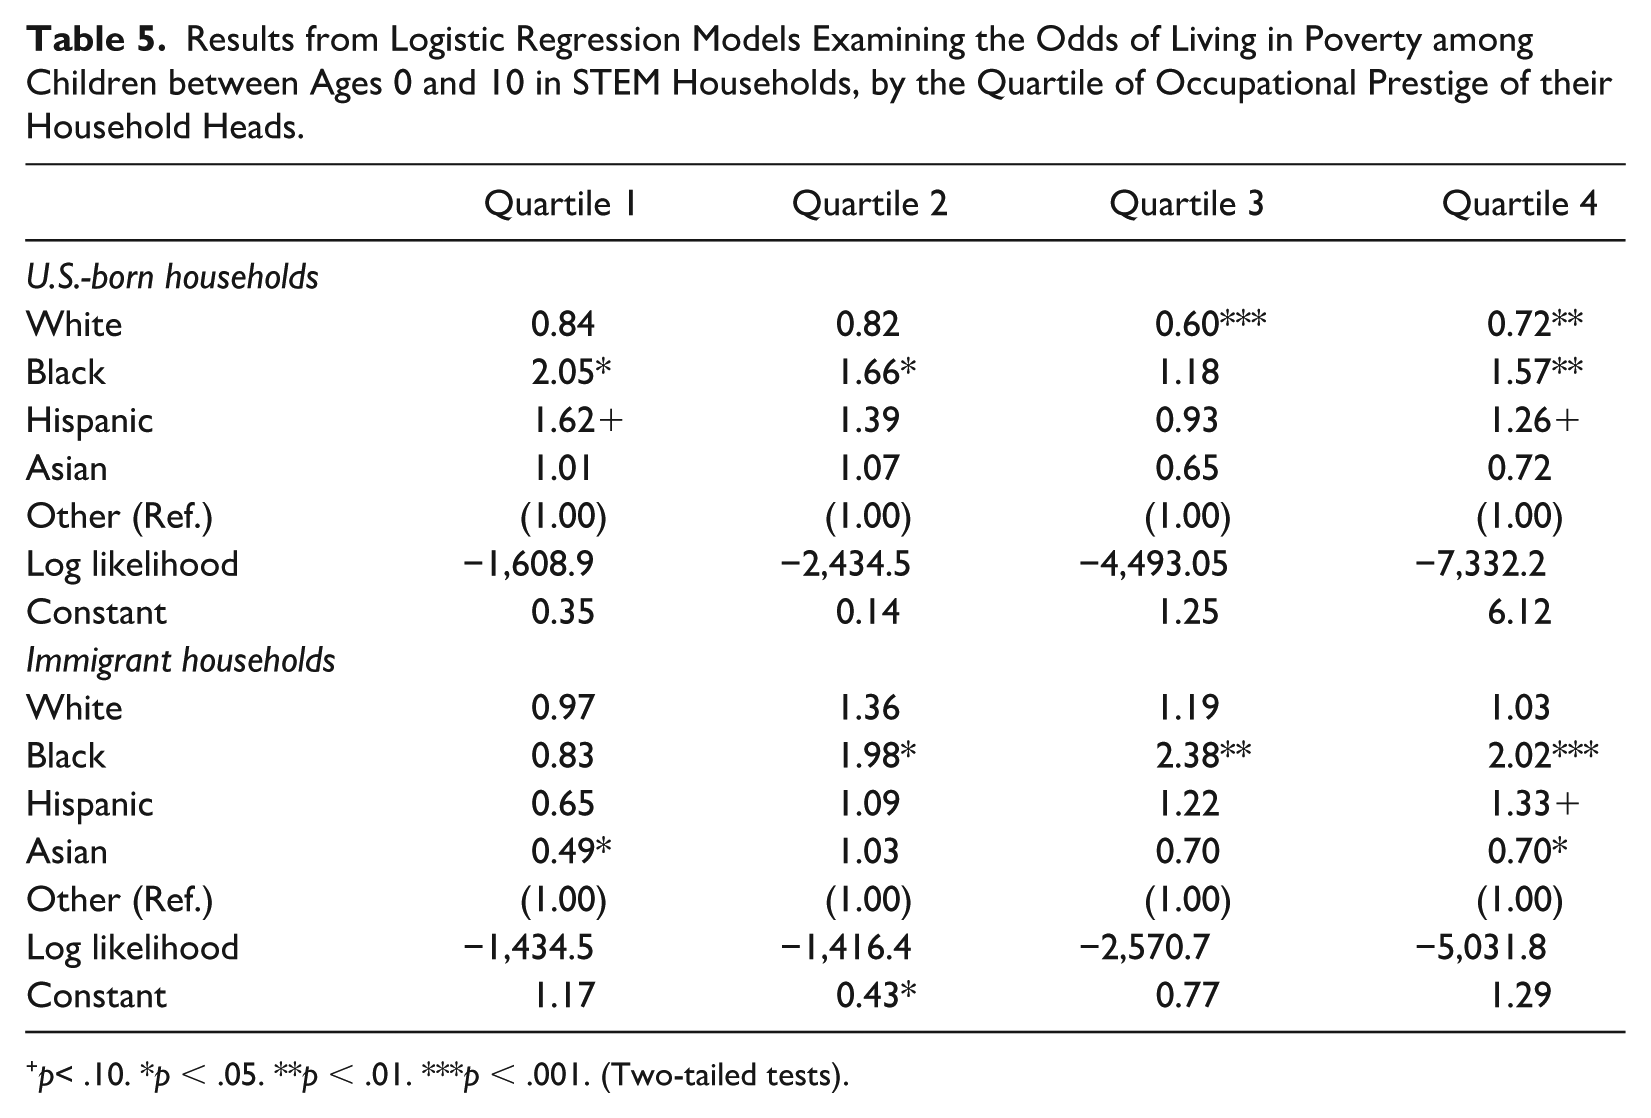
In Table 5, the analysis turns its attention to the examination of whether the adverse outcomes of children from disadvantaged race-ethnic minority groups (i.e., Blacks and Hispanics) are driven by the occupational stratification patterns of STEM graduates. For analytical simplicity, this objective is achieved by focusing only on the outcomes of children in households headed by STEM graduates. Racial and ethnic disparities in child poverty are then examined with models estimated using data for each quartile of occupational prestige. All of these models, however, control for the demographic characteristics of children (e.g., age and sex), the human capital characteristics of household heads, and other household-level attributes.
Results from Logistic Regression Models Examining the Odds of Living in Poverty among Children between Ages 0 and 10 in STEM Households, by the Quartile of Occupational Prestige of their Household Heads.
p< .10. * p < .05. **p < .01. ***p < .001. (Two-tailed tests).
The results in Table 5 provide three important clarifications about the significance of occupational stratification for understanding disparities in poverty among the children of STEM graduates. The first is observed in U.S.-born households (top panel). In these contexts, the less adverse poverty outcomes of White children are concentrated among those whose household heads work in occupations with the highest levels of prestige (i.e., the third and fourth quartiles). In short, having parents who are STEM graduates employed in jobs with the highest levels of occupational prestige is most likely to accentuate the economic advantage of White children compared to that of their non-White peers.
The second clarification is again observed in U.S.-born STEM households, where the disadvantage of race-ethnic minorities is concentrated among children with household heads who have occupations with the lowest levels of occupational prestige (i.e., the first and second quartiles). In these contexts, Black children with household heads in the bottom two occupation quartiles are between 66 and 105 percent more likely to live in poverty compared to other children. For Hispanic children, the relative poverty disadvantage is only observed in the lowest quartile, where they are 62 percent more likely to live in poverty compared to other children. Therefore, the overall pattern of poverty disadvantage observed among children with household heads in the lowest quartiles is more consistent for Blacks. As such, among STEM graduates, employment in jobs with the two lowest levels of occupational prestige is most likely to accentuate the economic disadvantage of Black children compared to that of their non-Black peers. However, a similar Black disadvantage is observed in the highest quartile.
The third clarification on the significance of occupational stratification is found in the patterns observed in immigrant STEM households (i.e., the bottom panel). As Table 5 indicates, the relative poverty disadvantage of Black children is more persistent in immigrant than in U.S.-born STEM households. Among the children of immigrant STEM graduates employed in the second, third, and fourth quartiles of occupational prestige, Black children are consistently twice as likely to live in poverty compared to children in the reference group. In short, in immigrant STEM households, the adverse poverty outcomes of Black children are not necessarily driven by the stratification of STEM graduates into jobs concentrated in one specific end of the occupational distribution. Instead, it is somewhat consistent across occupational strata.
A final perspective on the importance of occupational stratification is provided by predicted probabilities of child poverty in U.S.-born and immigrant households that are, respectively, shown in Figures 2 and 3. These probabilities are estimated from Model 3 in Table 2 and are also based on the educational credentials of household heads. To help put them in perspective, the predicted probabilities for the children in the main race-ethnic groups used in the analysis are compared with those of non-Hispanic White children in the households of non-college graduates.
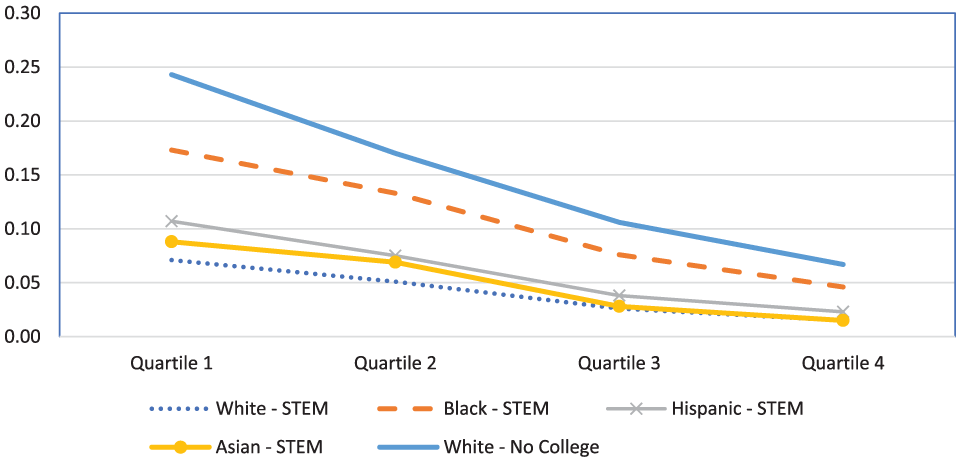
Predicted probabilities of living in poverty among young children in U.S.-born STEM households.
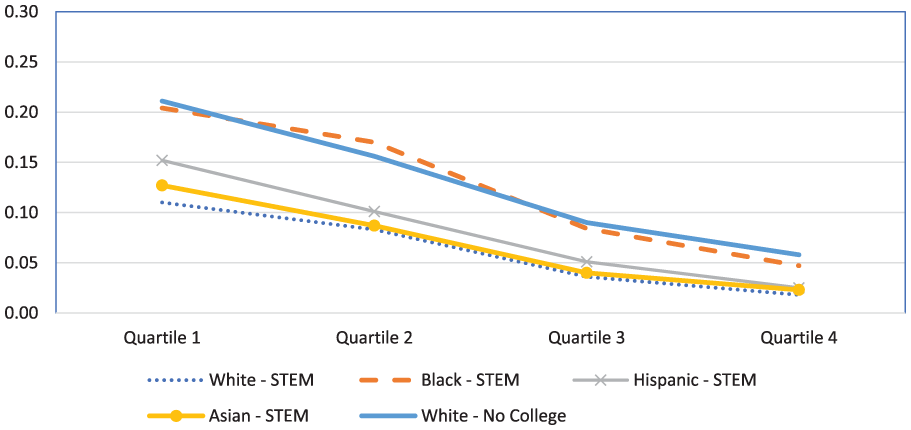
Predicted probabilities of living in poverty among young children in immigrant STEM households.
As shown in both Figures 2 and 3, regardless of whether children live in U.S.-born or immigrant households, race-ethnic disparities in child poverty are greater among the children of STEM graduates in the lowest occupational quartiles than among those in the highest occupational quartiles. However, other distinct patterns are observed in these probabilities. For example, with the exception of the outcomes of Black children, the poverty outcomes of all children of STEM graduates converge to become similar as the occupational quartile of their household heads increases.
More importantly, although the outcomes of Black children of STEM graduates are the most adverse, their exposure to economic adversity takes on an added level of importance in immigrant STEM households than in U.S.-born STEM households. In the former (Figure 3), the poverty outcomes of Black children of STEM graduates are almost identical to—and in the second quartile, worse than—those of White children in households headed by individuals who never went to college. This finding suggests that among children in immigrant households, the economic benefits associated with having parents with STEM degrees among Blacks are no different from those associated with having parents who never went to college among Whites.
Discussion and Conclusion
Most STEM graduates have been able to find economic success in the U.S. labor market in ways that reflect the generally high returns they tend to receive to their human capital (Beutel and Schleifer 2022; NSF 2023). While it is reasonable to expect to observe a corresponding advantage in the economic outcomes of their children, the relationship between the economic outcomes of STEM graduates and those of their children has not been fully explored in previous research. Building on previous research on the children of STEM graduates (e.g., Rozek et al. 2017), however, this study has demonstrated that there is considerable variation in the degree to which the outcomes of STEM graduates can influence the welfare of their children. At the same time, it suggests that inequalities in the transition of STEM graduates into the labor market are at the center of these variations. These inequalities are important because they can contribute to differences in the ability of STEM graduates to use their credentials to enhance the economic well-being of their children. To make its specific arguments, however, the study offers four major insights that help to advance the existing literature.
First, it confirms the hypothesis that the children of STEM graduates are generally less likely to live in poverty compared to children whose parents have other types of educational credentials. However, the poverty advantage observed among the former is only partly explained by differences in parental working hours, occupational prestige, and other household characteristics. This finding suggests that the link between STEM credentials and the economic well-being of children extends beyond the influence of these measurable factors. For example, some studies suggest that STEM graduates may have a labor market advantage linked with the perception that they have an enhanced ability to be innovative and solve real-world problems (NSF 2023; Topsakal, Yalçın, and Çakır 2022). If this is correct, the results also imply that similar processes may also be at work in the families of some non-STEM graduates. This implication is found in results showing that the odds of living in poverty among the children of STEM graduates do not statistically differ from those of the children of business graduates after controlling for other factors (Table 2).
Second, the study indicates that although having parents with STEM degrees buffers the economic welfare of children, it does not eliminate race-ethnic disparities in poverty among children. Accordingly, among the children of STEM graduates, Blacks and Hispanics experience higher levels of poverty compared to Whites and Asians, which confirms the study’s second hypothesis. These findings reflect the same patterns of child poverty inequalities found in the overall U.S. population of children (Gibson-Davis et al. 2021; Heard-Garris et al. 2021). The families of graduates with highly valued educational credentials are thus susceptible to experiencing the same negative consequences of structural disadvantages associated with race as those experienced by other families. For example, a substantial part of the high poverty risks observed among Black and Hispanic children is explained by the inability of their parents to get STEM occupations that match their STEM credentials and their lower levels of occupational prestige. However, these are the same kinds of racial patterns predicted by queuing theory and the same patterns found in studies on the stratification of minorities into low-level occupations (Dias 2023; Zhang 2023).
Third, the analysis underscores the importance of foreign-born/immigrant status in shaping exposure to poverty among the children of STEM graduates. While the foreign-born have played a major role in the recent growth of the U.S. STEM workforce (American Immigration Council 2019), this growth does not appear to have resulted in similar economic gains for children in immigrant and U.S.-born STEM families. Instead, as shown in the analysis, children in immigrant STEM households are more likely to live in poverty compared to children in U.S.-born STEM households. This collective immigrant disadvantage is somewhat surprising because, on average, foreign-born STEM workers have been found to have higher earnings compared to U.S.-born STEM workers (Roach and Skrentny 2021). Yet, as the results suggest, the overall immigrant disadvantage is largely driven by the outcomes of Black children of immigrants, which is consistent with research showing the unique racial barriers experienced by Black immigrants in the U.S. labor market (e.g., Hamilton 2020).
Finally, the study clarifies the role of occupational stratification among STEM graduates in shaping race-ethnic disparities in poverty among their children. These occupational stratification patterns are important to the extent that they are associated with structural conditions that can either facilitate or impair how parental human capital is used to improve the well-being of children. Consistent with the study’s fourth hypothesis, the results show that the stratification of STEM graduates into low-prestige occupations has the most adverse implications for poverty among Black children. This is particularly true of Black children in U.S.-born STEM households. Conversely, in U.S.-born households, the stratification of STEM graduates into the most prestigious occupations has the greatest advantage in terms of buffering children from poverty among White children. However, the most concerning patterns of child poverty by levels of occupational stratification among STEM graduates are observed in immigrant households. In these contexts, the economic disadvantage Black children of STEM graduates is largely robust across occupational strata. Moreover, their probabilities of living in poverty in almost all strata of parental occupational prestige are generally identical to those observed among White children whose parents never graduated from college.
Overall, the study’s main findings have several implications for policy. Among the most important is the need for targeted policies to address racial disparities in the occupational outcomes of STEM graduates. For example, increased efforts to improve the placement of Black and Hispanic STEM graduates in STEM jobs will help to reduce poverty among their children. As the results suggest, the inability of these graduates to secure STEM jobs partly contributes to the economic disadvantage observed among their children. In addition, comparatively higher poverty risks among the children of foreign-born STEM graduates will require systematic attempts to investigate whether their outcomes are linked to challenges encountered by their parents within the U.S. immigration bureaucracy. However, more specific interventions will be needed to address poverty among the children of Black immigrant STEM graduates. These could include policies that increase their parents’ access to opportunities for occupational mobility, which could potentially increase their earnings and increase the economic welfare of their children.
While the study’s main findings are important, however, they need to be understood within the context of several important limitations. For example, they are derived from the analysis of cross-sectional data, which makes it impossible to use them for making causal statements. In addition, cross-sectional data do not allow us to observe parental transitions between jobs. However, these transitions are among the many major determinants of poverty among children (Pohlig 2021). Another limitation of the study is the absence of information on the type of institutions from which STEM graduates received their degrees. Without this information, it is not possible to examine whether part of the poverty disadvantage of Black children could be explained by the disadvantage faced by STEM graduates from HBCUs (Graham 2021). Despite these limitations, the analysis offers critical insights into our understanding of race-ethnic inequalities in the outcomes of the children of STEM graduates. As such, it provides a useful foundation for expanding research on the significance of STEM credentials for the well-being of children.
Footnotes
Appendix A
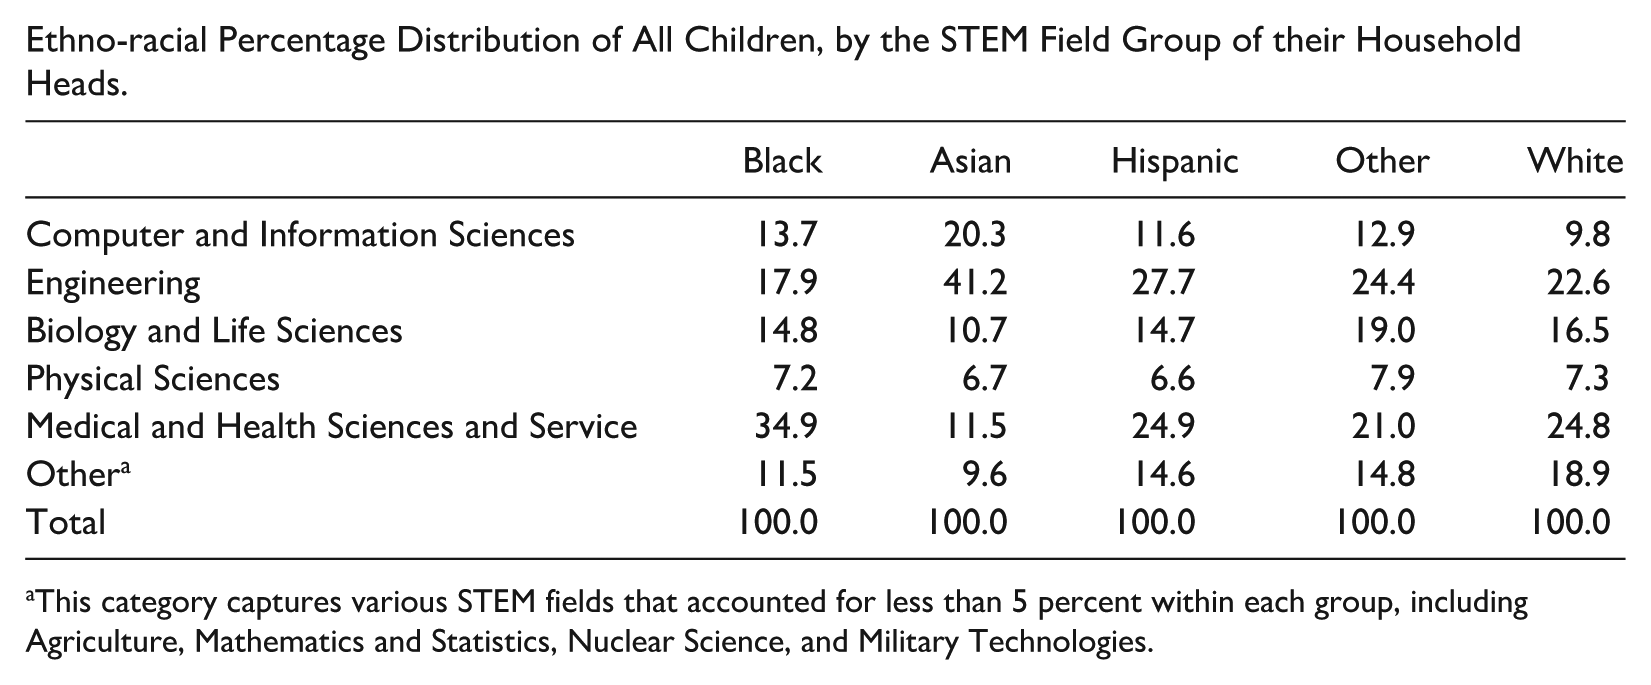
Ethno-racial Percentage Distribution of All Children, by the STEM Field Group of their Household Heads.
| Black | Asian | Hispanic | Other | White | |
|---|---|---|---|---|---|
| Computer and Information Sciences | 13.7 | 20.3 | 11.6 | 12.9 | 9.8 |
| Engineering | 17.9 | 41.2 | 27.7 | 24.4 | 22.6 |
| Biology and Life Sciences | 14.8 | 10.7 | 14.7 | 19.0 | 16.5 |
| Physical Sciences | 7.2 | 6.7 | 6.6 | 7.9 | 7.3 |
| Medical and Health Sciences and Service | 34.9 | 11.5 | 24.9 | 21.0 | 24.8 |
| Other a | 11.5 | 9.6 | 14.6 | 14.8 | 18.9 |
| Total | 100.0 | 100.0 | 100.0 | 100.0 | 100.0 |
This category captures various STEM fields that accounted for less than 5 percent within each group, including Agriculture, Mathematics and Statistics, Nuclear Science, and Military Technologies.
Appendix B
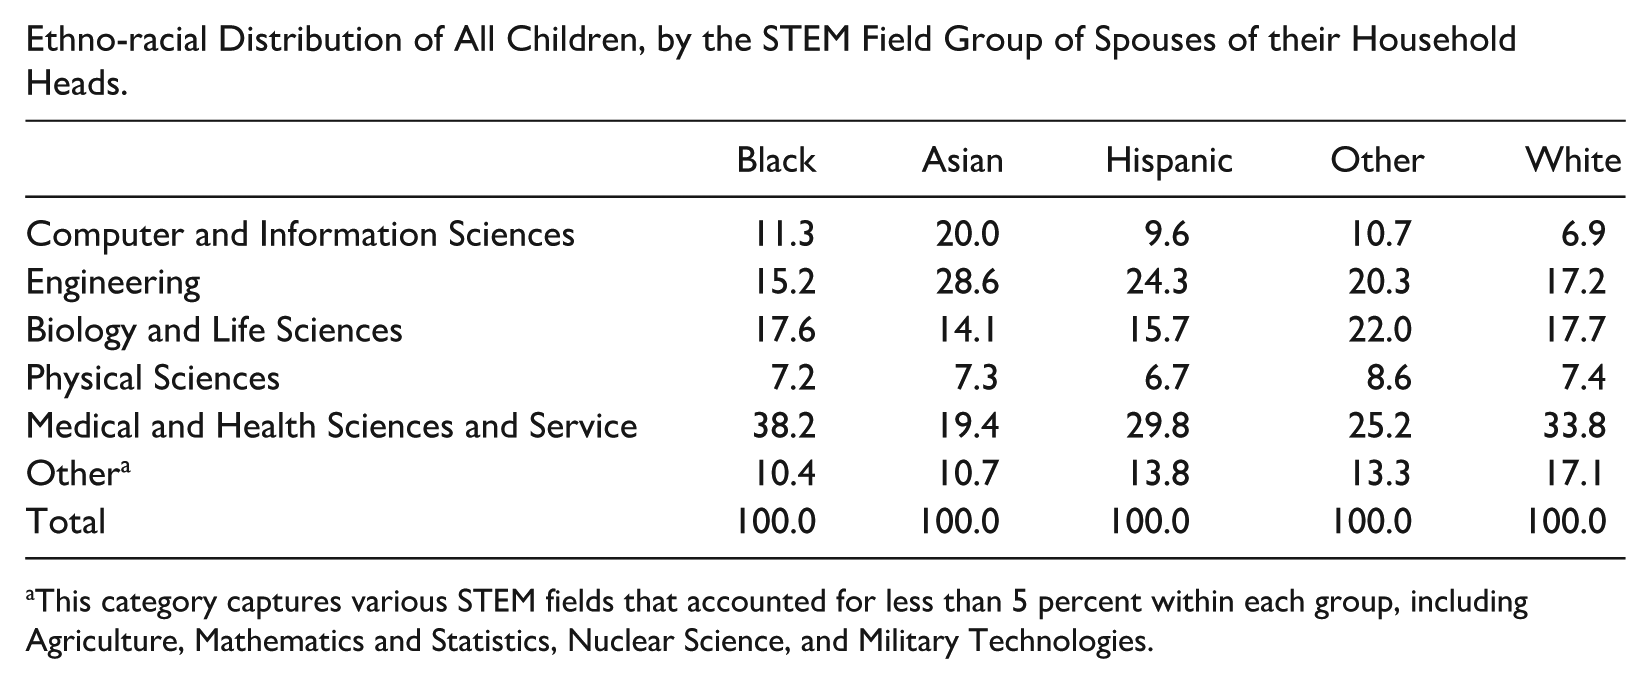
Ethno-racial Distribution of All Children, by the STEM Field Group of Spouses of their Household Heads.
| Black | Asian | Hispanic | Other | White | |
|---|---|---|---|---|---|
| Computer and Information Sciences | 11.3 | 20.0 | 9.6 | 10.7 | 6.9 |
| Engineering | 15.2 | 28.6 | 24.3 | 20.3 | 17.2 |
| Biology and Life Sciences | 17.6 | 14.1 | 15.7 | 22.0 | 17.7 |
| Physical Sciences | 7.2 | 7.3 | 6.7 | 8.6 | 7.4 |
| Medical and Health Sciences and Service | 38.2 | 19.4 | 29.8 | 25.2 | 33.8 |
| Other a | 10.4 | 10.7 | 13.8 | 13.3 | 17.1 |
| Total | 100.0 | 100.0 | 100.0 | 100.0 | 100.0 |
This category captures various STEM fields that accounted for less than 5 percent within each group, including Agriculture, Mathematics and Statistics, Nuclear Science, and Military Technologies.
Appendix C
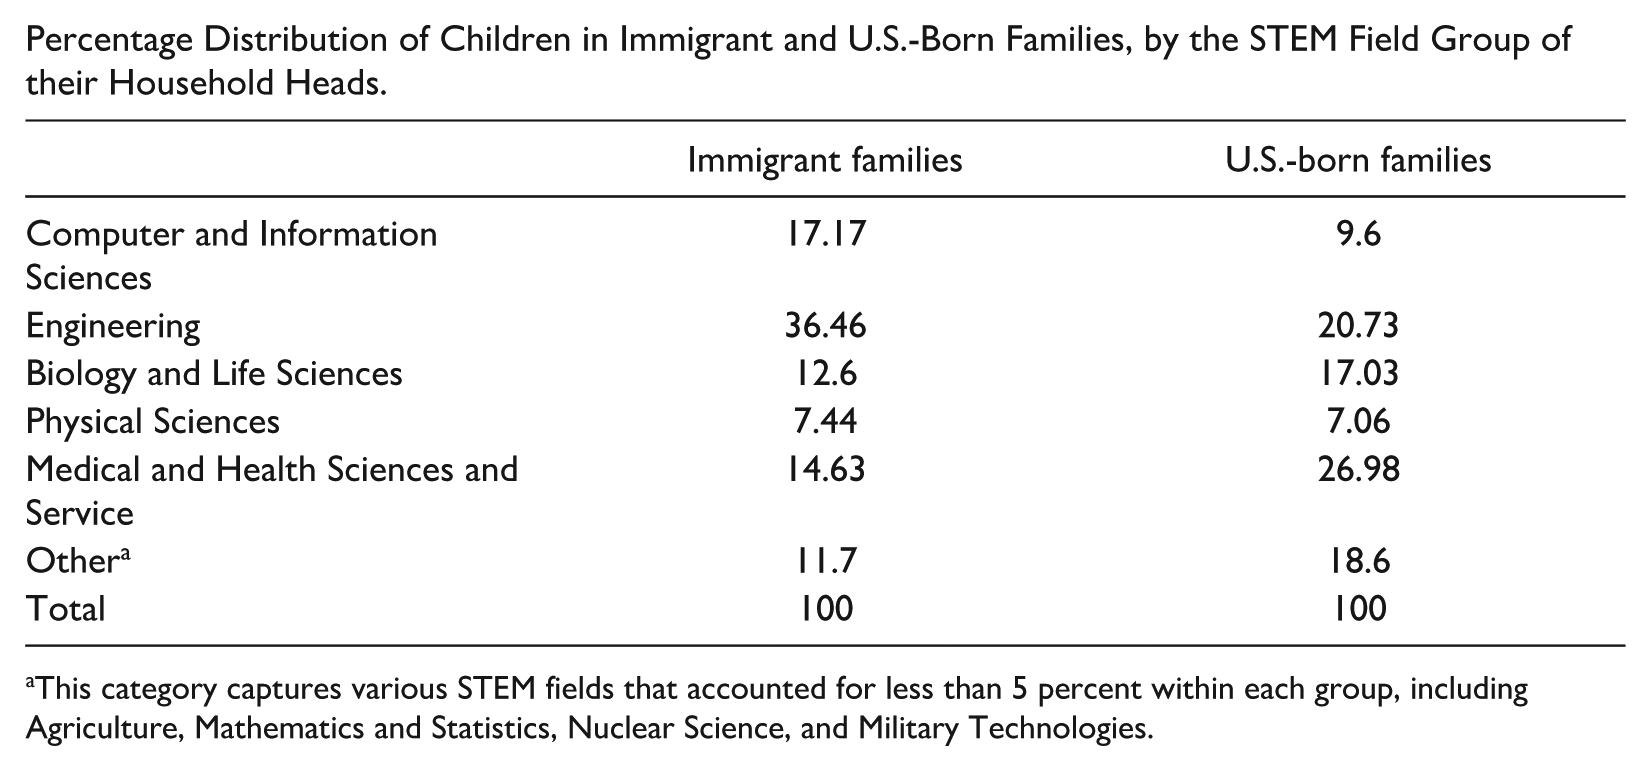
Percentage Distribution of Children in Immigrant and U.S.-Born Families, by the STEM Field Group of their Household Heads.
| Immigrant families | U.S.-born families | |
|---|---|---|
| Computer and Information Sciences | 17.17 | 9.6 |
| Engineering | 36.46 | 20.73 |
| Biology and Life Sciences | 12.6 | 17.03 |
| Physical Sciences | 7.44 | 7.06 |
| Medical and Health Sciences and Service | 14.63 | 26.98 |
| Other a | 11.7 | 18.6 |
| Total | 100 | 100 |
This category captures various STEM fields that accounted for less than 5 percent within each group, including Agriculture, Mathematics and Statistics, Nuclear Science, and Military Technologies.
Appendix D
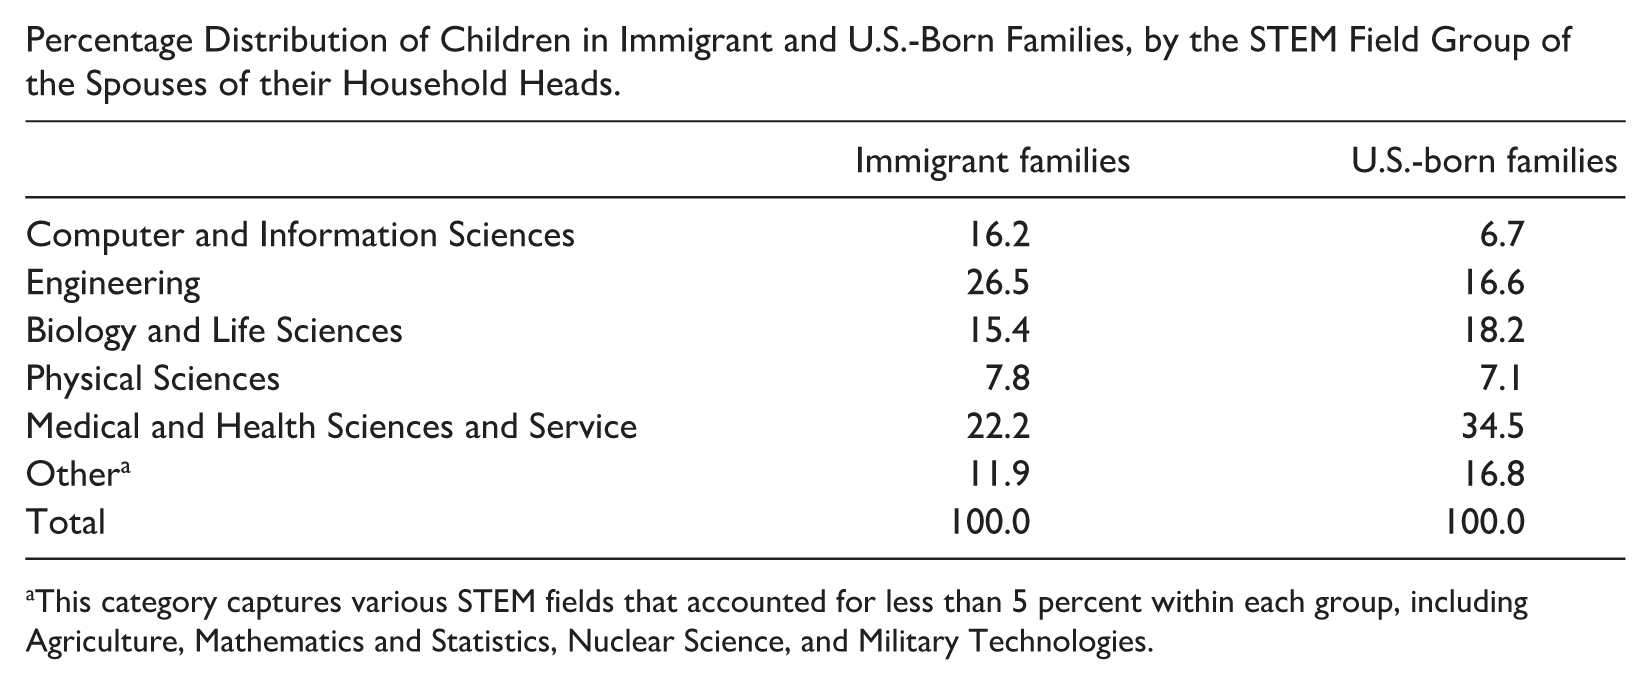
Percentage Distribution of Children in Immigrant and U.S.-Born Families, by the STEM Field Group of the Spouses of their Household Heads.
| Immigrant families | U.S.-born families | |
|---|---|---|
| Computer and Information Sciences | 16.2 | 6.7 |
| Engineering | 26.5 | 16.6 |
| Biology and Life Sciences | 15.4 | 18.2 |
| Physical Sciences | 7.8 | 7.1 |
| Medical and Health Sciences and Service | 22.2 | 34.5 |
| Other a | 11.9 | 16.8 |
| Total | 100.0 | 100.0 |
This category captures various STEM fields that accounted for less than 5 percent within each group, including Agriculture, Mathematics and Statistics, Nuclear Science, and Military Technologies.
Appendix E
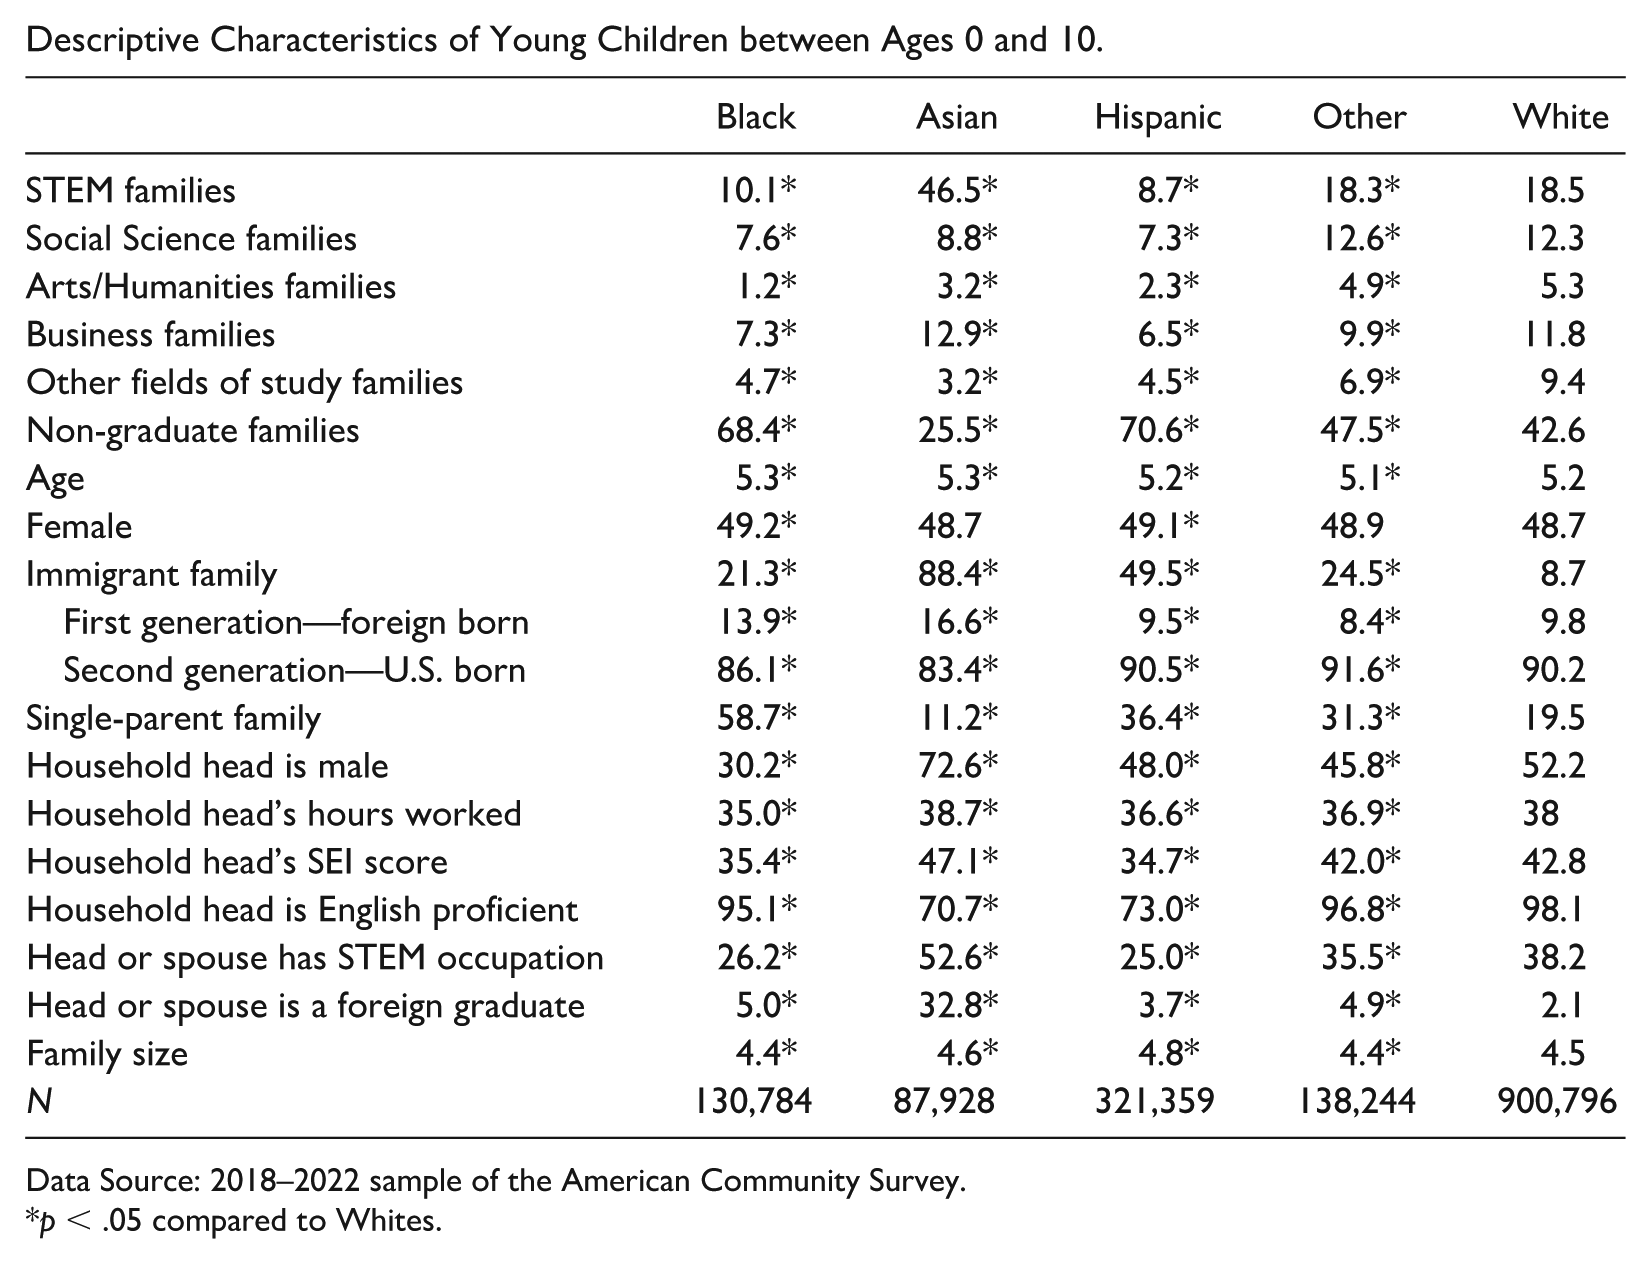
Descriptive Characteristics of Young Children between Ages 0 and 10.
| Black | Asian | Hispanic | Other | White | |
|---|---|---|---|---|---|
| STEM families | 10.1* | 46.5* | 8.7* | 18.3* | 18.5 |
| Social Science families | 7.6* | 8.8* | 7.3* | 12.6* | 12.3 |
| Arts/Humanities families | 1.2* | 3.2* | 2.3* | 4.9* | 5.3 |
| Business families | 7.3* | 12.9* | 6.5* | 9.9* | 11.8 |
| Other fields of study families | 4.7* | 3.2* | 4.5* | 6.9* | 9.4 |
| Non-graduate families | 68.4* | 25.5* | 70.6* | 47.5* | 42.6 |
| Age | 5.3* | 5.3* | 5.2* | 5.1* | 5.2 |
| Female | 49.2* | 48.7 | 49.1* | 48.9 | 48.7 |
| Immigrant family | 21.3* | 88.4* | 49.5* | 24.5* | 8.7 |
| First generation—foreign born | 13.9* | 16.6* | 9.5* | 8.4* | 9.8 |
| Second generation—U.S. born | 86.1* | 83.4* | 90.5* | 91.6* | 90.2 |
| Single-parent family | 58.7* | 11.2* | 36.4* | 31.3* | 19.5 |
| Household head is male | 30.2* | 72.6* | 48.0* | 45.8* | 52.2 |
| Household head’s hours worked | 35.0* | 38.7* | 36.6* | 36.9* | 38 |
| Household head’s SEI score | 35.4* | 47.1* | 34.7* | 42.0* | 42.8 |
| Household head is English proficient | 95.1* | 70.7* | 73.0* | 96.8* | 98.1 |
| Head or spouse has STEM occupation | 26.2* | 52.6* | 25.0* | 35.5* | 38.2 |
| Head or spouse is a foreign graduate | 5.0* | 32.8* | 3.7* | 4.9* | 2.1 |
| Family size | 4.4* | 4.6* | 4.8* | 4.4* | 4.5 |
| N | 130,784 | 87,928 | 321,359 | 138,244 | 900,796 |
Data Source: 2018–2022 sample of the American Community Survey.
p < .05 compared to Whites.
Data Availability
Funding
The authors disclosed receipt of the following financial support for the research, authorship, and/or publication of this article: This research was supported by grant, P2CHD042849, Population Research Center, awarded to the Population Research Center at The University of Texas at Austin by the Eunice Kennedy Shriver National Institute of Child Health and Human Development. The content is solely the responsibility of the author and does not necessarily represent the official views of the National Institutes of Health.