
Abstract
Much research has focused on the relative success of Asian Americans in U.S. higher education, particularly their high rates of enrollment and graduation compared to White Americans. In this research, we investigate one factor that may influence these outcomes: whether Asian American families invest more financially in their children’s college education. Using data from the 2015–2016 National Postsecondary Student Aid Study, we find that Asian American families contribute more not only absolutely but also proportionate to their incomes. This is not due to their greater financial resources but is related to Asian American students’ attendance at more selective institutions. Asian American families may adopt college investment strategies that place more value on selective institutions, perhaps because of perceived intrinsic value, high esteem in their social networks, limited information about other institutions, and/or because they anticipate that such experiences more easily translate into desired occupations.
Since Asian Americans became labeled a “model minority” in the 1960s, researchers have been intrigued by their educational successes. For example, Asian American students have the highest rates of college completion among all racial groups (Shapiro et al. 2017), with 74 percent of those who start at 4-year degree-granting institutions completing their degrees within 7 years compared to 64 percent for White students (U.S. Census Bureau 2016). Studies have explored Asian American families’ saving behaviors for their children’s postsecondary education as one potential mechanism of Asian American students’ postsecondary success (Dondero and Humphries 2016; Ouyang, Hanna, and Kim 2019). This financial planning may influence Asian American students to enroll in college because they perceive they are able to afford it, and may enable their timely completion, as they may enroll in institutions with high graduation rates and/or feel they do not need to stop out or drop out for financial reasons (Elliott and Beverly 2011).
We add to the research on Asian American and White families’ contributions to their children’s college education in three ways. First, instead of reported savings prior to children’s postsecondary enrollment, which may depend on probabilistic assessments about future costs, we analyze actual financial contributions to students’ education. Second, we examine differences in college contributions by Asian American ethnic group, as well as immigration generation. And, finally, we study the reasons Asian American families may differ from White families by looking at two “proximate determinants” of family financial contributions. Like existing research, we consider differences in family resources. But, unlike current research on family contributions to children’s postsecondary education, we also account for the costs of the college experiences of students. Here we focus on the selectivity of institutions, as it is most correlated with costs, connecting the literature on school selectivity with the research on family contributions to education. While studies have documented that Asian American students are more likely to attend selective institutions than White students (Fishman 2021), research has not connected families’ financial investments to the costs of students’ institution choices. Without considering institution costs, we may infer a preference among Asian American families to spend more on children’s education without understanding reasons why they may choose to do so.
Explaining Asian American-White Differences in College Investment
How students pay for college has justifiably received a lot of attention recently. The College Board reports that from 1989–1990 to 2019–2020, after accounting for inflation, the average tuition and fees tripled at public 4-year institutions, and more than doubled at private 4-year and public 2-year institutions (College Board 2019). In 2020–2021, private college tuition in the United States could be higher than $50,000 per year, and public tuition over $10,000 per year. Since the benefits of achieving a 4-year degree are well known (e.g., J. Ma, Pender, and Welch 2019), students struggle to meet these costs, with some suffering from homelessness and food insecurity (Goldrick-Rab 2016). Indeed, research finds that financial hardships are among the primary reasons that students who enroll in college do not complete their degrees (Joo, Durband, and Grable 2008).
Students have limited ways to finance tuition, fees, room and board, and related college expenses. They can (1) receive merit- or need-based scholarships from the institutions themselves or from private foundations; (2) take out federally subsidized or nonsubsidized loans; (3) pay with their own saved earnings or with earnings from work undertaken during their enrollment; or (4) rely on support from their families’ savings, current earnings, and other assets. Much discussion has focused on the amount of debt students take out to finance their college education, particularly because there has been an overall decrease in state support to public universities and in federal aid like Pell Grants and subsidized Stafford Loans over recent decades (College Board 2019). Research finds that Black and Hispanic students assume more debt than White or Asian American students (e.g., Addo, Houle, and Simon 2016; Houle and Addo 2019; Martin and Dwyer 2021).
Some research has also explored financial contributions from families. Much of the existing research, however, focuses on saving behavior before students have begun college. Studies have found variation by family race, with White and Asian American families saving more than Black and Hispanic families (Bandelj and Grigoryeva 2021; Charles, Roscigno, and Torres 2007; Dondero and Humphries 2016). We focus on Asian American and White families in this research, since the literature shows these groups are less likely than Black or Hispanic Americans to rely on loans and may have access to greater family savings.
Financial Resources
We first consider whether financial resources might account for Asian American and White differences in family contributions. Average and median household incomes are higher for Asian Americans (with an average income over $87,000 in 2018) than non-Hispanic White Americans (an average around $71,000 in 2018), with some exceptions (e.g., Vietnamese and other Southeast Asians; Semega et al. 2019:5; Figure 2). First-generation immigrants tend to have lower median incomes than do the U.S.-born, while second-generation immigrants typically earn the most (Portes, Fernández-Kelly, and Haller 2009).
Although median incomes for Asian American families are high, often there are more earners per family, and variation is greater than it is for White families. Asian Americans have been labeled a “heterogeneous minority” because of a bimodal pattern with higher poverty rates than White Americans (Budiman and Ruiz 2021; Xie 2022). While there is diversity among ethnic groups, Asian Americans overall appear to have similar assets to non-Hispanic White households (Patraporn, Ong, and Houston 2009). Immigrant Chinese, Japanese, and Indian Americans tend to have net worth that is even higher than U.S.-born White and U.S.-born Asian Americans (Hao 2004).
Other family features may influence how financial resources are deployed (Korankye and Kalenkoski 2021). Benefiting from multiple earners and economies of scale, married-couple families have been shown to contribute more to their children’s college education (López Turley and Desmond 2011). Asian American families are more likely than White families to be headed by married couples, and Asian American families also have fewer children under 18 years in their households, which means more resources may be available per student (U.S. Census Bureau 2019a).
The Costs of College
A second factor we consider that may be related to family financial contribution is the college experience. What colleges students attend, what they study while they are there, who they meet, and how easily they are able to complete a degree have been investigated as sources of stratification (e.g., Armstrong and Hamilton 2013; Brand and Halaby 2006; Goyette and Mullen 2006). Some students and their families may prefer private, selective, and/or more expensive institutions as ways to secure better experiences, attain higher rates of completion, and perhaps reap better socioeconomic outcomes.
Indeed, selective institutions can confer many benefits to students. For example, selective institutions have high retention and graduation rates. Typically, over 80 percent of students at selective institutions graduate within 6 years compared to less than 60 percent at nonselective institutions (Long 2008). Research on the earnings benefits to attending a selective institution shows mixed results depending on how selectivity is measured and whether differential selection into these institutions is considered. Studies generally find, though, that earnings returns are higher for those that attend the most selective and highly selective institutions, as defined by Barron’s rankings, and that, though modest at first, they tend to grow over time (e.g., Brand and Halaby 2006; Thomas and Zhang 2005; Witteveen and Attewell 2017).
Costs for students vary according to the types of institutions in which they enroll. Public 4-year institutions charge less than do private institutions, with mean tuition and other fees for in-state students at around $10,000 in 2019 (and around $27,000 for out-of-state students). Private 4-year institutions, however, charge over $36,000 for tuition and fees (College Board 2019). Costs vary across private institutions as well, with more selective institutions typically having higher “sticker prices.” Columbia University, the University of Chicago, and Amherst College charged between $58,000 and $62,000 for tuition and fees in 2019–2020, much higher than the $36,000 nationwide average for all private universities (U.S. News & World Report 2019). Families with good information may know that many students do not pay these “sticker prices,” but financial awards to particular families that combine merit- and need-based aid can vary substantially across institutions. A greater proportion of students at selective institutions pay full price than at other institutions, however. Over half of students at Brown and Harvard, for instance, pay full price compared to about 40 percent of students at public, 4-year schools (Kantrowitz 2017).
Previous research finds that Asian Americans are the most likely of all racial and ethnic groups to apply to and enroll in selective colleges and universities (An 2010; Ayalon et al. 2008; Carnevale and Rose 2004; Fishman 2021). Asian American students are also more likely than White students to apply to and enroll in “reach” institutions, which are defined as those institutions for which students’ Scholastic Assessment Test (SAT) or American College Test (ACT) scores are in the 25th percentile for the overall student body (Mullen and Goyette 2019). This suggests that Asian Americans may be seeking to maximize the prestige of their college degree, relative to their own qualifications.
We account for two other factors that may be associated with family investment in college and with a student’s college experience. We do not specify a causal direction between these factors and family investment, however. One is use of financial aid. Asian American families may utilize less financial aid from formal institutions. Lower prestige institutions may award merit aid to high-performing students to recruit them. Asian American families may decline these offers with an eye toward maximizing institutional prestige at other institutions. It is also possible that aid is offered to Asian American students at a lower rate than it is to White students, as admissions offices may recruit students differentially by race or ethnicity. Some earlier research has found that Asian American and White families do not significantly differ in their financial aid and loan offers (Kane and Spizman 1994), while other research shows descriptively that Asian American students receive fewer offers of grant aid from their first-choice institutions (D. Kim 2004). This same research also shows aid is less important for Asian American students’ college choices than it is for other racial groups (D. Kim 2004).
A second factor that may be associated with family investment, but which is not necessarily causal in nature, is whether or not (or how much) a student works while in college. Although some paid work has been shown to have a negligible effect on student grade point average and retention, and may even be beneficial, there is consensus that working over 20 hours per week negatively affects student outcomes (Choi 2018; Logan, Hughes, and Logan 2016). Asian American students may be engaged in less paid work than are White students (Baker and Robnett 2012).
Immigrant Generation, Ethnicity, and College Investment
In this research, we also consider heterogeneity among Asian Americans in college financial investments. First, we disaggregate Asian Americans by immigrant generation. Many of the countries of origin of recent-immigrant Asian Americans (e.g., South Korea, China, and Vietnam) are among the highest scorers on international exams like the Program for International Student Assessment (PISA) and the Trends in International Mathematics and Science Study (TIMSS) (Bozick, Malchiodi, and Miller 2016). The education systems in these countries are notoriously competitive, with students studying all day in school and then continuing their studies in “cram schools” or other “shadow education” institutions until late into the night (e.g., Park, Byun, and Kim 2011; Zhang and Xie 2016). In these countries, education is the single most important vehicle of social mobility. Families in these countries are expected to invest in private shadow education for their children and may limit their fertility and career options to invest in the education of their children (e.g., Sun 2012). There is evidence that some of these practices are carried to the United States by immigrants from these countries, as children of East Asian origin utilize “test prep” services more than other groups (Byun and Park 2012).
What is particularly striking when comparing East Asian countries to the United States is that the desire to pursue social mobility through education is not limited to high-socioeconomic status (SES) parents but remains strong across the entire spectrum of family socioeconomic backgrounds (Li and Xie 2020). In the U.S. context, Airan Liu and Yu Xie (2016) report that education-related beliefs and behaviors are much less differentiated by family SES among Asian American students than among White students. It is thus likely that Asian American immigrant families, regardless of SES, perceive education as the most desirable channel for social mobility. If the culture of one’s immigrating origin plays a role, we expect a gradient by immigrant generation, with later generations resembling White Americans more closely than those of more recent generations.
Next, we consider differences by Asian American ethnic group. It is possible that groups with higher proportions of recent immigrants who come from countries with highly competitive education systems, like China and Korea, will invest more, absolutely or proportionally, in their children’s postsecondary education. Ethnic groups also differ by immigration experiences, cultures of origin, dominant religious affiliations, socioeconomic profiles in the United States, and a host of other factors.
Data and Methods
We draw on data from the National Postsecondary Student Aid Study (NPSAS) conducted by the U.S. Department of Education’s National Center for Education Statistics in 2015–2016, which is a nationally representative survey of undergraduate and graduate students who are eligible to participate in federal financial aid programs. NPSAS covers comprehensive topics pertaining to student enrollment in postsecondary education, including how students and their families pay for postsecondary education (Wine, Siegel, and Stollberg 2018).
The NPSAS sample in 2015–2016 consists of about 89,000 undergraduate students in total. The sample represents approximately 20 million undergraduate students enrolled in postsecondary education at Title IV-eligible postsecondary institutions (Radwin et al. 2018). 1 For the purposes of this study, we restrict our analytical sample to the 40,717 dependent undergraduate students, 2 among whom 3,878 are Asian American students and 28,874 are White students. We restrict the sample to dependent students for both theoretical and practical reasons. First, compared to independent students, dependent students are more likely to rely on their parents’ financial support to pay for college. Second, we attempt to examine the relationship between parents’ SES and their contribution to their children’s college costs. For independent students, we are unable to obtain parental information such as parents’ income. Furthermore, as our focus is on differences in financial investment between Asian American and White families, we also drop foreign students with visas (N = 920). The final analytical sample size is 31,832, with 3,317 Asian American and 28,515 White students.
The key dependent variable in this research is the amount of parental financial support. To simplify interpretations of regression coefficients, we follow the practice of other studies (Pyne and Grodsky 2020) and use a linearized measure of parental financial support specified in U.S. dollars. In NPSAS, parental financial support is reported via a range of categories instead of a specific number. We first take the logged transformation of the starting point and end point of each range, then calculate the average value of each range as the linearized approximation. We also generate a ratio, calculated as the amount of parental financial support divided by parents’ annual income in 2015–2016. As a robustness check, we take the average value of each range of absolute financial support as the linearized estimation and use it as an alternative dependent variable. Our results, available upon request, remain the same with this alternative measure.
We focus on two sets of explanatory variables: the availability of family resources and school selectivity. We use parents’ marital status, education, and income to measure the availability of family resources. A serious limitation of NPSAS for our research is that it does not include measures of family assets or wealth. While previous research shows that Asian Americans as a whole have net worth that is similar to that of White Americans, information on assets would allow us to better gauge how much financial resources matter to investment behavior across particular ethnic groups and immigration generations. Future research should consider this (Hao 2004; Patraporn, Ong, and Houston 2009). Parents’ marital status is classified as married, single, divorced/separated, and widowed. Parents’ education is operationalized as the highest level of education achieved by a parent, stepparent, or guardian of the student, classified as high school or less, technical college or some college, bachelor’s degree, and master’s degree or higher. Total income of parents is primarily based on the 2015–2016 Free Application for Federal Student Aid data. 3 Income is measured in 2014 U.S. dollars, which was converted based on the consumer price index. To account for nonlinearity, we use dummy variables for income deciles.
We use two variables to capture school selectivity. The type of institution the student attended in the past year is categorized as a public, private nonprofit, or private for-profit institution, or multiple institutions. NPSAS 2015–2016 provided a comprehensive measure of the level of selectivity of the institutions that students attended. 4 Descriptive statistics for Asian American and White students are presented in Table 1.
Descriptive Statistics for Asian American and White Students.
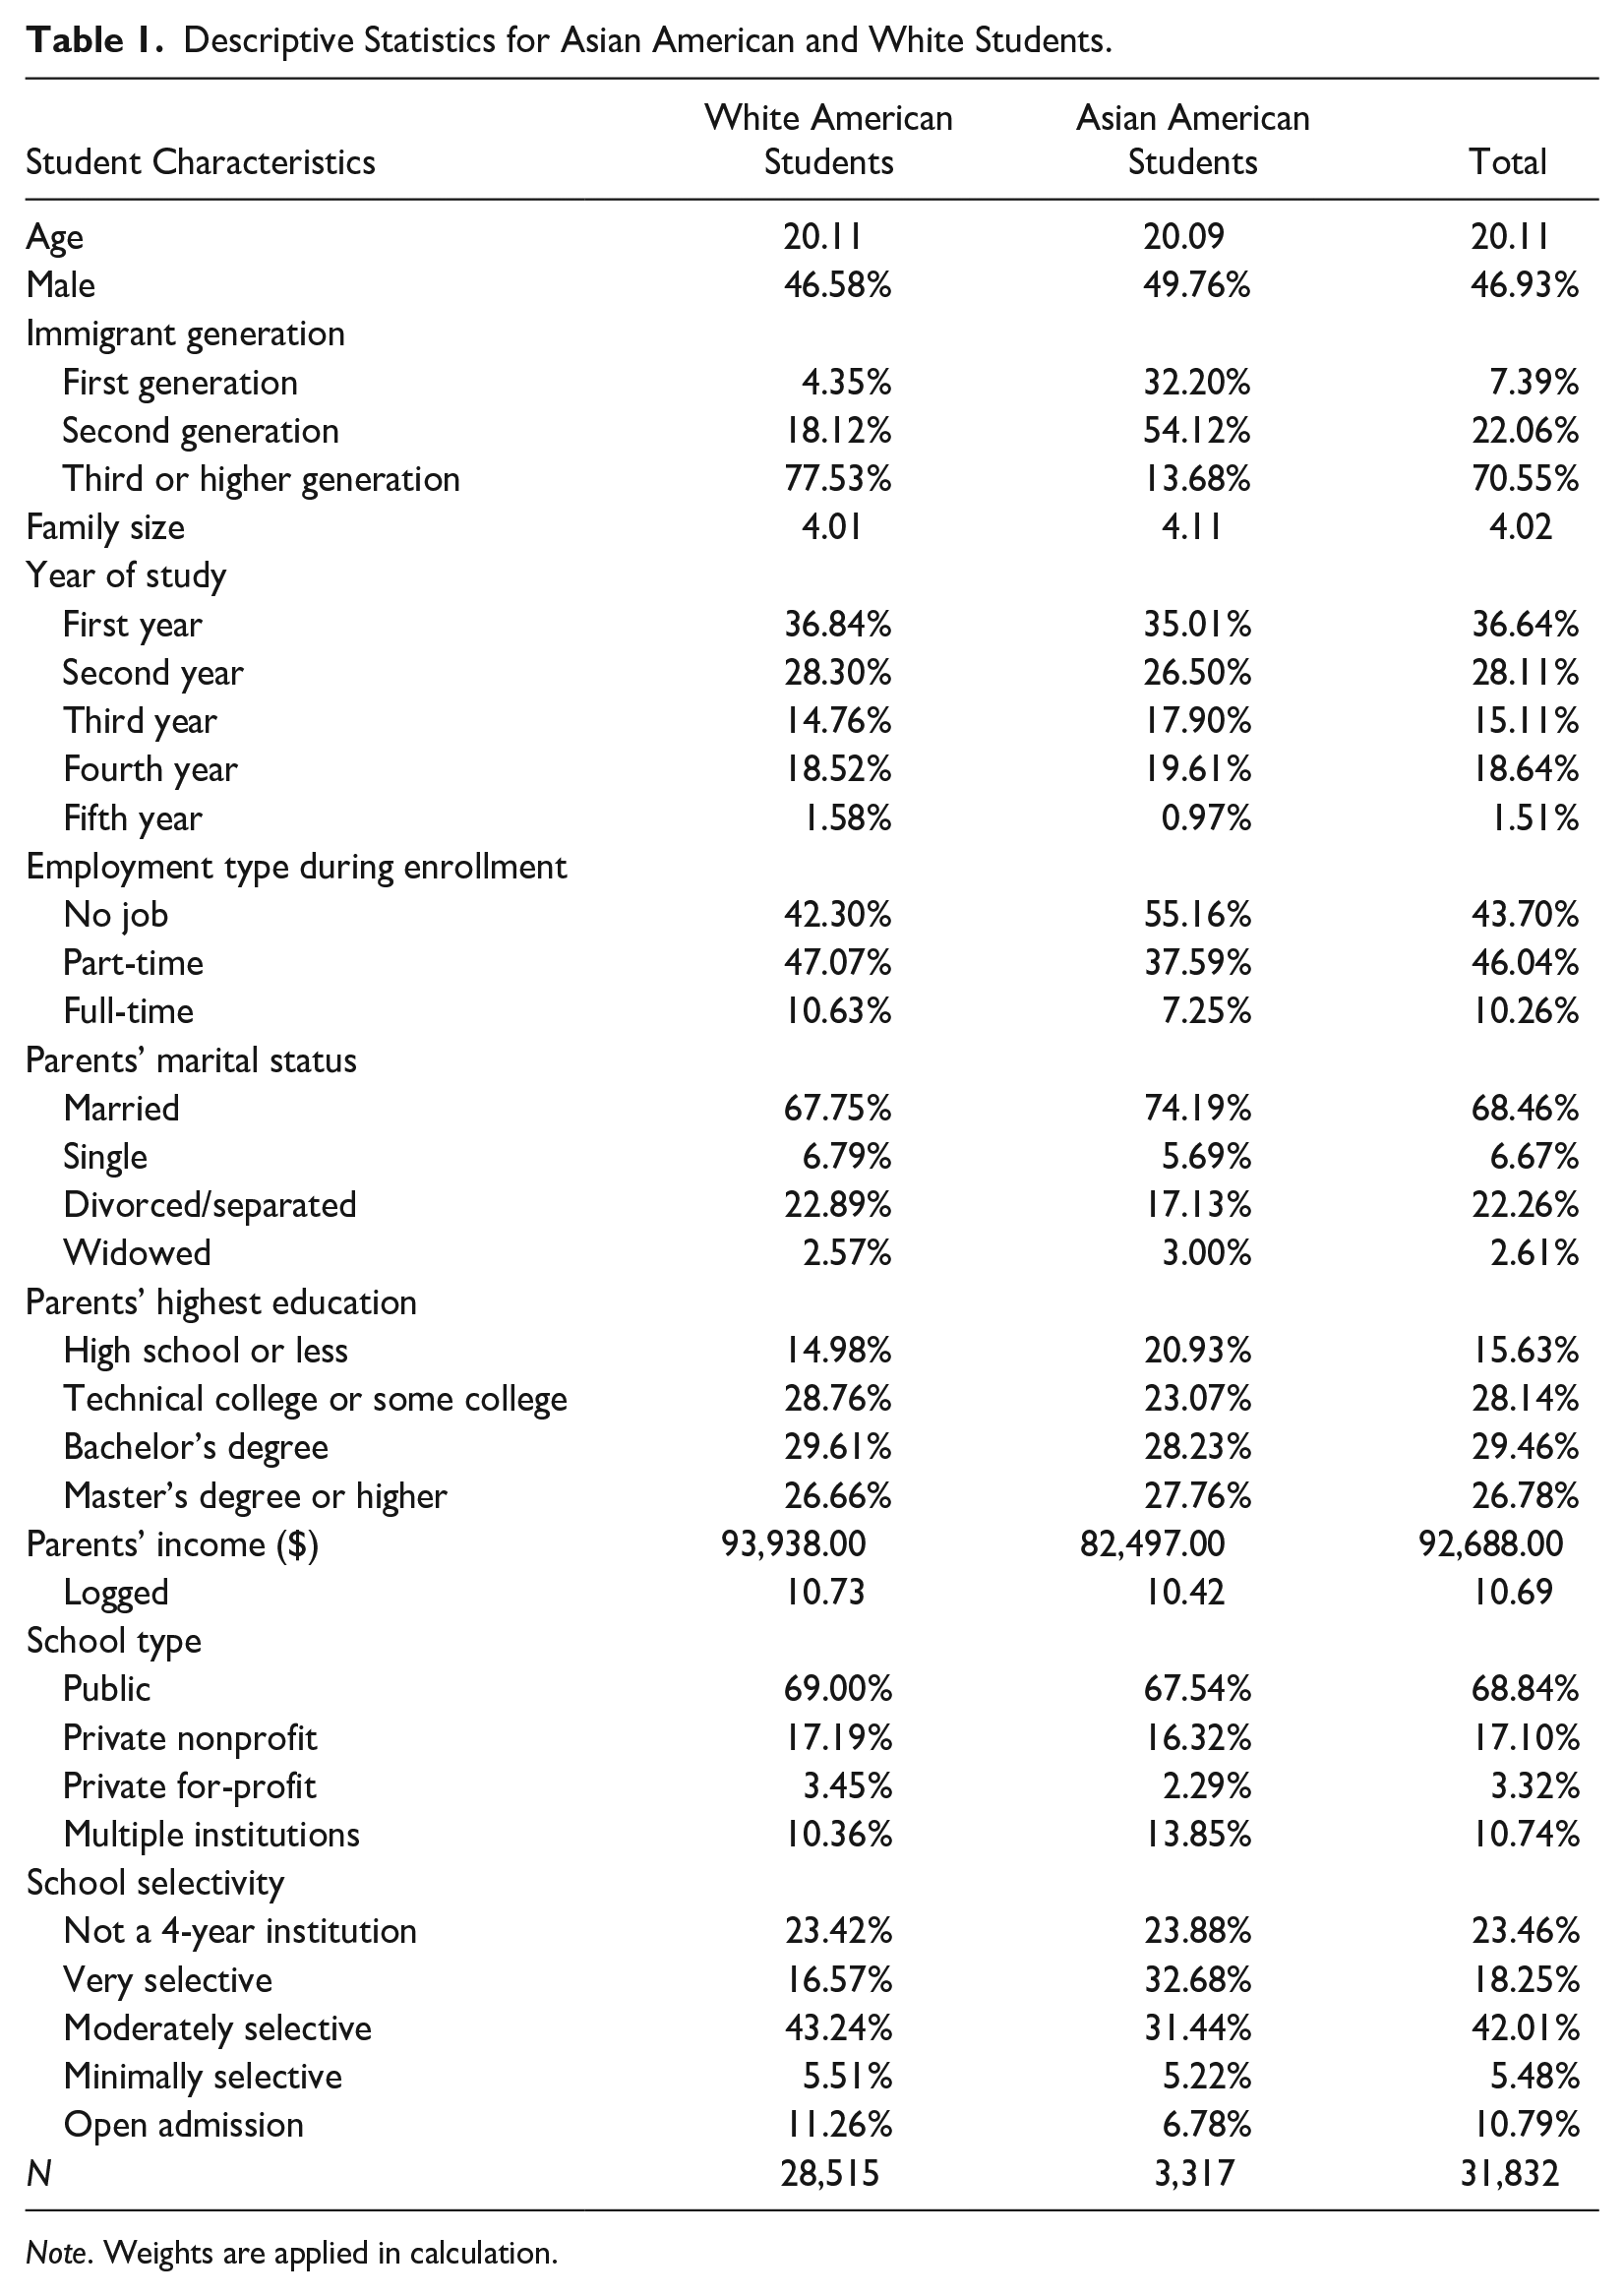
Note. Weights are applied in calculation.
We perform stepwise linear regressions to explain the differences in parental contributions to college costs between White and Asian American students. Model 1 is a baseline model, including only race and the control variables such as students’ age, gender, immigration status, year of study, and family size. In Model 2, we add parents’ marital status, education, and income dummies to examine the hypothesis that Asian American families invest more in their children’s education because they have more financial resources, such as higher incomes, than White families. In Model 3, we further control for some aspects of the students’ college experiences that might influence family contributions: whether or not the student worked at a part-time or full-time job, and aid received during the 2015–2016 academic year. Finally, we explore how school selectivity explains the race difference by adding institution type and selectivity in Model 4.5 A two-fold Blinder-Oaxaca decomposition further investigates how much of the Asian-White differences are due to college selectivity compared to other factors.
In our next set of models, we further explore how family investment varies by immigrant generation. Specifically, we compare college investment among the following groups: third- or higher generation White students, first- or second-generation White students, first-generation Asian American students, second-generation Asian American students, and third- or higher generation Asian American students. A final set of analyses examines differences across Asian American ethnic groups.
Results
Asian American-White Differences in Parental Financial Support
In Table 2, we report the bivariate differences in parental financial support between Asian American and White students in the 2015–2016 academic year. For both the Asian American and White students, the percentage of students who receive parental financial support is relatively high (around 80 percent). The difference in receiving any parental financial support between Asian American and White students is smaller than 1 percent and not statistically significant. However, the difference in the amount of parental financial support between the two groups is relatively large. On average, Asian American students receive a much larger amount ($1,455 more) of support than White students do. Conditional on those students with any financial support from parents, Asian Americans receive $1,906 more from their parents than White students do. The percentage of students with parents who contribute more than $25,000 is 11.2 percent for Asian American and 8.4 percent for White students. When we look at a ratio of contribution to parental income, we see that Asian American parents overall contribute about 18.3 percent of their income as compared to White parents’ 13.8 percent. Conditional on students who received any family financial support, the ratios of financial support to parental income are 23.1 percent and 17.4 percent for Asian American and White families, respectively.
Financial Support from Parents among Dependent College Students in the 2015–2016 Academic Year.
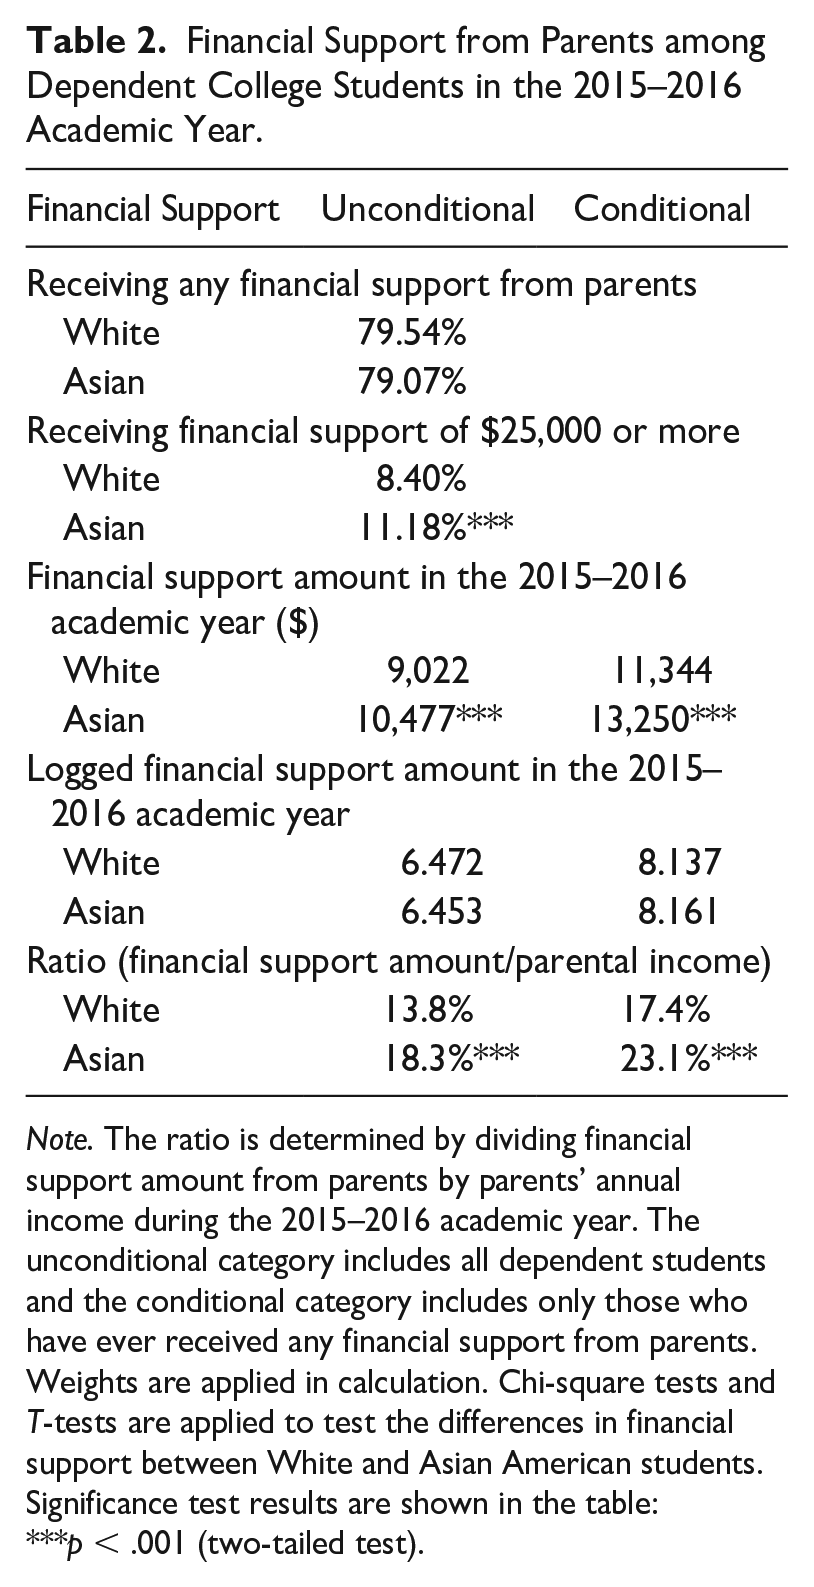
Note. The ratio is determined by dividing financial support amount from parents by parents’ annual income during the 2015–2016 academic year. The unconditional category includes all dependent students and the conditional category includes only those who have ever received any financial support from parents. Weights are applied in calculation. Chi-square tests and T-tests are applied to test the differences in financial support between White and Asian American students.
Significance test results are shown in the table: ***p < .001 (two-tailed test).
To explore whether Asian American-White differences in parental financial support vary by family income, we present the results broken down by income deciles, as shown in Figures 1 and 2. These results suggest that they do not. In terms of the average contribution amount, compared to White families, Asian American families contribute more to their children’s college education at most income levels. As Asian American families’ income increases, so does the amount they contribute compared to White families (see Figure 1). When looking at the ratio of financial support to parental income, a similar pattern emerges that shows Asian American families contribute a higher proportion of income to their children’s college education at most income levels (see Figure 2).
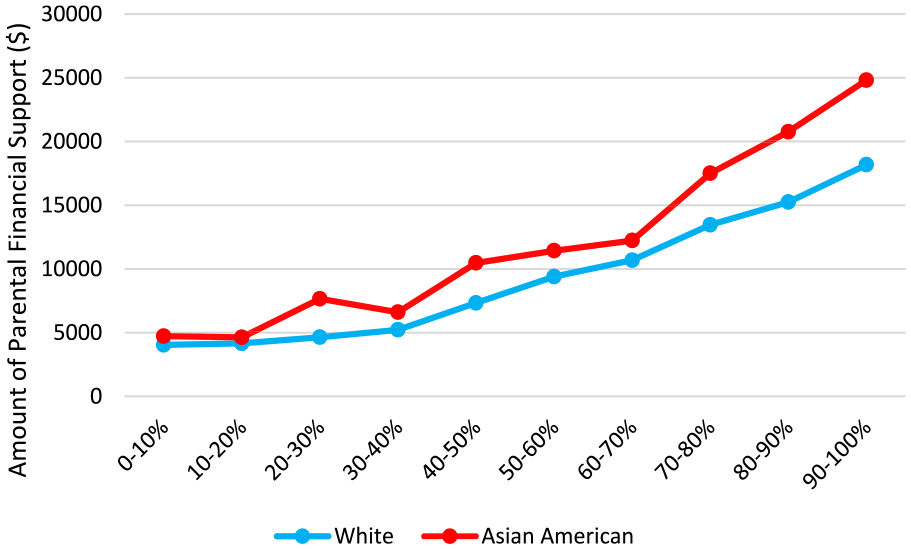
Average amount of parental financial support by income decile.
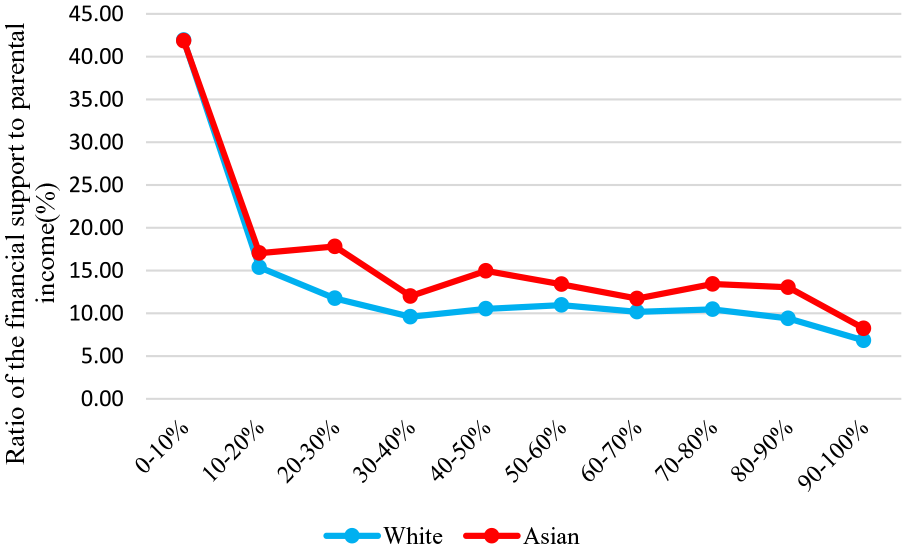
The ratio of financial support amount to parental income by income decile.
The above results reveal that Asian American families’ income resources do not account for their greater contributions to their children’s higher education. Indeed, in our sample the average income of Asian American college students’ families is lower than that of White families. Yet at almost all income levels, Asian American families generally contribute more both in terms of total expenditure and proportional to their own incomes.
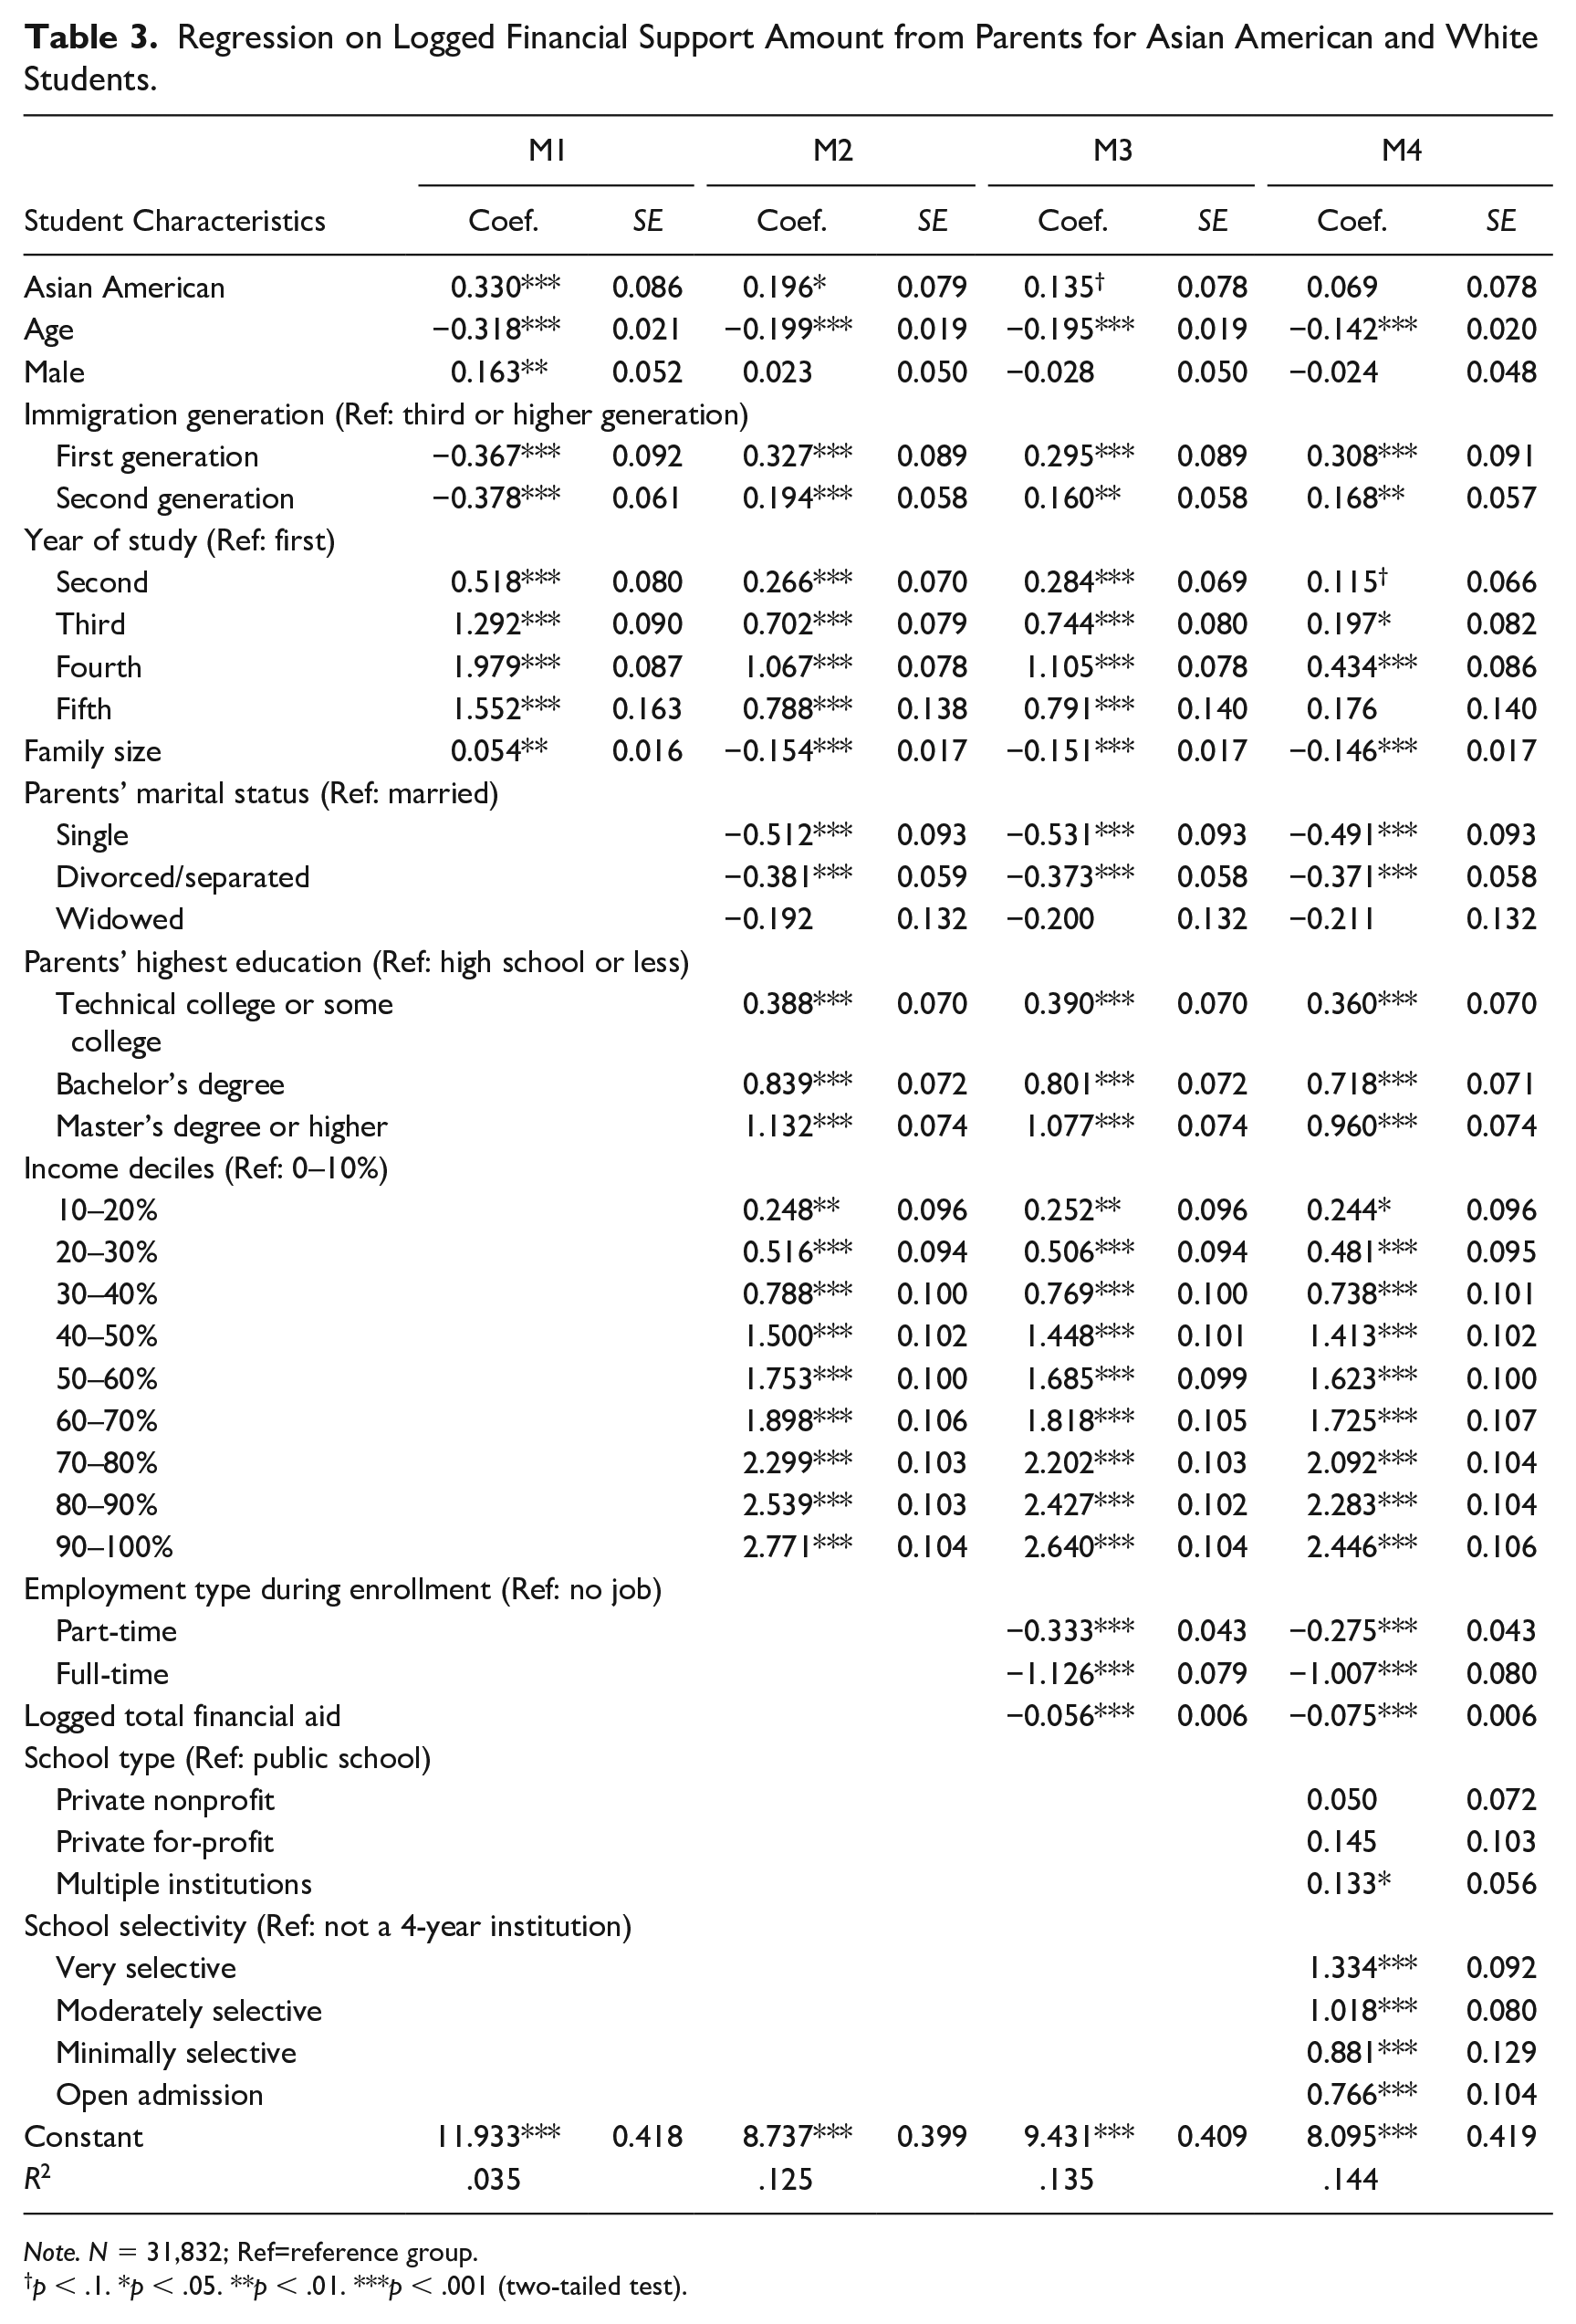
Next, we perform stepwise regression to explore how other factors may account for differences in financial support for children’s education between Asian American and White parents, with results presented in Table 3. Model 1 shows Asian American-White differences while controlling for age, gender, immigration status, year of study, and family size. The amount of parental financial support that Asian American students receive on average is 39.1 percent (p < .001) more than that of White students. 6 In Model 2, we add parents’ marital status, education, and income dummies. In this model, Asian American students’ premium in terms of parental financial support decreases to 21.7 percent (p < .05), 7 which indicates that these additional factors explain a portion of the gap in parental financial support between Asian American and White students. However, parental marital status, education, and income do not totally explain the difference in parental financial support between Asian American and White students. Separate analysis even shows that parental income has a suppressing effect due to lower income levels of Asian American students’ parents compared to that of White students’ parents.
Regression on Logged Financial Support Amount from Parents for Asian American and White Students.
Note. N = 31,832; Ref=reference group.
p < .1. *p < .05. **p < .01. ***p < .001 (two-tailed test).
Asian American-White Differences in College Selectivity
In Model 3, we control for students’ employment type and financial aid. Differences in financial support between Asian American and White families further diminish and are now marginally significant (p < .1). Asian American and White students differ in their likelihood of doing paid work and receiving institutional financial support. Finally, we add school type and college selectivity in Model 4. Results from this model show that the difference in parental financial support between Asian American students and White students is now statistically insignificant. Overall, students who attend more selective schools receive a higher amount of parental financial support, and Asian American students are more likely to attend selective schools.
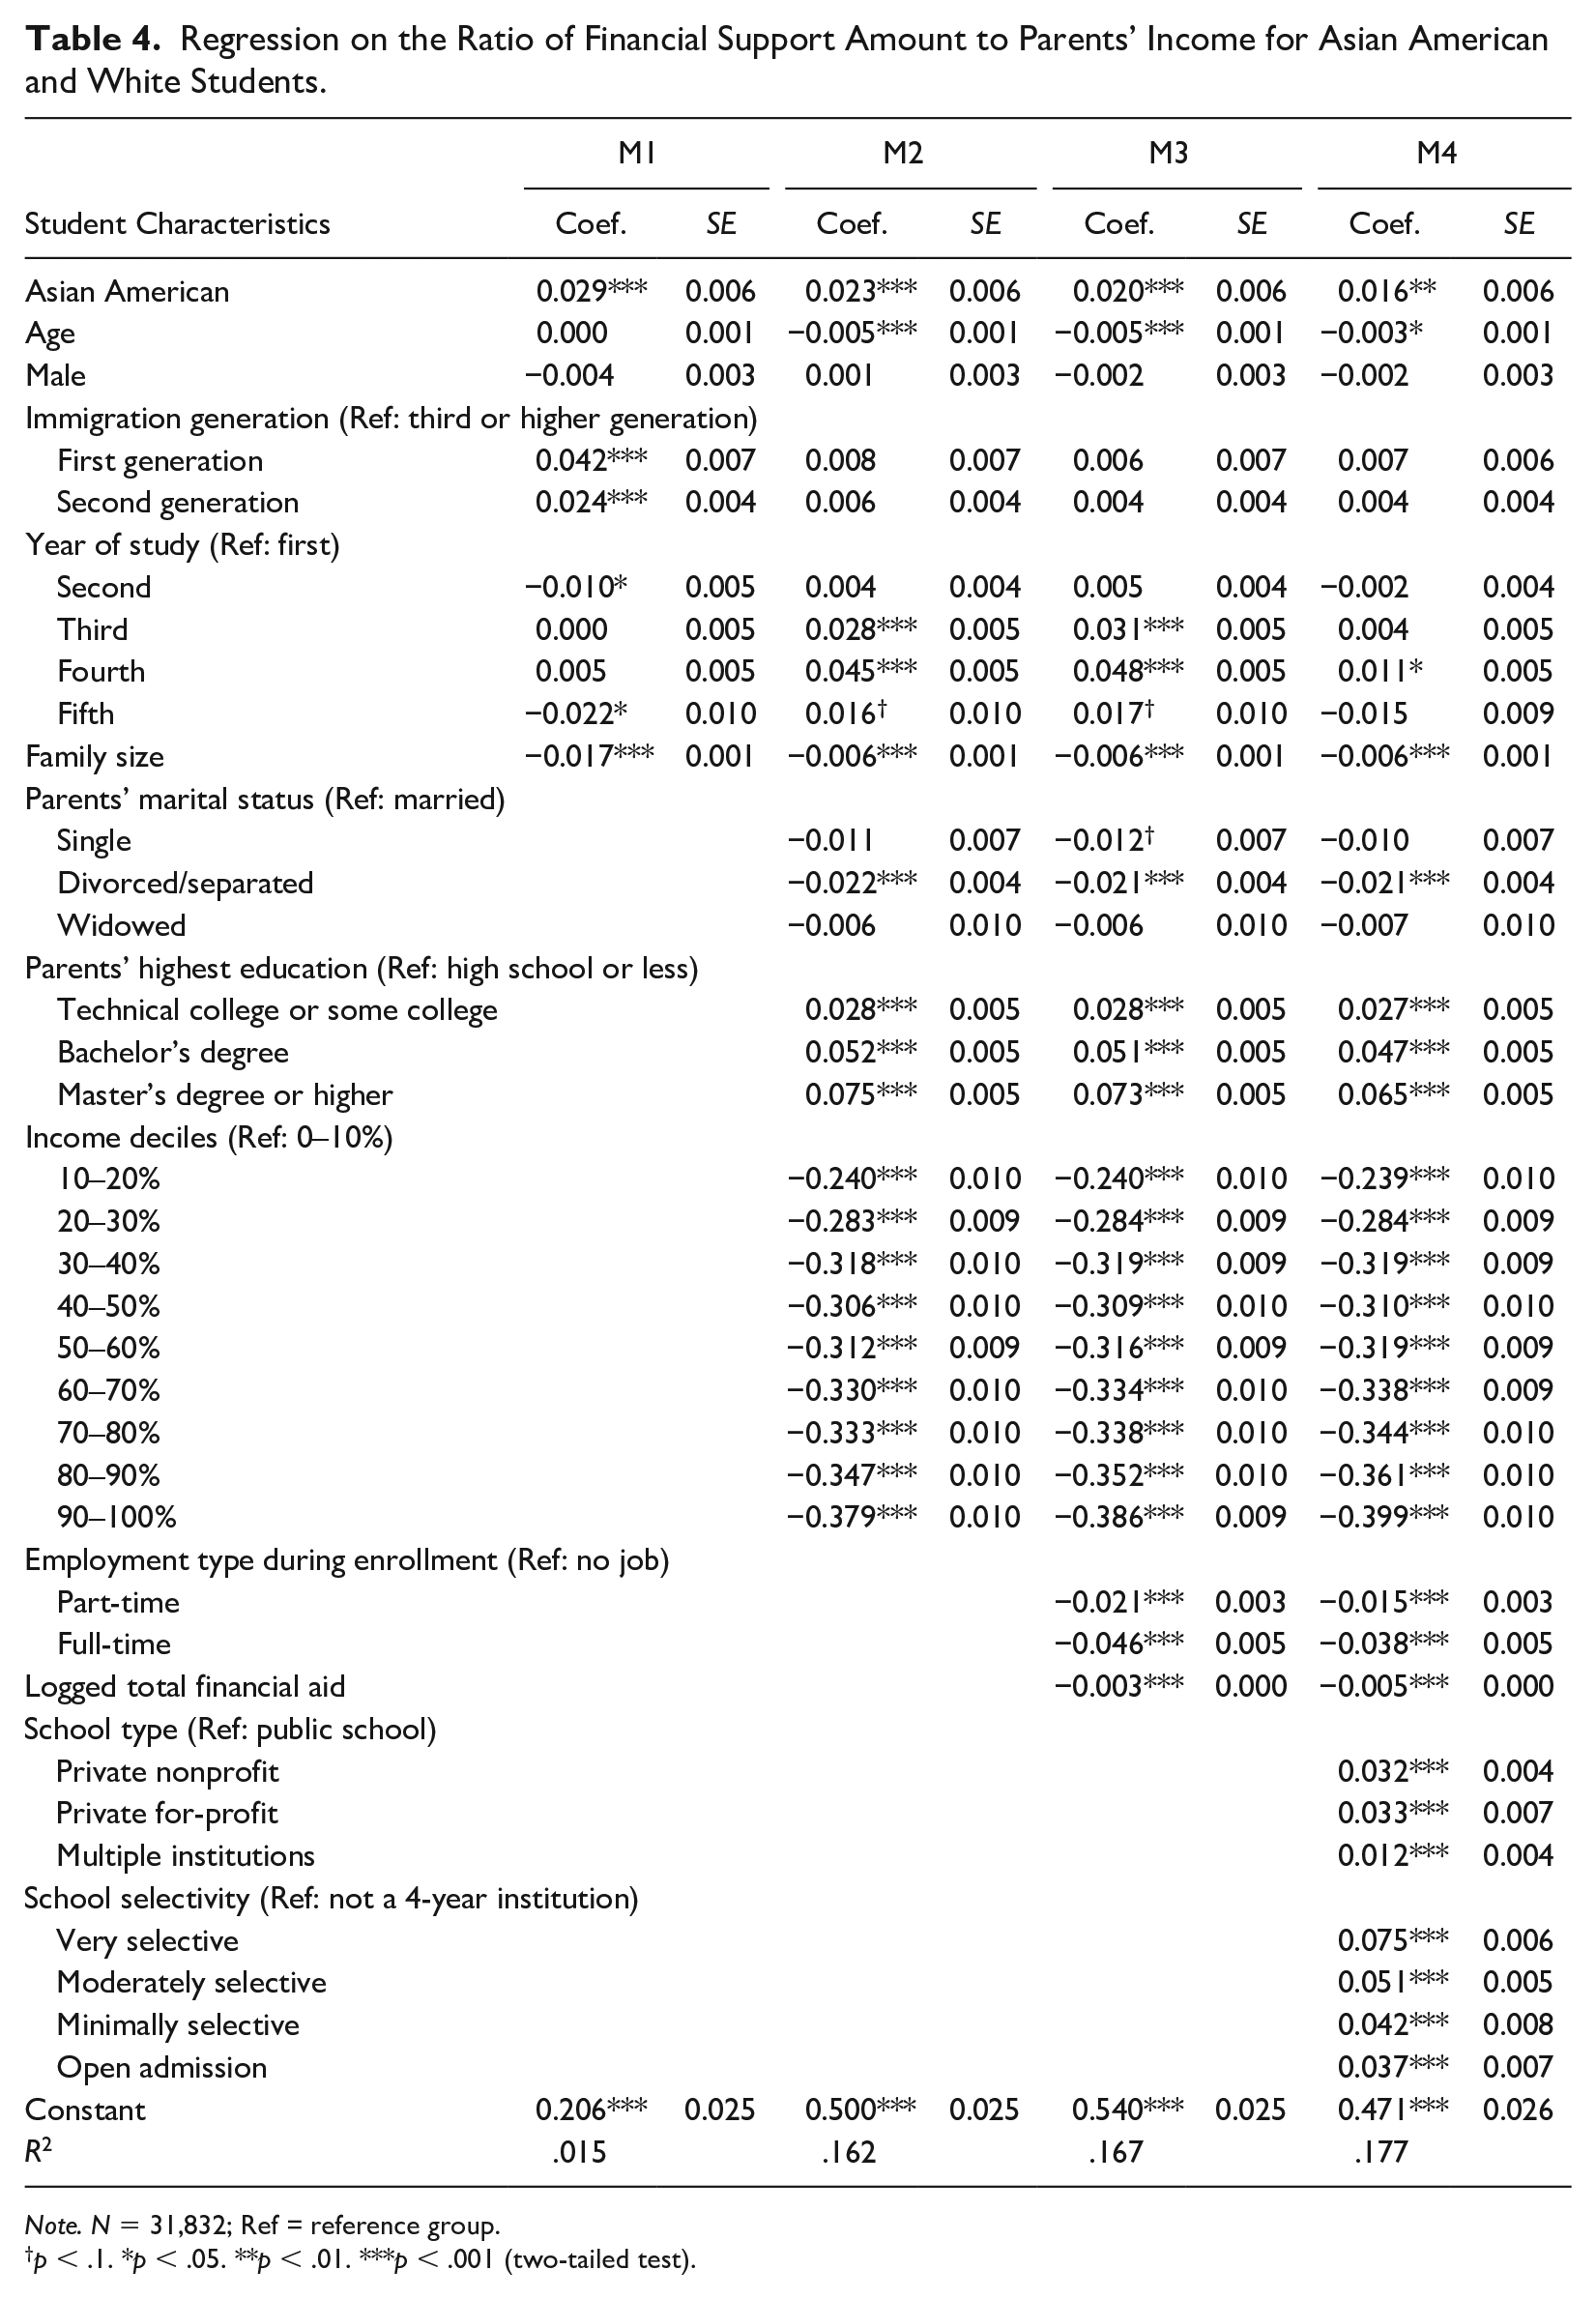
Similar patterns are also found for the ratio of parents’ financial support to income; that is, Asian American families may contribute a higher proportion of income to their children’s college partly due to college selectivity differences between Asian American and White students. Note, however, that in the full model (Model 4) parents of Asian American students still contribute proportionately more to children’s college (see Table 4).
Regression on the Ratio of Financial Support Amount to Parents’ Income for Asian American and White Students.
Note. N = 31,832; Ref = reference group.
p < .1. *p < .05. **p < .01. ***p < .001 (two-tailed test).
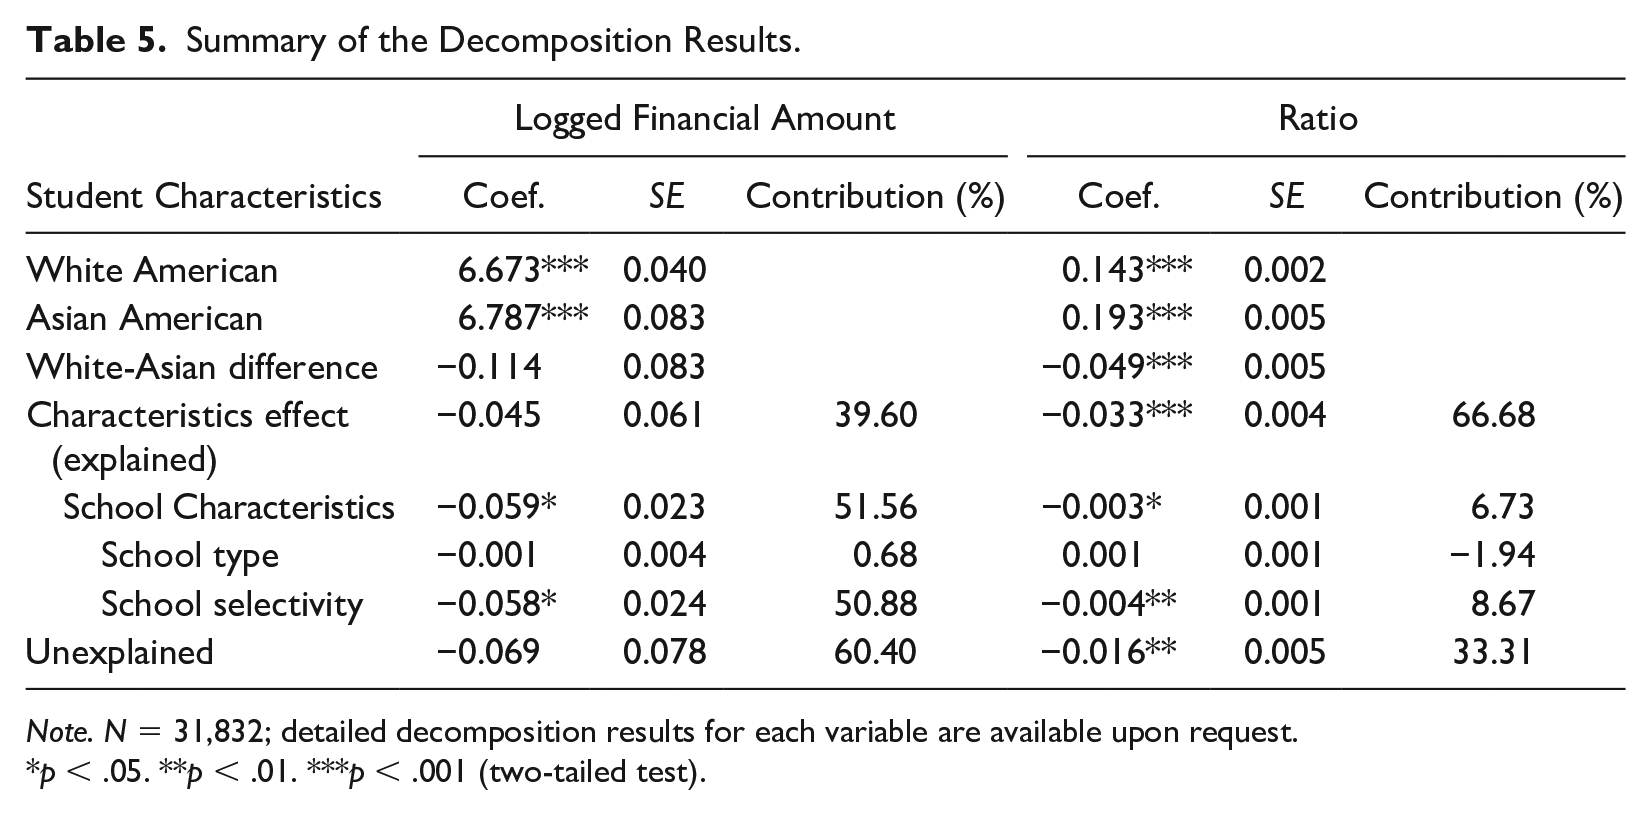
With step-by-step regression, we find that institutional selectivity is an important driver for differences in financial support from White and Asian American parents. We further adopt the Blinder-Oaxaca decomposition method, popularized by Alan S. Blinder (1973) and Ronald Oaxaca (1973), to describe how much of these differences are due to college selectivity compared to other factors. We apply the two-fold Blinder-Oaxaca decomposition with the base group set to Asian American students. With the two-fold decomposition, the outcome difference is divided into two parts. The first component is the outcome differential “explained” by group differences in the predictors (labeled as the “characteristics effect”), and the second component is the unexplained part, which is usually attributable to all potential effects from unobserved variables.
Table 5 displays the aggregate decomposition results for the White-Asian American differences in parental financial support. The total difference is −0.114 for logged financial amount; that is, White American students on average receive 0.114 (in logged value) less financial support from parents compared to Asian American students. The decomposition indicates that all predictors used in the regression account for approximately 40 percent of this difference. In other words, the difference can be reduced by 40 percent if White and Asian American students have the same observable characteristics employed in the regression. Among all the predictors, school selectivity contributes the largest portion to the overall difference, at 51 percent (−0.058/−0.114). Thus, we could expect the gap on parental financial support between White and Asian American students to close by as much as 51 percent (−0.058 in absolute value) if the two groups were distributed equally by school selectivity (all else constant). When we consider the ratio of contribution to income, characteristics of the two groups explain 67 percent (−0.033/−0.049) of the total difference of −0.049, of which 8-9 percent of the difference is due to the different distribution of school selectivity for the two groups. Both the step-by-step regression and the Blinder-Oaxaca decomposition provide strong evidence that school selectivity plays a vital role in accounting for differences in financial support from White and Asian American families.
Summary of the Decomposition Results.
Note. N = 31,832; detailed decomposition results for each variable are available upon request.
p < .05. **p < .01. ***p < .001 (two-tailed test).
Asian American families may contribute more to students’ education than White families because Asian American students are more likely to attend higher cost institutions. According to NPSAS 2015–2016, on average, Asian American students paid higher tuition and fees ($13,800 for tuition and $25,955 for total budget) than White students ($11,823 for tuition and $22,883 for total expenses). A regression analysis with controls also shows that Asian American students attend higher cost colleges, and, while Asian American students are more likely than White students to receive need-based aid, they are less likely than White students to receive merit-based aid, particularly at selective institutions (see Table A1). 8
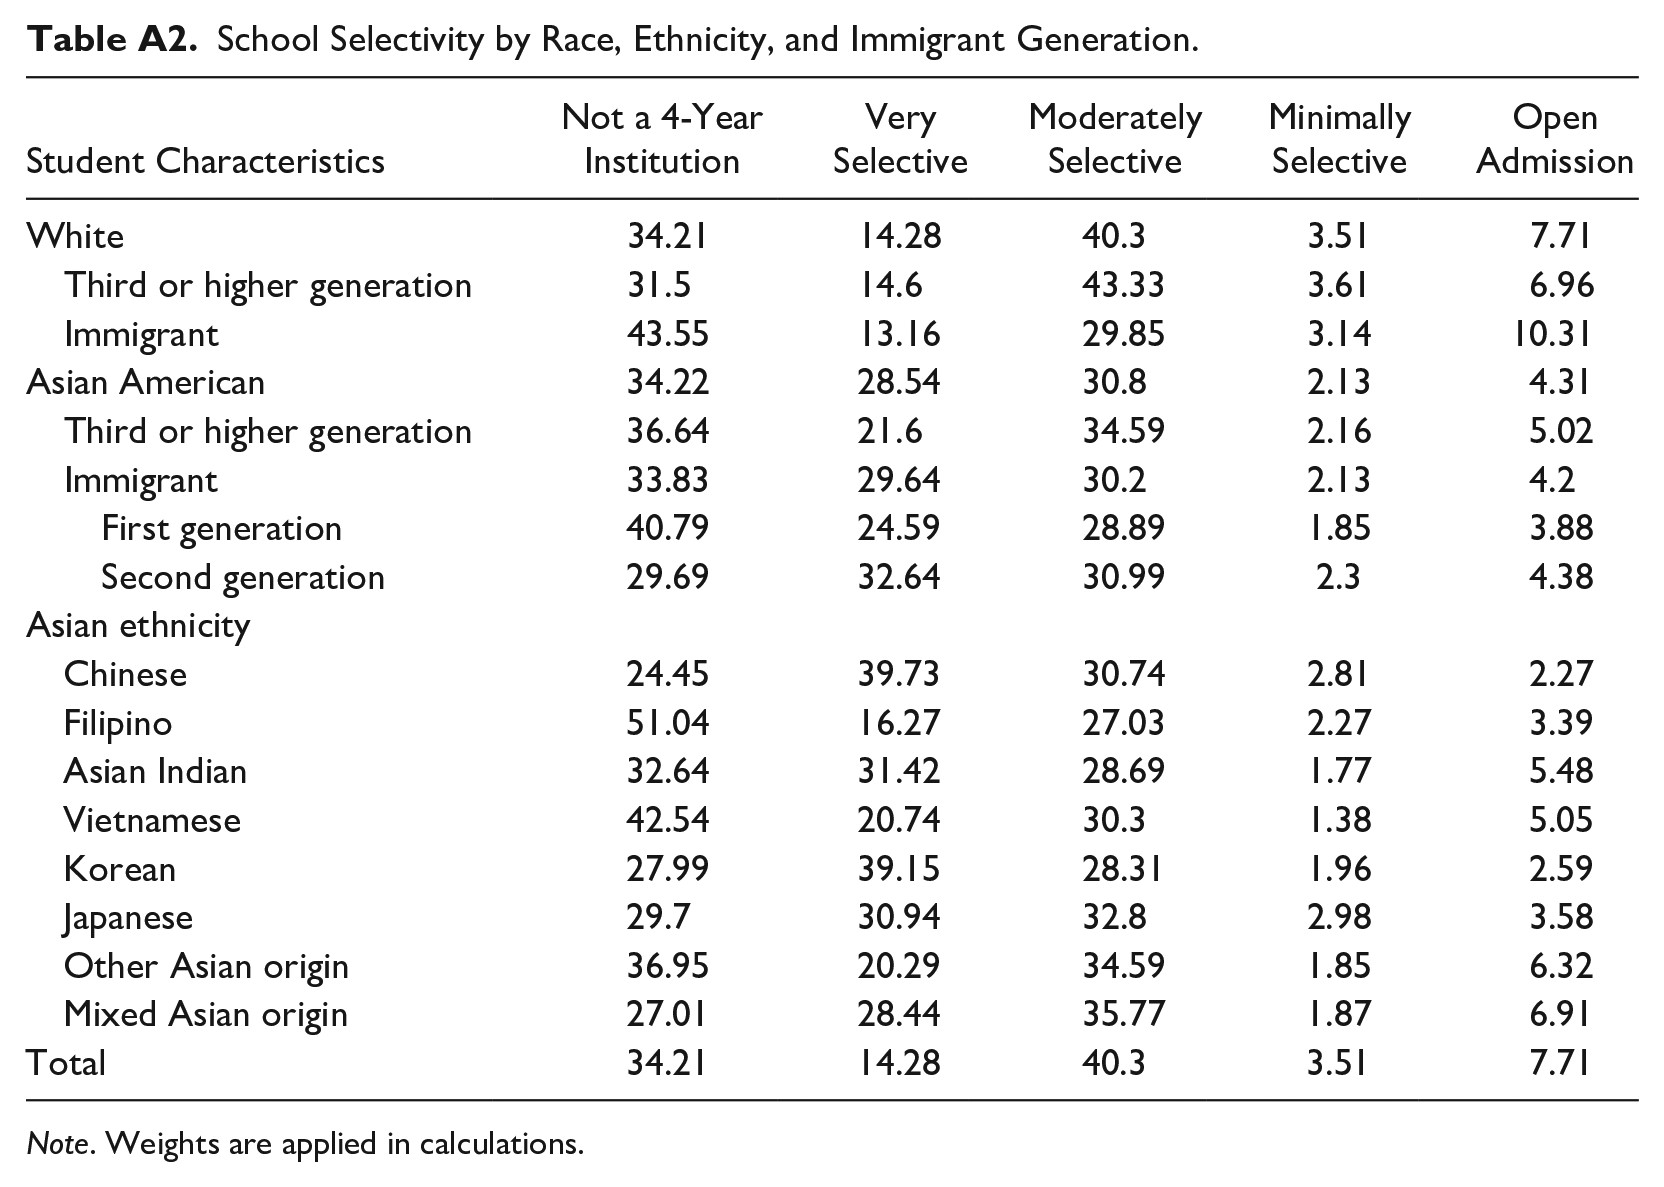
The proportion of Asian American students who attend very selective schools is 28.54 percent, much higher than that of White students (14.28 percent), indicating that Asian American students are more likely to attend elite universities. Students of all Asian American ethnic groups are more likely to attend very selective schools, and this is particularly true of Chinese and Korean students (see Table A2).
Immigrant Generation
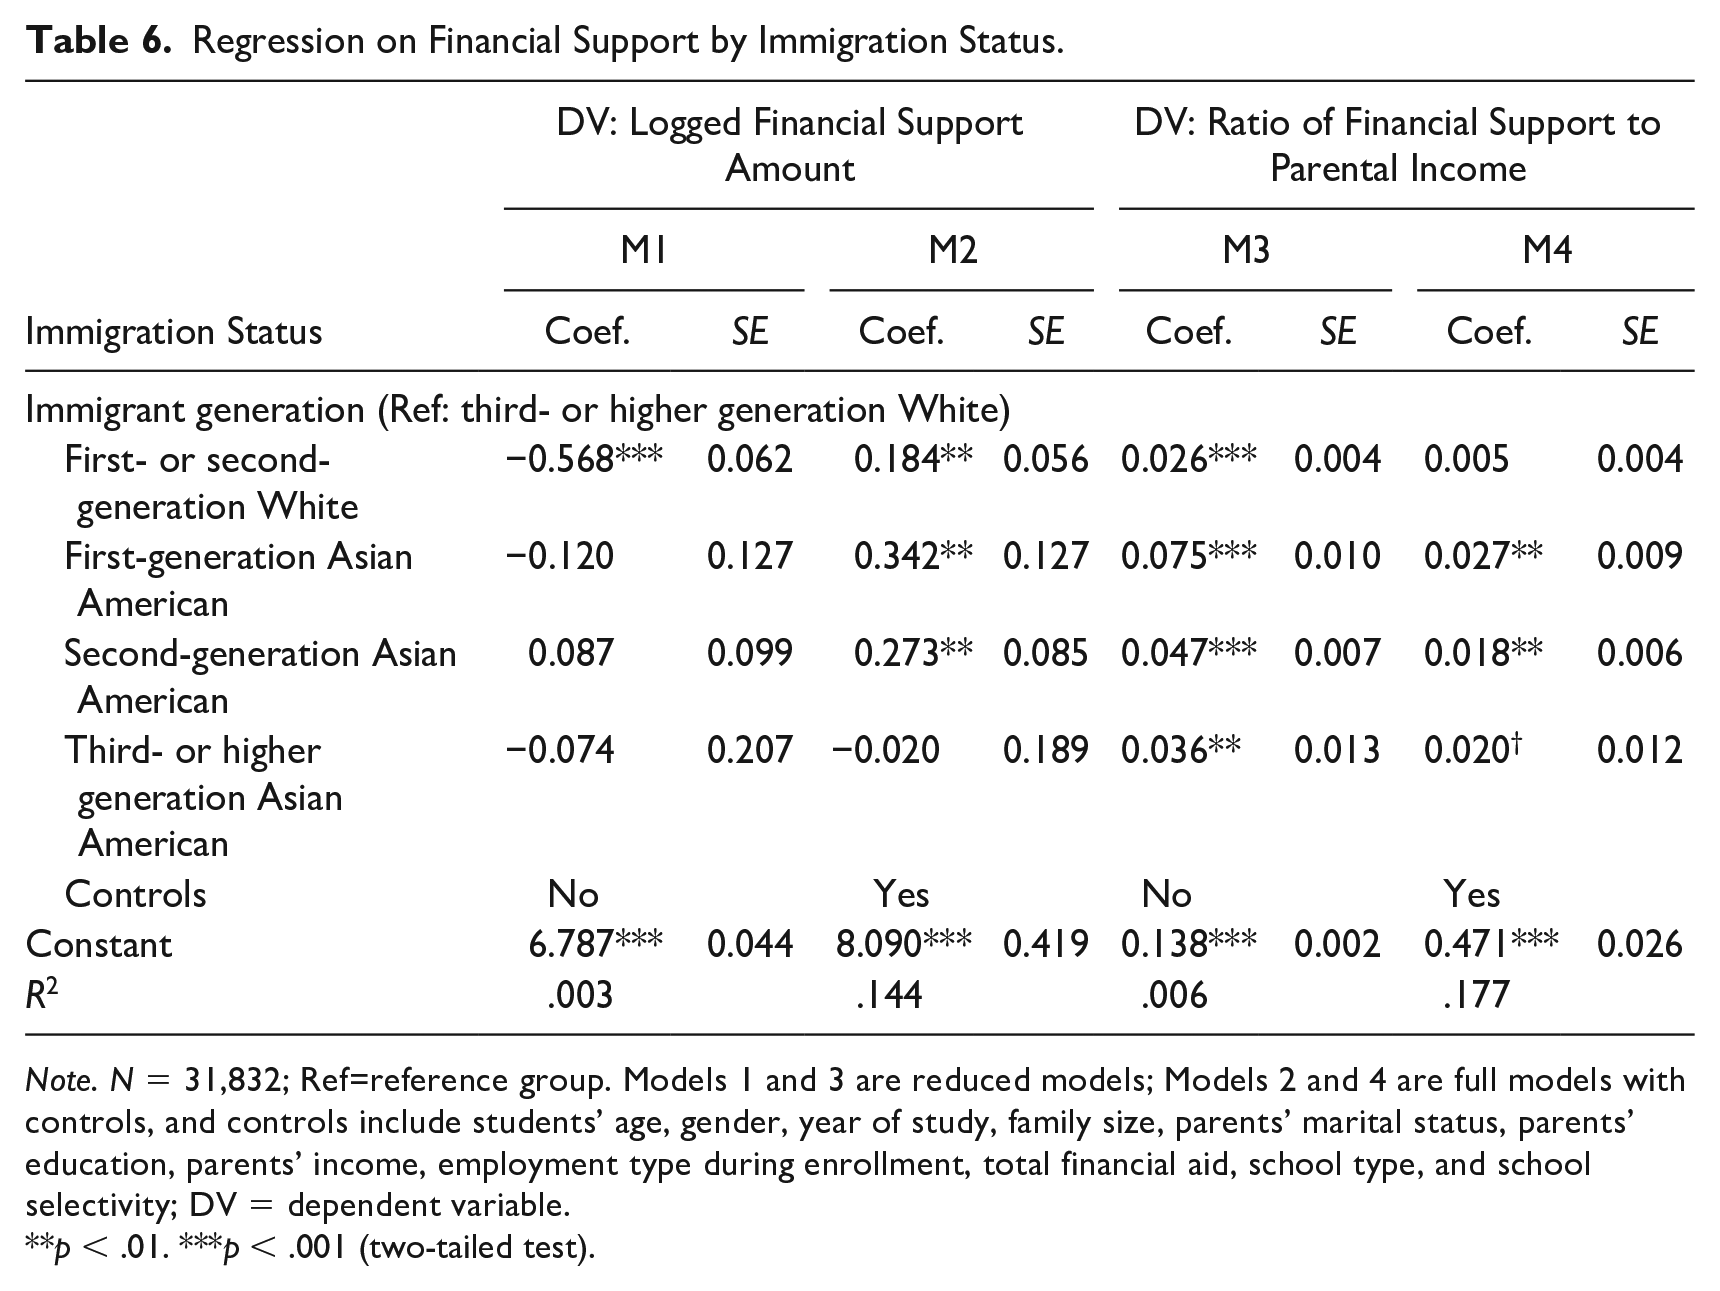
First- and second-generation Asian American students receive significantly more financial support from parents compared with third- or higher generation White students in terms of logged amount and ratio of parents’ financial support to income (see Table 6). When we disaggregate Asian American immigrants into different generations, we find that financial support decreases with generation. The amount of parental financial support that first-generation immigrant Asian Americans receive is 40.8 percent more than that of third- or higher generation White students. 9 For second-generation Asian Americans, it is 31.4 percent. 10 However, the difference between third- or higher generation Asian Americans and Whites is insignificant. We also note that first- and second-generation White students receive a significantly higher proportion of parental financial support to income compared to third- or higher generation Whites.
Regression on Financial Support by Immigration Status.
Note. N = 31,832; Ref=reference group. Models 1 and 3 are reduced models; Models 2 and 4 are full models with controls, and controls include students’ age, gender, year of study, family size, parents’ marital status, parents’ education, parents’ income, employment type during enrollment, total financial aid, school type, and school selectivity; DV = dependent variable.
p < .01. ***p < .001 (two-tailed test).
Asian American Ethnic Group
Our last set of analyses (Table 7) shows that in terms of amount or logged amount, Chinese American, Korean American, and Japanese American students receive significantly more family financial support than White students, while Vietnamese and other Asian-origin students receive significantly less family financial support than White students. Nearly all Asian American ethnic groups contribute a higher proportion of their family income to their children’s college education than do White families. The exception to this is Filipino Americans. Filipino Americans have a different immigration history and relationship to the United States as a former protectorate that may be reflected in their differences from other Asian American ethnic groups. It could also be that Filipino Americans are racialized differently from other Asian American ethnic groups (Gambol 2023; Ocampo 2016). In the multivariate models with controls (M2 and M4), we find that Chinese American families invest significantly more in logged U.S. dollars and as a ratio of their incomes even when we control for all of the variables in our final models. We caution that our sample sizes for individual ethnic groups are small, however.
Regression on Financial Support by Ethnicity.
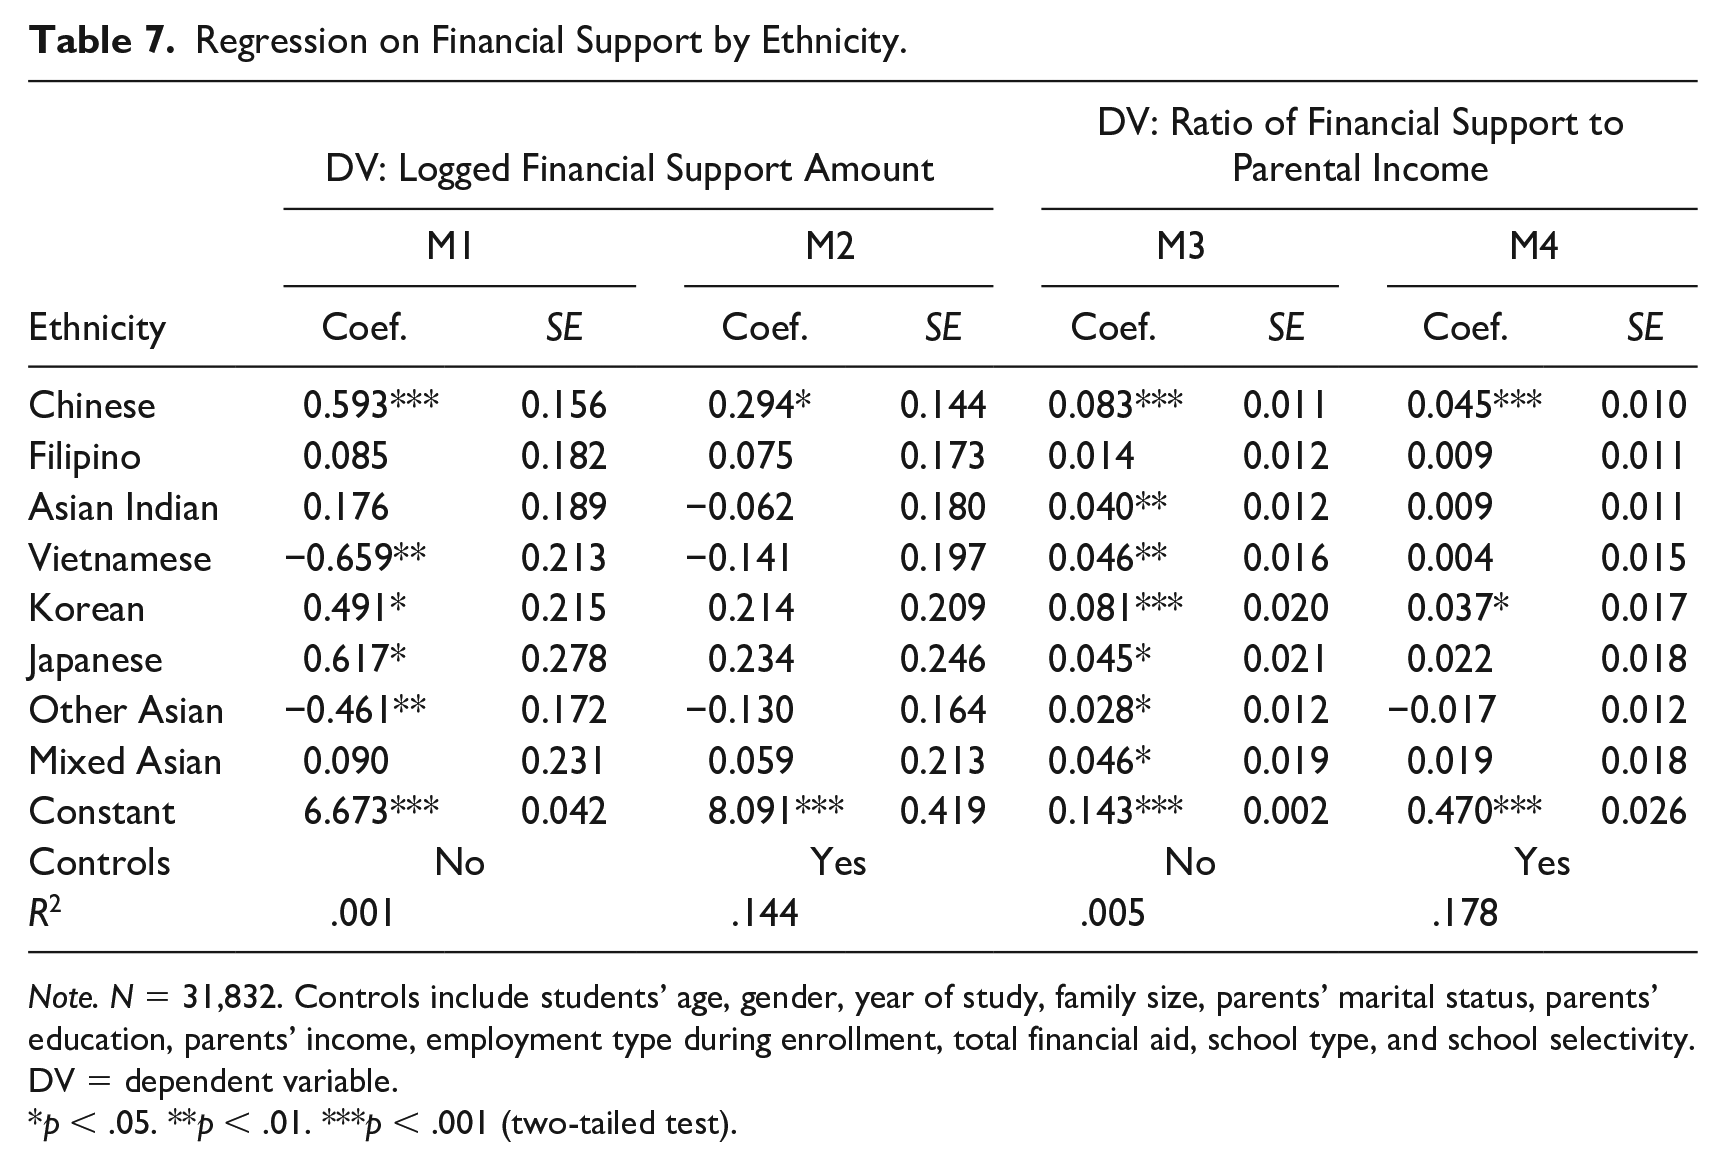
Note. N = 31,832. Controls include students’ age, gender, year of study, family size, parents’ marital status, parents’ education, parents’ income, employment type during enrollment, total financial aid, school type, and school selectivity. DV = dependent variable.
p < .05. **p < .01. ***p < .001 (two-tailed test).
Discussion and Conclusion
Differences exist in actual family investments in children’s higher education between Asian American families, particularly first- and second-generation immigrants, and White families. Differences in providing any help at all are small, but once Asian American families provide financial support, they provide more in terms of amounts and as a proportion of their incomes.
The evidence suggests that Asian Americans are investing more in their children’s education but not because they have higher family incomes. Regardless of income level, Asian American families invest more and invest a greater proportion of their incomes. This is especially so for recent-immigrant Asian American families and those with the lowest incomes.
We find that the selectivity of the colleges that Asian American students attend is related to their families’ investments. There are many possible reasons why Asian American families may be willing to spend more on a selective college education. Asian Americans may be more likely to perceive it as a vehicle to attaining specific stable and high-earning occupations than White families do. White families may be more likely to view college as a stage in the life course used for career exploration, socializing, and becoming an adult (Armstrong and Hamilton 2013; Goyette 2008; Xie and Goyette 2003). Elizabeth A. Armstrong and Laura T. Hamilton (2013) suggest that for middle- and upper-class White families, the socializing that occurs in colleges and universities, at least among women, serves alongside academic achievement as a vehicle for social mobility. This may be less true for Asian American families, for whom socializing in college may not have the same payoff for mobility. Thus, as a caricature, if White families can be said to “pay for the party” (Armstrong and Hamilton 2013), Asian American families “pay for the prestige.”
Another way that Asian American and White families may differ is in their perceptions of higher education and its role in the path to adulthood. Laura T. Hamilton (2016) finds that White working-class parents viewed their children’s higher education as the student’s responsibility, leaving them to assume some or all of the costs of it. Caitlin Zaloom (2019) describes the “moral obligation” that middle-class families feel to finance the “right” education for their children. It may be that Asian American families of all classes resemble middle- and upper-class White parents (Liu and Xie 2016) in that they are less likely to perceive children’s financial independence as a stage to adulthood, at least during their college-going years, and more likely to feel a moral obligation toward financing the best “quality” education that they can for their children; however, “quality” is perceived.
Racialization of Asian Americans may also influence the role that selective colleges play in future mobility (Jiménez and Horowitz 2013; Lee and Zhou 2015). Asian Americans recognize that stereotypes—as a “model minority,” “forever foreign,” “of limited English proficiency,” and “technically oriented”—inform perceptions of the types of careers that are available and the ways to achieve them (Tuan 1998). Higher education may be perceived as a channel to upward mobility (or a barrier to downward mobility) that minimizes the harmful effects of these stereotypes or even capitalizes on them.
Asian American families, then, may be willing to invest more financially in children’s selective college education than White families to maximize opportunities to succeed in light of stereotypes and discrimination that may block particular career opportunities. There is much research that suggests Asian Americans face a “bamboo ceiling”; that is, the likelihood of achieving promotions to management positions may be blocked (e.g., Chin 2020; Huang 2021; Takei and Sakamoto 2008). Asian Americans may be more likely to select career options for which higher education is a precondition (Xie and Goyette 2003) or that are higher earning (at least for women, see Song and Glick 2004), perhaps as a way of strategically assuring social mobility or guarding against downward mobility. Institutional prestige may be perceived as a reliable signifier of human capital, which further enables Asian Americans to more easily transition to desired, high-earning careers.
Another possibility is that Asian American families may attach more symbolic value to selective universities. Yingyi Ma (2020) shows that this is the case for families of Chinese international students, who consider a very limited list of “acceptable,” selective U.S. institutions. This may be because Asian American families are less familiar with the range of and variation in institutions in the United States and thus more likely to rely on name recognition or rankings of prestigious institutions (J. K. Kim and Gasman 2011). Or it could be that Asian American families derive pride and status from selective institutions, and those feelings may be reinforced by their social and family networks (Lee and Zhou 2015). More so than White students, Asian American students may be in high schools with competitive, “college-going” cultures (Massé 2019) or surround themselves with peers that have high expectations for college selectivity (J. K. Kim and Gasman 2011). This may lead to increased competition within Asian American ethnic groups (Dhingra 2018).
For Asian American immigrant families, though, there is more to their investment behaviors than can be explained by institutional selectivity. Beyond the selectivity of the colleges that first- and second-generation Asian American students attend, their families still invest higher amounts in their education. It may be that expectations for investments of family time and money in children’s education are shaped in countries of origin, where these expectations are quite high compared to the United States. It could also be a result of “hyperselectivity” (see Lee and Zhou 2015, but also Feliciano 2005); that is, Asian immigrants to the United States are typically more educated, or more “selected,” compared to both their compatriots who do not migrate and to the majority of the residents of the population to which they are migrating (White, middle-class U.S. residents). Perceptions based on highly selected Asian Americans “spill-over” to less-selected migrants and their children because Asian Americans are racialized similarly.
While we have explored various ways in which family financial investments in college differ across Asian Americans of different ethnic groups and immigrant generations, we do not have measures of attitudes or values that may capture Asian American-White differences in orientation toward education and its perceived usefulness in the United States, and we leave this to future research. Of the two “proximate determinants” of financial investments we identify, we find that it is not the greater financial resources of Asian American families that determine their greater investment, but rather it may be the costs of the selective institutions that Asian Americans attend that lead to these differences. The next direction for this research is to investigate why there are such differences in enrollment in these institutions between Asian American and White students.
Footnotes
Appendix
School Selectivity by Race, Ethnicity, and Immigrant Generation.
| Student Characteristics | Not a 4-Year Institution | Very Selective | Moderately Selective | Minimally Selective | Open Admission |
|---|---|---|---|---|---|
| White | 34.21 | 14.28 | 40.3 | 3.51 | 7.71 |
| Third or higher generation | 31.5 | 14.6 | 43.33 | 3.61 | 6.96 |
| Immigrant | 43.55 | 13.16 | 29.85 | 3.14 | 10.31 |
| Asian American | 34.22 | 28.54 | 30.8 | 2.13 | 4.31 |
| Third or higher generation | 36.64 | 21.6 | 34.59 | 2.16 | 5.02 |
| Immigrant | 33.83 | 29.64 | 30.2 | 2.13 | 4.2 |
| First generation | 40.79 | 24.59 | 28.89 | 1.85 | 3.88 |
| Second generation | 29.69 | 32.64 | 30.99 | 2.3 | 4.38 |
| Asian ethnicity | |||||
| Chinese | 24.45 | 39.73 | 30.74 | 2.81 | 2.27 |
| Filipino | 51.04 | 16.27 | 27.03 | 2.27 | 3.39 |
| Asian Indian | 32.64 | 31.42 | 28.69 | 1.77 | 5.48 |
| Vietnamese | 42.54 | 20.74 | 30.3 | 1.38 | 5.05 |
| Korean | 27.99 | 39.15 | 28.31 | 1.96 | 2.59 |
| Japanese | 29.7 | 30.94 | 32.8 | 2.98 | 3.58 |
| Other Asian origin | 36.95 | 20.29 | 34.59 | 1.85 | 6.32 |
| Mixed Asian origin | 27.01 | 28.44 | 35.77 | 1.87 | 6.91 |
| Total | 34.21 | 14.28 | 40.3 | 3.51 | 7.71 |
Note. Weights are applied in calculations.
Acknowledgements
The authors are thankful to Hunter Wade York and Lei Wei from Princeton University for their research assistance. The authors would also like to acknowledge the anonymous reviewers for the valuable suggestions.