
Abstract
The mortgage industry is a key component of ethno-racial stratification in wealth and homeownership. Previous research demonstrates that unequal treatment of minorities has created inequality in access and exclusion to low-cost mortgage loans in the housing market. While prior studies have documented the disadvantages Black and Latino home seekers face in obtaining a mortgage, these studies have not considered the obstacles that current homeowners face when seeking to refinance their mortgage. This study draws on annual data from the Home Mortgage Disclosure Act (HMDA) from 2018 to 2019 to assess ethno-racial disparities in refinanced mortgage outcomes by loan purpose. I demonstrate that loan rejections and high-cost loans are highest among Black homeowners seeking to refinance their home, especially when trying to make home improvements or cashing-out equity from their home. In general, Asians and Latinos perform in between Whites and Blacks across mortgage outcomes and loan purpose. These trends are particularly true when examining adverse loan outcomes for applicants seeking a cash-out refinance. Implications for ethno-racial stratification and the wealth gap are discussed.
Homeownership is a major aspect of creating and generating wealth in the United States, especially for minorities. Disparities in access to homeownership is a key source of ethno-racial inequality in inheritance which compounds wealth disparities across generations (Crowder, South, and Chavez 2006; Oliver and Shapiro 2006). As such, minorities are unable to take advantage of the tax incentives that lower the cost of homeownership and that provide the opportunity to transfer assets across generations at a reduced tax rate. The benefits of homeownership also vary across neighborhoods, as White neighborhoods are generally associated with positive communities amenities, including higher quality government services, access to better performing public schools, an increased social network, and lower crime rates (Charles 2009; Krivo and Kaufman 2004; Rossi and Weber 1996; Yinger 1995), while many of these amenities do not extend to minority neighborhoods (Markley et al. 2020; Pattillo 2005, 2013; Taylor 2019). In 2019, the homeownership rate hovered around 73 percent for Non-Hispanic Whites (hereafter called “Whites”), 58 percent for Asians, and a mere 47 percent and 42 percent for Latinos and Non-Hispanic Blacks (hereafter called “Blacks”; U.S. Census Bureau 2020).
Unlike the homeownership market, where potential home buyers are seeking to purchase a home to live in and build wealth, the refinance mortgage market is limited to current homeowners that are seeking to either draw on their home’s equity or save on mortgage costs. In addition, the refinance mortgage market provides a unique opportunity for homeowners to maintain their ownership status, while gaining access to a portion of their home’s equity. Finally, mortgage loan products differ between mortgage originations and refinance loans, as refinance loans do not benefit from government sponsored programs, such as Federal Housing Administration (FHA) loans or Housing and Urban Development (HUD) Homes.
Accordingly, I draw on data from the Home Mortgage Disclosure Act (HMDA) from 2018 to 2019 to compare ethno-racial variation in loan outcomes in the refinance mortgage market. My main objective is to examine ethno-racial stratification in the refinance mortgage market when considering the purpose of the refinance loan. The HMDA data set began reporting important economic risk indicators starting in 2018 that provides a more accurate assessment of ethno-racial stratification in the mortgage refinance market than previous studies. I also detail demographic, economic, loan, and locational characteristics across ethno-racial groups. And finally, I examine the inter-related impact of ethno-racial groups on refinanced mortgage outcomes overall and across different loan purposes. First, I demonstrate variation in conventional refinanced originations across different loan purposes. Then, I highlight that Black homeowners seeking to refinance their home are much more likely to obtain a high-cost loan or be denied regardless of the purpose of the loan. In addition, I show that Asians and Latinos generally perform similarly as Whites in obtaining a high-cost loan but perform in between Whites and Blacks when examining mortgage denials. This provides a more nuanced view of the ethno-racially stratified refinance mortgage market and suggests that inequality exists in accessing home equity through the form of mortgage credit.
Theoretical Background
The two broad theoretical frameworks for understanding ethno-racial inequality in homeownership focuses on demographic and human capital differences and on ethno-racial stratification and discrimination. From the socio-demographic lens, buying a home is part of the household decision-making process, which reflects different preferences based on life-cycle characteristics such as age, marriage, and family bearing, subject to financial constraints. For instance, homeownership is higher among those that are married with children, have a higher level of education, have a higher income, and have a steady career (Abel and Fuster 2021; Dwyer 2007; Dwyer et al. 2016; Flippen 2004). In addition, socio-demographic characteristics account for a large share of homeownership inequality across ethno-racial groups (Flippen 2001).
Ethno-racial disparities in homeownership remain even after accounting for socio-demographic characteristics, thus pointing to the importance of ethno-racial stratification and discrimination in homeownership (Faber and Ellen 2016; Flippen 2010; Haurin, Herbert, and Rosenthal 2007; Loya 2022b; Schuetz, Been, and Ellen 2008). To illustrate, minorities are more likely to withdraw their mortgage application, receive poor service from real estate agents, obtain alternative and higher cost loans, and be steered toward lower quality homes in low-income and minority neighborhoods compared to Whites (Adelman 2005; Bond and Williams 2007; Dwyer 2007; Haupert 2022; Iceland and Wilkes 2006; Massey et al. 2016; Roscigno, Karafin, and Tester 2009; Turner et al. 2002). Previous research of structural lending disparities in the mortgage market have focused on primary mortgage originations, and have largely ignored the refinanced mortgage market, as homeowners try to achieve better loan terms, make home improvements, or cash-out from their home’s equity.
The growth and accumulation of high-cost loans has been problematic for minority borrowers and communities of color alike. These unappealing loans have higher fees and interest rates, and they increase the probability of a late payment and a mortgage default compared to a low-cost fixed rate conventional mortgage product. Prior to the Great Recession in the early 2000s, about half of all loans to Blacks and Latinos were high-cost loans (Avery, Brevoort, and Canner 2007). The housing and financial collapse of the Great Recession had a disproportionate impact on minorities. Predominantly minority communities and homeowners faced higher levels of foreclosure, mortgage debt, and were more likely to be underwater on their home (owing more on their home than it was worth), compared to White communities and homeowners (Addo and Darity 2021; Amromin and McGranahan 2015; Anacker and Carr 2011; Anacker and Pradhan 2012; Bayer, Ferreira, and Ross 2016; Faber and Ellen 2016; Rugh and Massey 2010). In the aftermath of the Great Recession, high-cost lending remained at very low levels for almost a decade, but has recently begun to rise dramatically, especially among Latino and Black home seekers (Haupert 2019; Loya and Flippen 2020).
Neighborhood inequality is also imbedded in the homeownership process. More specifically, the segregation of minority neighborhoods continues to constrain access to low-cost credit products which limits financial investments in the neighborhood and the quality of community amenities such as parks, hospitals, and schools (Downey and Condron 2016; Faber 2018b; Taylor 2019). In addition, minority neighborhoods generally have lower quality housing and a higher proportion of multi-family units, which reduces the number of homeownership opportunities compared to White neighborhoods (Dwyer 2010; Faber 2018a; Hall and Greenman 2013; Rothstein 2017).
The refinance mortgage market also differs compared to the homeownership market more broadly. Previous housing research primarily focuses on homeownership opportunities for borrowers seeking to buy a home via an initial mortgage origination (Acolin et al. 2017; Calem, Lambie-Hanson, and Wachter 2020; Casey, Glasberg, and Beeman 2011; Cherian 2014). In addition, buying a home is establishing a vehicle for generating wealth, through future home price appreciation and inflation if the borrower has a fixed low-cost mortgage product. However, borrowers in the refinanced mortgage market are already homeowners, and for most in the refinanced mortgage market, they seek to improve their loan terms via a change in their interest rate, or the number of years on their loan, or they are trying to access a portion of their home’s accumulated wealth via a new mortgage. As a result, the selection of applicants into the home loan market and refinanced loan market differs. Also, it is unclear if similar trends of social stratification found in the homeownership market (Faber 2013; Flippen 2001; Krivo and Kaufman 2004), also extends to the refinance mortgage market.
While the impact of the housing market on ethno-racial inequality has been amply documented, many questions remain especially when considering the role of refinanced mortgage loans. Previous studies examining ethno-racial inequality in homeownership have primarily focused on structural lending patterns of mortgage originations across ethno-racial groups. As such, previous analyses assume that homeowners have similar or even greater access to mortgage refinancing due to their previous vetting by a financial institution and current homeownership status. In addition, it is unclear whether homeowners have access to the equity in their home or the ability to lower their costs by refinancing their mortgage to improve their loan terms (interest rate or years on the loan), make home improvements, or cash-out a portion of their home’s equity. It is unclear how ethno-racial groups, when considering the purpose for their mortgage refinance, perform in the refinance mortgage market. Using the HMDA data set, I examine the complex interactions between race and ethnicity and the reason for refinancing in structuring lending patterns, as it enables a more comparative and accurate assessment of the ethno-racial hierarchy through the form of refinanced mortgage credit access.
Wealth and Mortgage Refinance Disparities
There are tremendous wealth disparities across ethno-racial groups. Latinos and Blacks have lower levels of savings and wealth (Chetty, N. Hendren et al. 2014; Chiteji 2010; Keister 2000; Maroto 2016). In addition, the ethno-racial wealth gap has continued to grow over time and across generations (Hero and Levy 2016; Pfeffer and Killewald 2019; Thomas et al. 2020; Wolff 1992, 2014). As a result, minorities are less likely to achieve upward social mobility and make investments that will maximize and grow their assets (Chetty, F. Hendren et al. 2014; Dal Borgo 2019; Kuebler 2013; Mossakowski 2012; Percheski and Gibson-Davis 2020; Pfeffer and Killewald 2019; Thomas et al. 2020).
Home appreciation is a major source of wealth for minorities. To access the built-up home equity or reduce their housing costs, homeowners have four primary options: they can sell their home; they can open an equity line of credit using their home as collateral; they can obtain a second mortgage on their home; or they can refinance their original primary mortgage. Typically, the least expensive way to access their home’s equity or reduce their homeownership costs while continuing to live in their home is to refinance their mortgage loan. Selling their home provides access to their home’s equity, but they lose ownership of their home. An equity line of credit functions as a revolving credit account that maintains their homeownership but incurs a higher interest rate than a conventional refinanced loan. An applicant can also obtain a second mortgage to access their home’s equity, but these loans offer a higher interest rate than a conventional refinanced loan product.
Home equity accumulation and growth varies across neighborhoods. For instance, predominantly minority neighborhoods typically have lower property values and thus lower levels of housing equity than White neighborhoods (Do 2012; Flippen 2001; Howell and Korver-Glenn 2021; Korver-Glenn 2018). As housing equity grows, minority and low income homeowners are more likely to apply for a refinanced loan (Do 2012; Goodstein 2014). Reasons for a refinance vary, as homeowners may seek to reduce their short- or long-term housing costs by changing their loan terms (e.g., from a 30-year loan to 15-year loan) or by reducing their monthly payment through an interest rate reduction or extension of their loan terms (years). Homeowners may also seek to refinance their home loan to make home improvements or access their home’s equity via cash for personal consumption or investment.
Many questions remain on the relationship of ethno-racial stratification in the refinanced mortgage market. On one hand, positive loan outcomes across loan purposes in the refinance mortgage market might suggest that there is no ethno-racial advantage or disadvantage, and that access to refinanced credit reflects economic risk in the housing market. On the other hand, differential loan outcomes across ethno-racial groups regardless of the loan purpose may suggest that the ethno-racial hierarchy is maintained and reproduced in the refinanced mortgage market. If loan outcomes are mixed across ethno-racial groups and by loan purpose, this may suggest that certain elements of the ethno-racial hierarchy may be more flexible, depending on the ethno-racial groups involved and the reason for their refinanced loan (Bonilla-Silva 2004; Charles 2000; Loya 2022c; Massey 2005). The flexibility of the ethno-racial hierarchy may stem from the relative position of Asians and Latinos within the ethno-racial hierarchy across different social dimensions (Cobas, Duany, and Feagin 2009; Kim 1999; Loya 2022a; O’Brien 2008). By investigating the relative position of ethno-racial groups in the refinanced mortgage market, this study seeks to understand the challenges of accessing wealth rather than its creation via homeownership.
This study examines the role of race and ethnicity, and refinanced loan types in access to mortgage credit and documents the ethno-racial hierarchy in the refinanced mortgage market. First, I hypothesize that the ethno-racial hierarchy remains strong in the refinance market even after considering the loan purpose, such that Whites will outperform all other ethno-racial groups and Blacks will be the most disadvantaged in accessing a refinanced mortgage loan. Asians and Latinos will perform somewhere in between Whites and Blacks in obtaining a refinanced loan. Second, I hypothesize that access to a refinanced loan due to changing loan terms or making home improvements will be relatively easier across ethno-racial groups, while access to home equity through the form of a cash-out refinanced loan will be more limited.
Data and Methods
To address how the race and ethnicity of the borrower shapes disparities in institutional refinanced mortgage outcomes, I draw on publicly available data from the HMDA from 2018 to 2019. A major component of the Community Reinvestment Act’s (CRA) mandate to monitor the services, lending, and investments in minority and low-income communities requires all financial institutions with a national charter to provide HMDA information annually to the Federal Financial Institutions Examination Council (FFIEC) and the Consumer Financial Protection Bureau (CFPB). The data set contains a record of every loan application received, including the borrower’s socio-demographic characteristics, loan details, property type, census tract identifier, and outcome of the application, including the reason for denial and a high-cost loan indicator. HMDA is a representative sample of the mortgage lending market, as it covers about 80 percent of all mortgages (Avery et al. 2007). The year 2018 was the initial year that HMDA began reporting two important economic-risk indicators, the borrower’s debt-to-income (DTI) ratio and the value of the home. These additions allow for a more accurate view of the structured lending patterns across ethno-racial groups in the refinanced mortgage market by considering the applicant’s credit worthiness and their loan-to-home value ratio (LTV ratio). HMDA is also the only national public mortgage data set that contains the applicants’ race, ethnicity, and application neighborhood (Bradford 2002). As such, HMDA is the most commonly used source of data on ethno-racial disparities in the mortgage market (original and refinanced mortgages; Acolin et al. 2017; Cherian 2014; Faber 2013; Loya 2021; Loya and Flippen 2020; Quillian, Lee, and Honoré 2020).
I restrict the HMDA data set to non-institutional applicants requesting a refinanced mortgage loan for their owner-occupied single-family home (one to four units) in the United States, through a conventional or jumbo mortgage (i.e., Veteran’s Administration and subordinate refinance applications are not included). I also only considered borrowers who completed their refinance application and were vetted by their primary lender. More specifically, mortgages that were bought by other financial lenders and recorded in the HMDA data set are excluded since they were already recorded as a mortgage transaction by the initial lending institution. It appears that the missing data is random since I found no patterns across covariates especially when examining my main variables of interest, the applicant’s race and ethnicity, and the refinance loan type. As a result, I employed list-wise deletion for observations containing missing data.1,2 My analysis begins with the 2018 HMDA data set because this is the first year that included important additional demographic, economic, and loan indicators. These additions include the applicant’s age, their DTI ratio, and the home’s property value. My analysis ends with 2019 because it avoids the economic impact of the COVID-19 pandemic. 3 The COVID-19 pandemic altered the U.S. economy during 2020, which may have changed the behaviors of both the applicants and the financial institutions in the housing market. I also restricted the sample to single applicants and ethno-racially homogenous co-applicants to avoid the impact of interracial couples in assessing the ethno-racial hierarchy in the refinance mortgage market (Loya 2022c). Finally, I restrict the sample to White, Black, Latino, and Asian applicants, excluding Native Americans and Pacific Islanders due to their small sample size in certain U.S. regions. The final data set contains 3.79 million refinanced mortgage applications from 2018 to 2019.
Model Specification
The dependent variable is the outcome of a completed refinanced loan application. There are three possible outcomes to all applications: borrowers can be offered a conventional refinanced loan; they can be either approved for a high-cost refinanced loan, or be denied. First, I define a high-cost loan. The HMDA data set contains a high-cost loan indicator, which defines a high-cost loan origination as any loan with an annual percentage rate (APR) that is 1.5 points greater than the average prime APR offered at the time. Second, I define conventional loans as all other refinanced mortgage originations that are not high-cost loans. Finally, the HMDA data set contains refinanced loan denials. All denied loans are included in this study, with the exception of those that were denied for an incomplete application. 4 Ultimately, I created a multinomial dependent variable distinguishing between a conventional refinanced loan approval; a refinanced high-cost loan; and a refinanced mortgage denial. This dependent variable specification enables me to assess ethno-racial disparities for both better and worse forms of approval, and overall denial of refinanced mortgage credit.
The primary independent variable of interest relates to the race and ethnicity of the applicant. This variable is defined by the race and ethnicity of the primary applicant. An applicant is defined as Latino if they identify as Hispanic. 5 Among non-Latino applicants, they are defined as White, Black, or Asian. In addition to the race and ethnicity of the applicant, the HMDA data set also includes the purpose of the refinance. The reasons for the refinance include loans terms (interest rate or years of the loan), home improvement, and cash-out. Because these are three distinct purposes in accessing the home’s equity or reducing the cost of homeownership, the lender may also have different refinancing criteria and terms depending on the purpose of the loan. As such, I separated and conducted the multivariate analysis overall for the refinance mortgage market and across each segment of the refinanced mortgage market (a refinance for adjusting loan terms, a home improvement refinance, and a cash-out refinance).
In addition, I control for the socio-demographic characteristics of the borrower, including the applicant’s age, gender, whether there is a co-applicant, their DTI ratio, and their total household income. I also consider loan characteristics, including the loan amount requested, the LTV ratio, and loan terms (15-year or 30-year loan). Neighborhood characteristics are also imbedded throughout the financing process (Howell and Korver-Glenn 2021; Korver-Glenn 2018; Massey 2005; Sharkey and Faber 2014). As such, I consider neighborhood characteristics including the average age of housing in the community, the percentage of Whites in the neighborhood, and the average income of households in the neighborhood. I also take into account local variation in unemployment and changes in housing prices, since the labor and housing market are both racially and spatially stratified (Dwyer and Phillips Lassus 2015). As a result, I consider the annual county-level unemployment rate (U.S. Bureau of Labor Statistics 2015), calculated by the proportion of individuals in the labor force who are unemployed. 6 In addition, certain areas may be experiencing more housing price growth, which could be viewed more favorably by lenders, encouraging better loan outcomes. As such, I include the average housing price index (HPI) which is a score above 100 that captures changes in the value of single-family homes within a metropolitan statistical area (MSA; Federal Finance Housing Agency 2018). 7 Finally, I control for the U.S. region in which the property is located in, as defined by Census guidelines (U.S. Census Bureau 2020), and the year of the loan application.
Analytic Strategy and Methods
My analysis begins by providing descriptive statistics of refinanced application outcomes by race and ethnicity, and across loan purposes. Then I examine ethno-racial disparities in mortgage outcomes, overall and across refinanced loan purposes, net of differences in socio-demographic, loan, property, and locational characteristics. To assess ethno-racial disparities in refinanced mortgage outcomes, I estimate several multinomial logistic regression models with robust standard errors of loan outcomes (acceptance into a conventional loan [reference], acceptance into a high-cost loan, and a mortgage denial) for the overall refinanced mortgage market and across loan types (refinance for changing loan terms, refinance for home improvements, and refinance for cashing-out home equity).
A multinomial logistic regression model enables me to utilize the entire data set and provides consistent and efficient parameter estimations. By incorporating robust standard errors, I correct for the underestimation of standard errors that may occur from neighborhood level covariates in the models. I also considered an alternative modeling approach, a multi-level multinomial hierarchical linear model (HLM), which examines individual, neighborhood, county, and metropolitan level influences on refinanced mortgage outcomes. However, the main disadvantage of using the multi-level multinomial HLM approach is that it is computationally intensive, which requires a substantially reduced sample size that makes it difficult to obtain consistent parameters for Asians and Blacks across different segments of the refinance mortgage market. The substantive findings were similar across modeling approaches, and because neighborhood, county, and metro level effects are not my main concern, I report the results from the multinomial logistic regression models (with robust standard errors).
Descriptive Results
Figure 1 presents my dependent variable, the outcome of a completed refinance loan application overall, and by race and ethnicity, and loan purpose. The figure shows substantial ethno-racial differences in refinance outcomes. Overall, Black and Latino applicants are less likely to be approved for a refinanced conventional loan, more likely to be approved for a high-cost loan, and more likely to be denied for a refinanced mortgage loan, compared to White and Asian applicants.
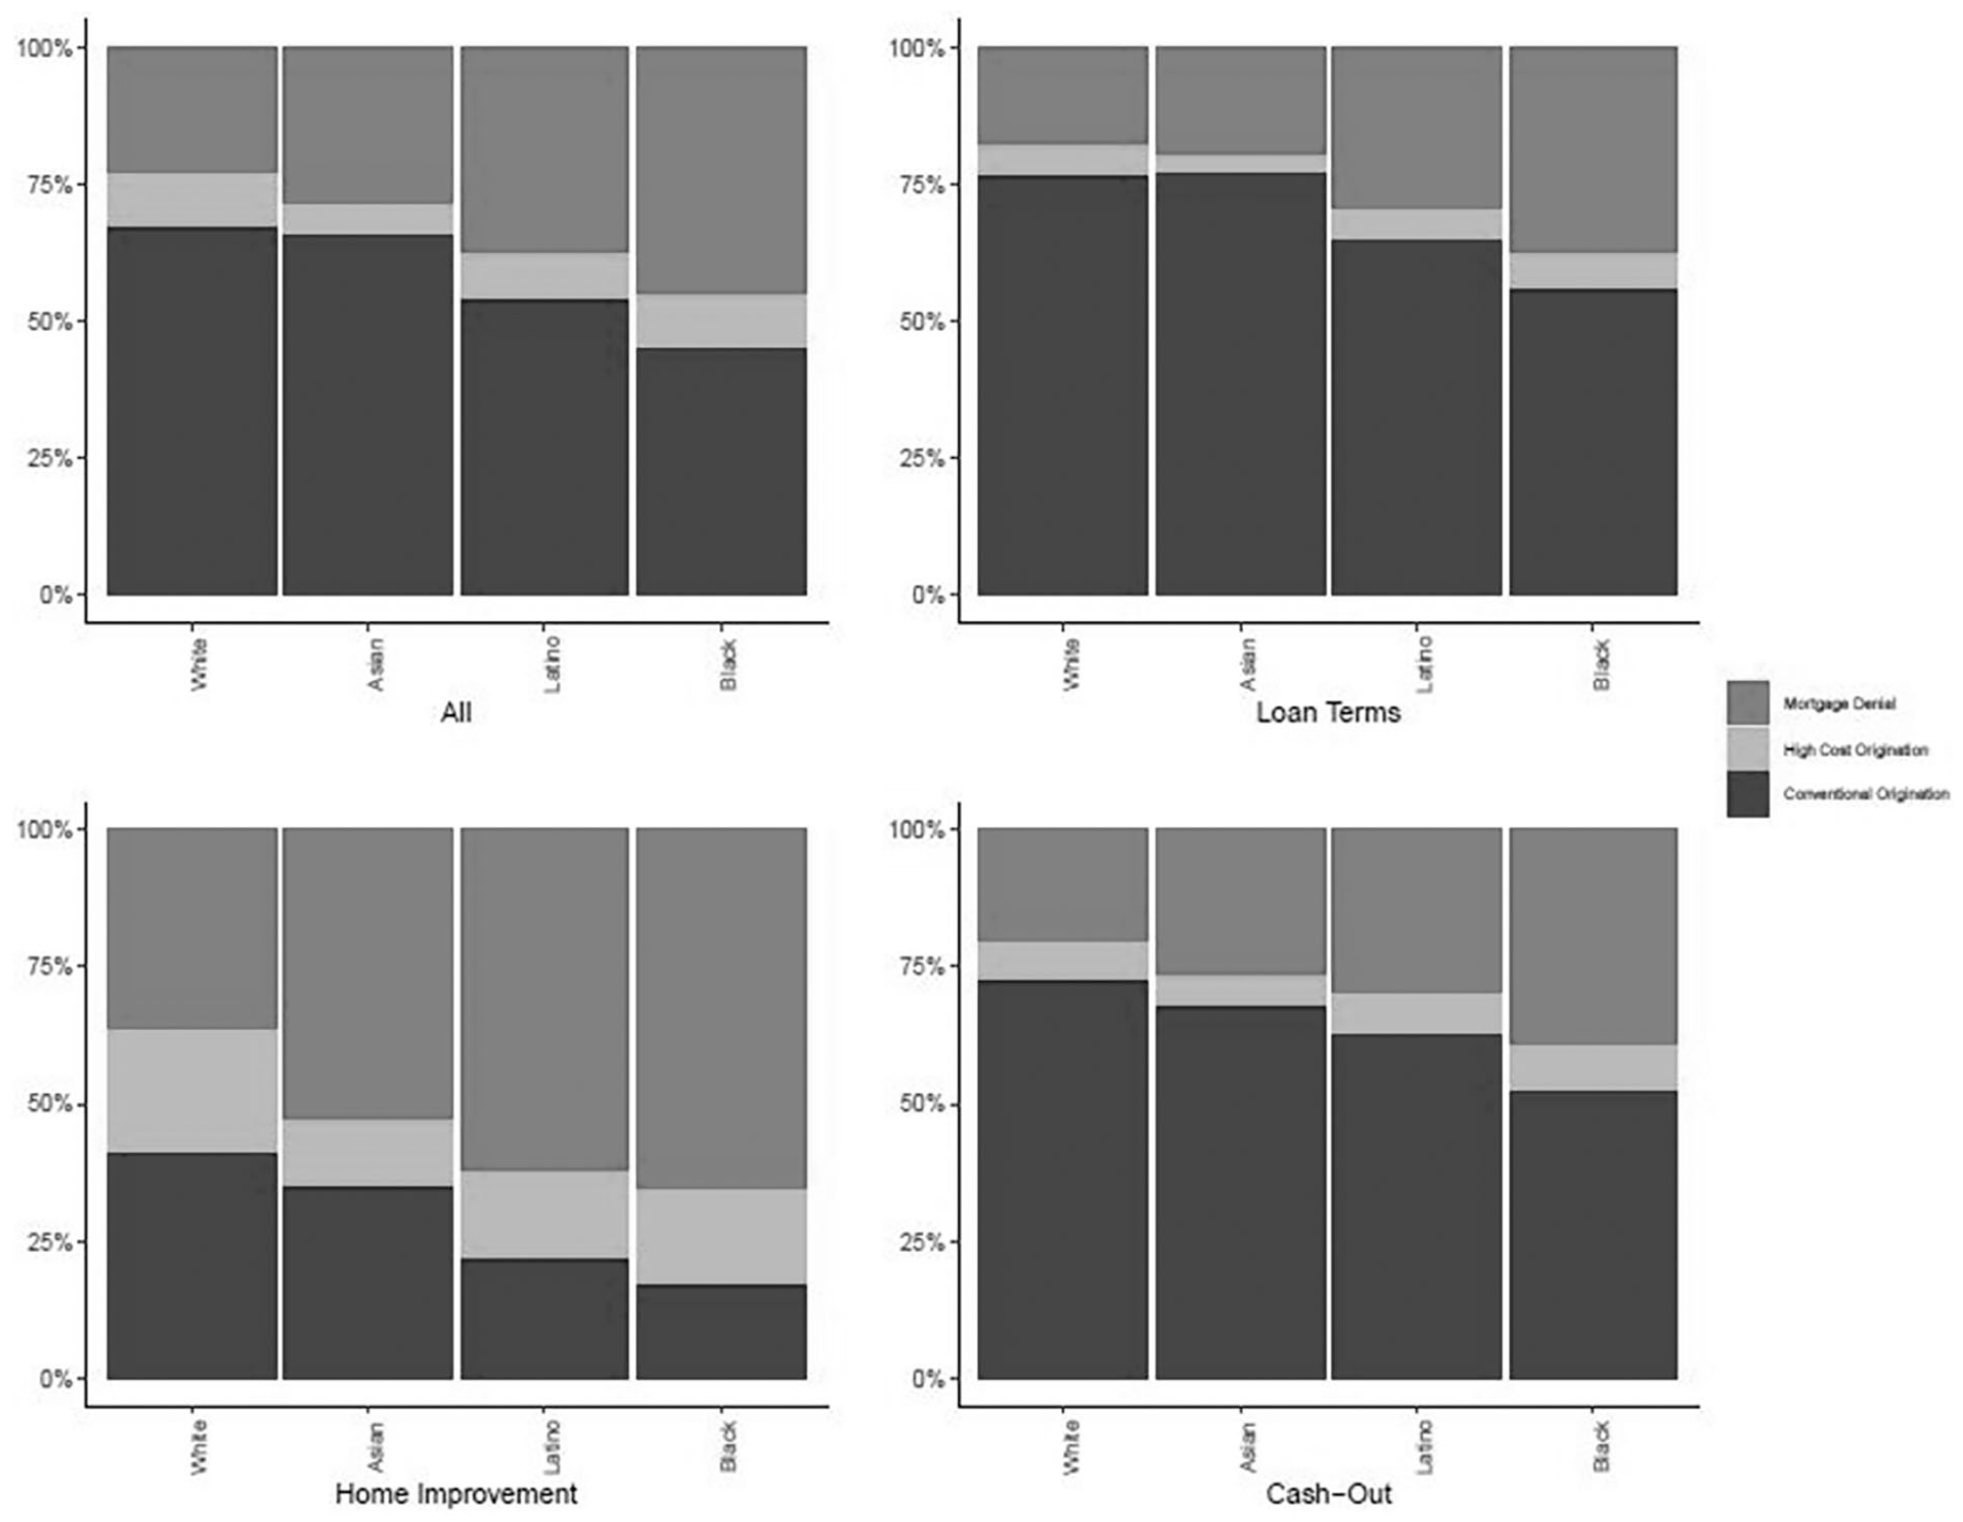
Refinanced loan application outcomes, by loan purpose and race and ethnicity; 2018 to 2019.
The figure also highlights dramatic differences in the refinance market across loan purposes. Rates of a conventional loan approval are highest among those that intend to change loan terms (i.e., interest rate or years on the loan) or cash-out equity, while conventional loan rates are lowest for home improvement loans. For instance, among refinanced loans for the purpose of changing loan terms and cashing-out, about 75 percent of White applicants obtained a conventional loan, while only about 40 percent of Whites that sought a home improvement loan were offered a similar loan. Mortgage denials also show marked variation by race and ethnicity. Across ethno-racial groups, Whites and Asians are less likely to be denied than Black and Latino applicants.
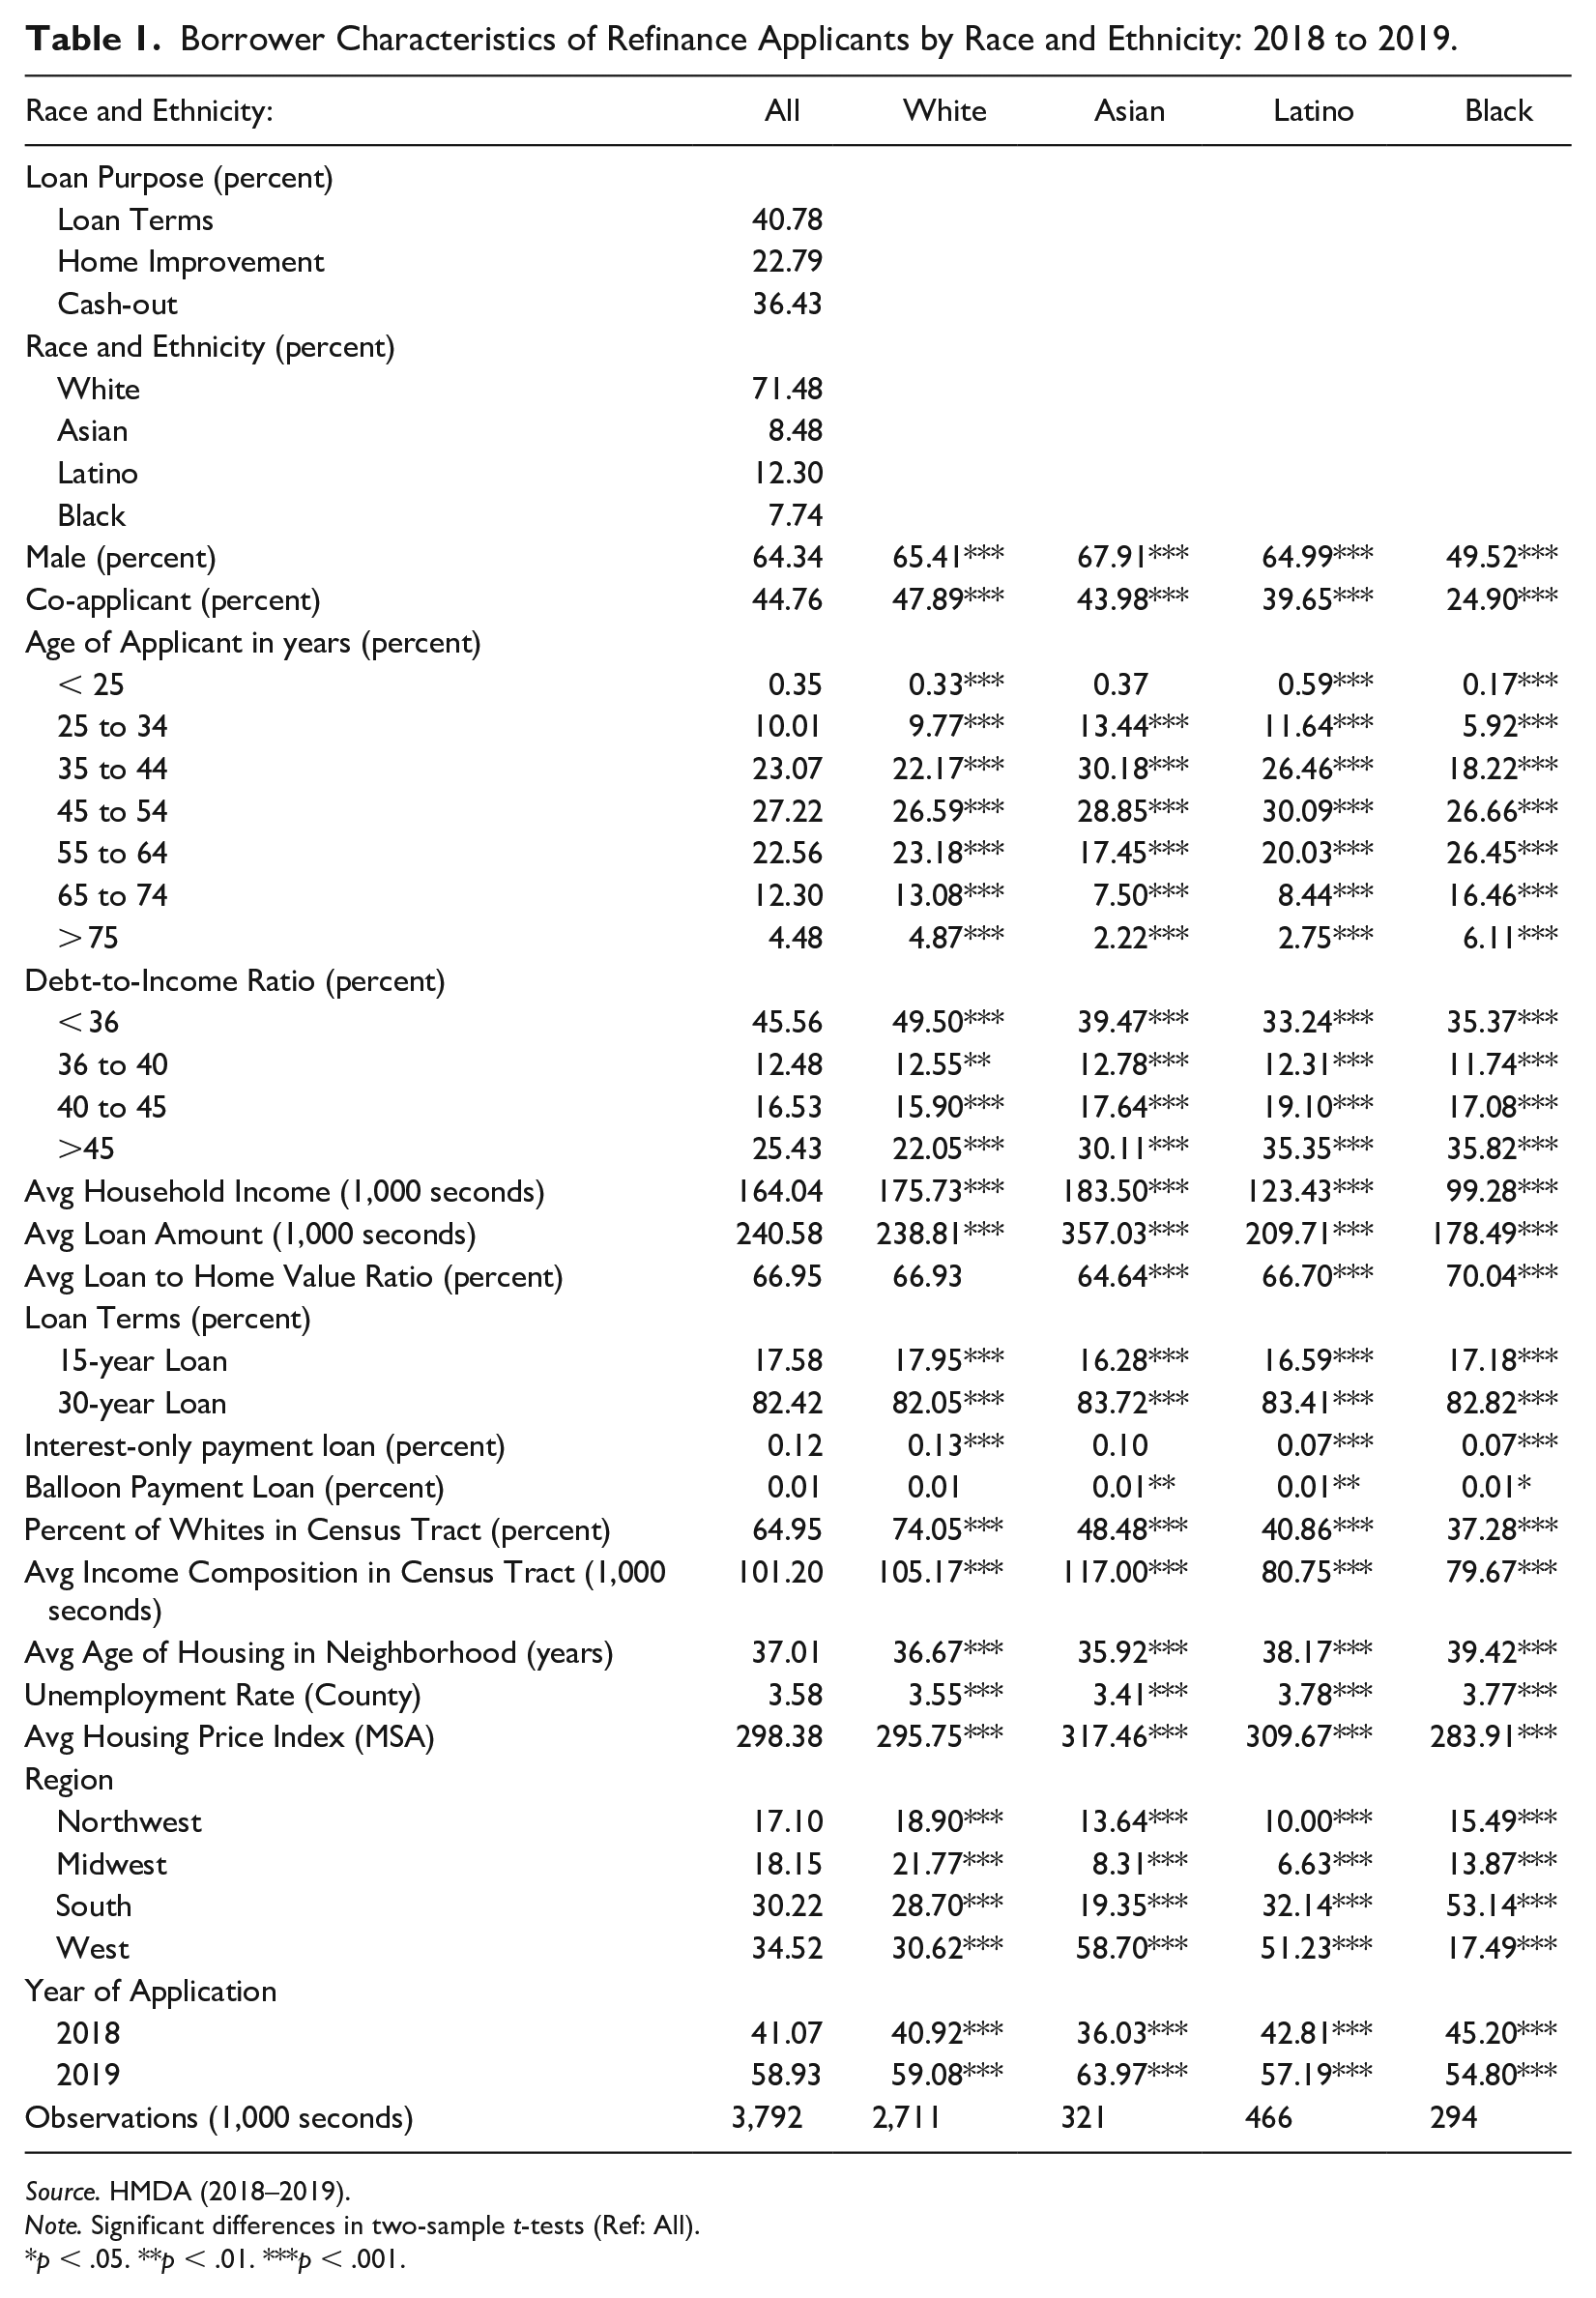
Table 1 displays average demographic, loan, and locational characteristics overall and by race and ethnicity. From 2018 to 2019, about 41 percent of borrowers were seeking to refinance their home for the purpose of changing loan terms, followed by those applying for a cash-out refinance (about 36 percent), and a home improvement refinance loan (about 23 percent). Approximately 71 percent of refinance applicants are White, followed by Latinos (about 12 percent), Asians (8 percent), and Blacks (8 percent). The majority (64 percent) of applicants are males. Whites, Asians, and Latinos have a similar proportion of males (about 65 percent), while only 50 percent of Black applicants are males. About 45 percent of applicants have a co-applicant. Whites and Asians have the highest co-applicant levels (48 percent and 44 percent), compared to Latinos (40 percent) and Blacks (25 percent).
Borrower Characteristics of Refinance Applicants by Race and Ethnicity: 2018 to 2019.
Source. HMDA (2018–2019).
Note. Significant differences in two-sample t-tests (Ref: All).
p < .05. **p < .01. ***p < .001.
Less than one percent of applicants are less than 25 years old, 33 percent are between the ages of 25 and 44 years, 50 percent are between the ages of 45 and 64 years, and about 17 percent are above 65 years old. The age distribution for Asians and Latinos is younger, while the age distribution of Blacks is older. About 45 percent of applicants have an excellent DTI ratio (a DTI ratio less than 36 percent), 30 percent have an average DTI ratio (a DTI ratio between 36 percent and 45 percent), and 25 percent have a poor DTI ratio (a DTI ratio greater than 45 percent). There is a higher proportion of White applicants with an excellent DTI ratio, while Latinos and Blacks have a higher proportion of applicants with a poor DTI ratio. The average income of applicants is about $164,000. White and Asian applicants have the highest income levels (about $175,000 and $185,000, respectively) compared to Latinos and Blacks (about $125,000 and $100,000, respectively).
As it pertains to refinanced mortgage loan characteristics, the average loan amount requested is about $240,000. Asians requested the largest loan amount ($357,000), while Latinos and Blacks requested the lowest loan amount (about $210,000 and $180,000, respectively). The average LTV ratio is about 67 percent and this pattern remained consistent across ethno-racial groups. In addition, about 82 percent requested a 30-year loan.
When examining the neighborhood characteristics in which the property is located in, there is also tremendous variation across ethno-racial groups. Overall, borrowers applied in neighborhoods that are about 65 percent White. Whites applied in neighborhoods that are predominantly white (74 percent White), while Asians applied in neighborhoods that are only about 50 percent White. Latinos and Blacks applied in predominantly minority neighborhoods (about 38 percent and 41 percent White). Overall, borrowers also applied in neighborhoods that have an average income of about $101,000. Asians sought homes in the highest income neighborhoods (about $117,000), while Latinos and Blacks applied in lower income neighborhoods (about $80,000). Overall, the average age of housing in the neighborhood is about 37 years old.
The location and economic conditions of the area in which the property is located in also varies across ethno-racial groups. Overall, borrowers applied in counties with an average unemployment rate of about 3.6 percent. Latinos and Blacks applied in areas with the highest unemployment rate (about 3.8 percent), while Asians applied in areas with the lowest unemployment rate (about 3.4 percent). Overall, the average HPI is about 298. Asians and Latinos applied in the least affordable areas (an HPI score of 317 and 310, respectively), while Blacks applied in the most affordable areas (an HPI score of 284). The majority of homes are located in the West and South (about 35 percent and 30 percent, respectively), compared to the Midwest and Northeast (about 17 percent each). Asians and Latinos are heavily concentrated in the Western region, while Blacks are heavily concentrated in the South. Finally, about 60 percent of refinance applications occurred in 2019.
Multivariate Results
Figure 2 displays stark differences when examining the odds ratios for obtaining a high-cost refinanced loan versus a conventional refinanced mortgage. In general, Black applicants underperform all other ethno-racial groups given a specific refinanced loan purpose. In addition, Asians generally outperform all other ethno-racial groups overall and across loan purpose except when trying to cash-out equity from their home. Latinos generally perform similarly compared to Whites overall and when they seek to change their loan terms but perform in between Whites and Blacks when seeking to make home improvements and cashing-out equity from their home. To illustrate, among those that sought a refinance (overall), the odds ratios of obtaining a high-cost loan (versus a conventional loan) is 21 percent higher for Blacks, while Latinos perform similarly as Whites. Asians outperform, as they are about 6 percent less likely to obtain a high-cost loan compared to Whites.
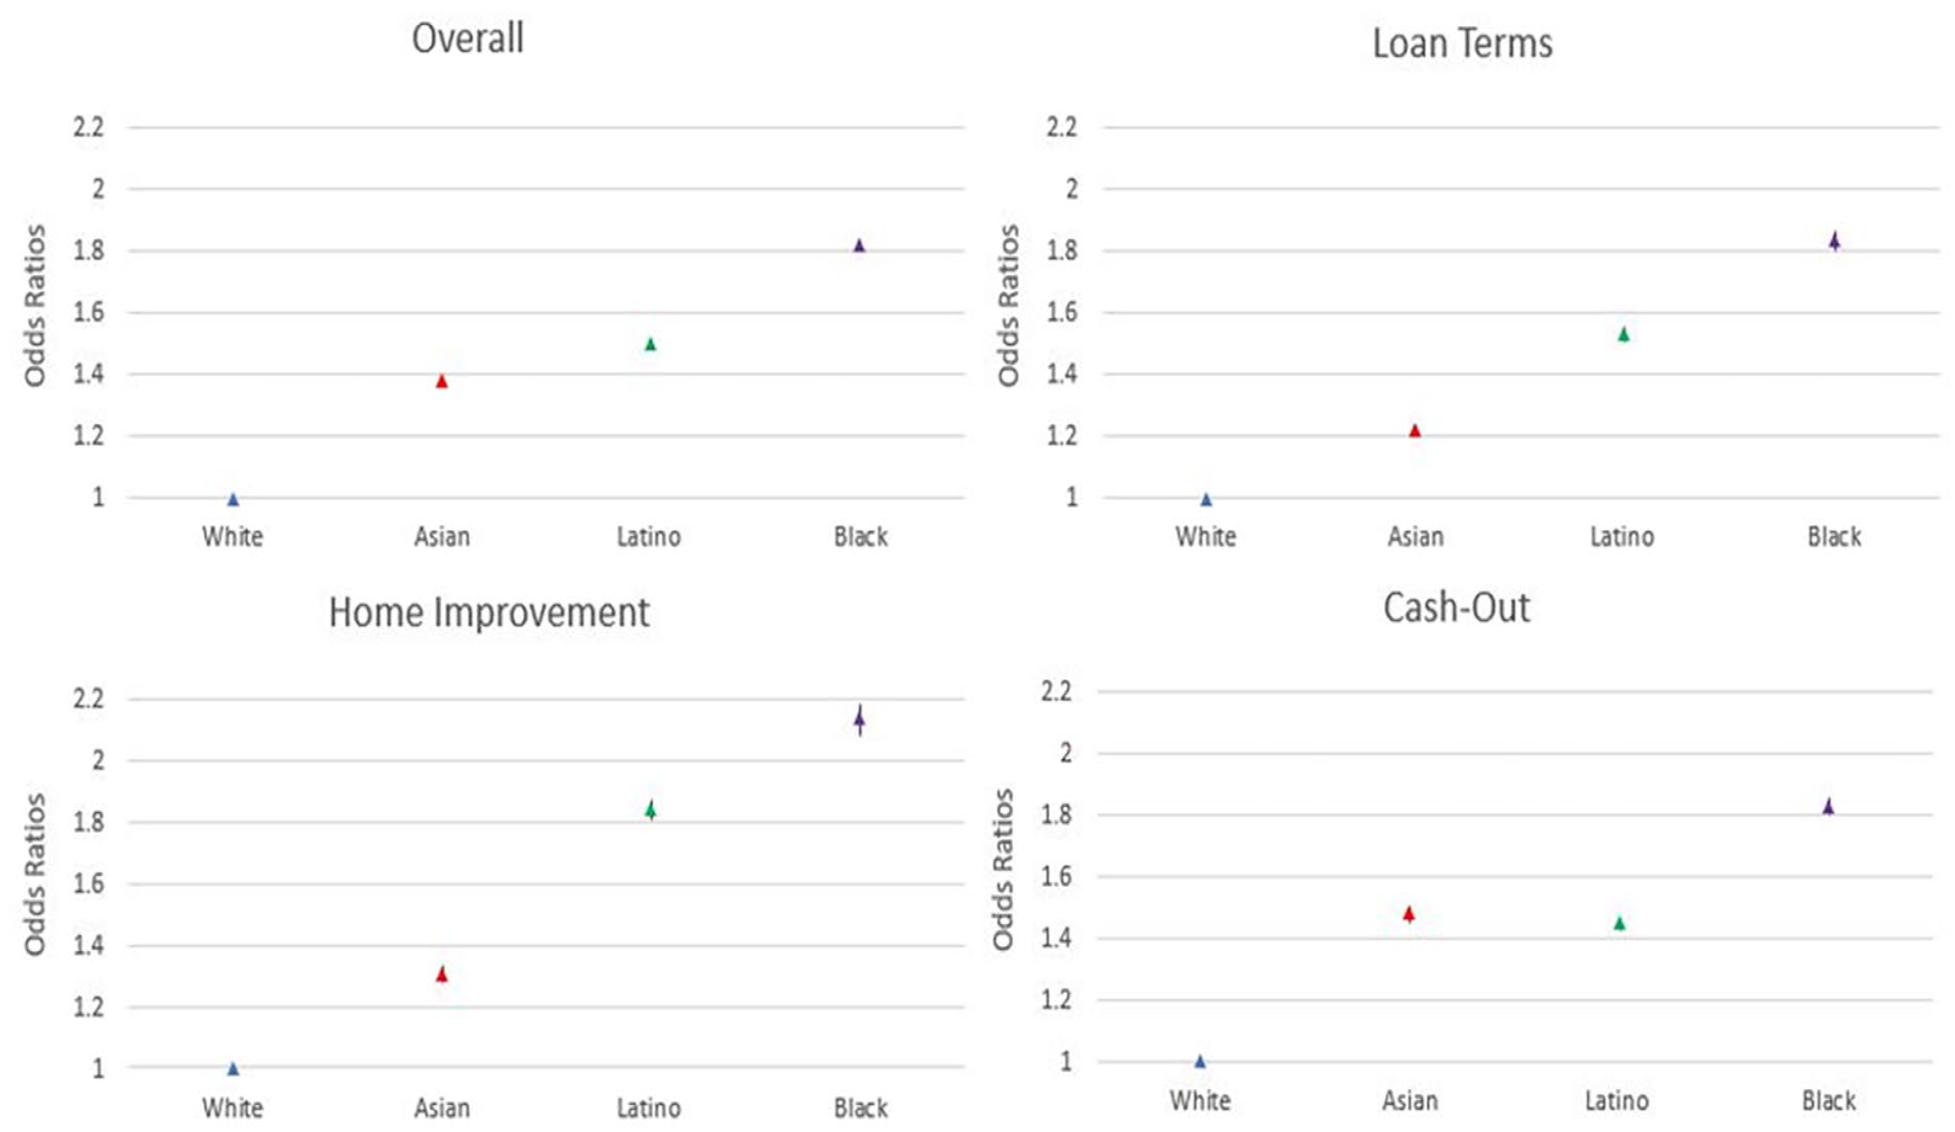
Odds ratios from multinomial logistics regression model predicting refinanced loan application outcomes: Mortgage denial (ref = conventional and Whites applicants).
When examining Figure 2, a clearer assessment can be made about my initial hypotheses related to ethno-racial stratification in the refinance market. A similar pattern of ethno-racial stratification exists when examining the odds ratios for high-cost loans (versus conventional loans) among those seeking to change their loan terms or trying to make home improvements. Blacks once again underperform all other ethno-racial groups, while Latinos underperform, and Asians outperform Whites. For instance, among those seeking to refinance their home to make home improvements, Blacks are 34 percent more likely to obtain a high-cost loan compared to similar Whites. Latinos are 13 percent more likely, while Asians are 17 percent less likely to obtain a high-cost loan compared to Whites. A slightly different trend of ethno-racial stratification exists when examining high-cost loans among those seeking to cash-out a portion of their home’s equity. On one hand, Blacks underperform all other ethno-racial groups as they are 34 percent more likely to obtain a high-cost loan when seeking a cash-out refinance compared to similar Whites. On the other hand, Whites outperform all other ethno-racial groups. Asians and Latinos perform in between Whites and Blacks as they are about 12 percent more likely to obtain a high-cost refinance loan compared to Whites.
As it pertains to my second hypothesis, access to refinancing varies across loan purpose and ethno-racial groups. Asians are more likely to obtain a high-cost loan compared to Whites when seeking a cash-out refinance compared to seeking changes to their loan terms or making home improvements. To illustrate, Asians are 15 percent more likely to obtain a high-cost loan compared to Whites when seeking a cash-out refinance, compared to being 5 percent less likely when trying to change their loan terms or make home-improvements. Latinos and Blacks are more likely to obtain a high-cost loan compared to Whites when they seek a cash-out or home improvement refinance loan. For example, Blacks are about 33 percent more likely to obtain a high-cost loan than Whites when seeking a cash-out or home improvement refinance loan, compared to only 23 percent more likely to obtain a high-cost loan when seeking to change their loan terms.
In Figure 3, the ethno-racial disparities and patterns across loan purposes change slightly when examining the odds ratios for refinance rejections. In addition, the magnitude of the odds ratios is greater when examining ethno-racial disparities in mortgage denials compared to high-cost originations. Overall and across the purpose of the refinance loan, Blacks once again underperform all other ethno-racial groups as they are more likely to be denied a refinanced loan and Whites are the least likely to be denied. Asians and Latinos perform in between Whites and Blacks. However, Latinos generally outperform Blacks and underperform Asians, while Asians generally outperform Latinos and underperform Whites. For instance, in the overall refinance market, Blacks are 82 percent more likely to be denied compared to similar Whites, while Latinos and Asians are, respectively, 50 percent and 37 percent more likely to be denied a refinance loan than Whites.
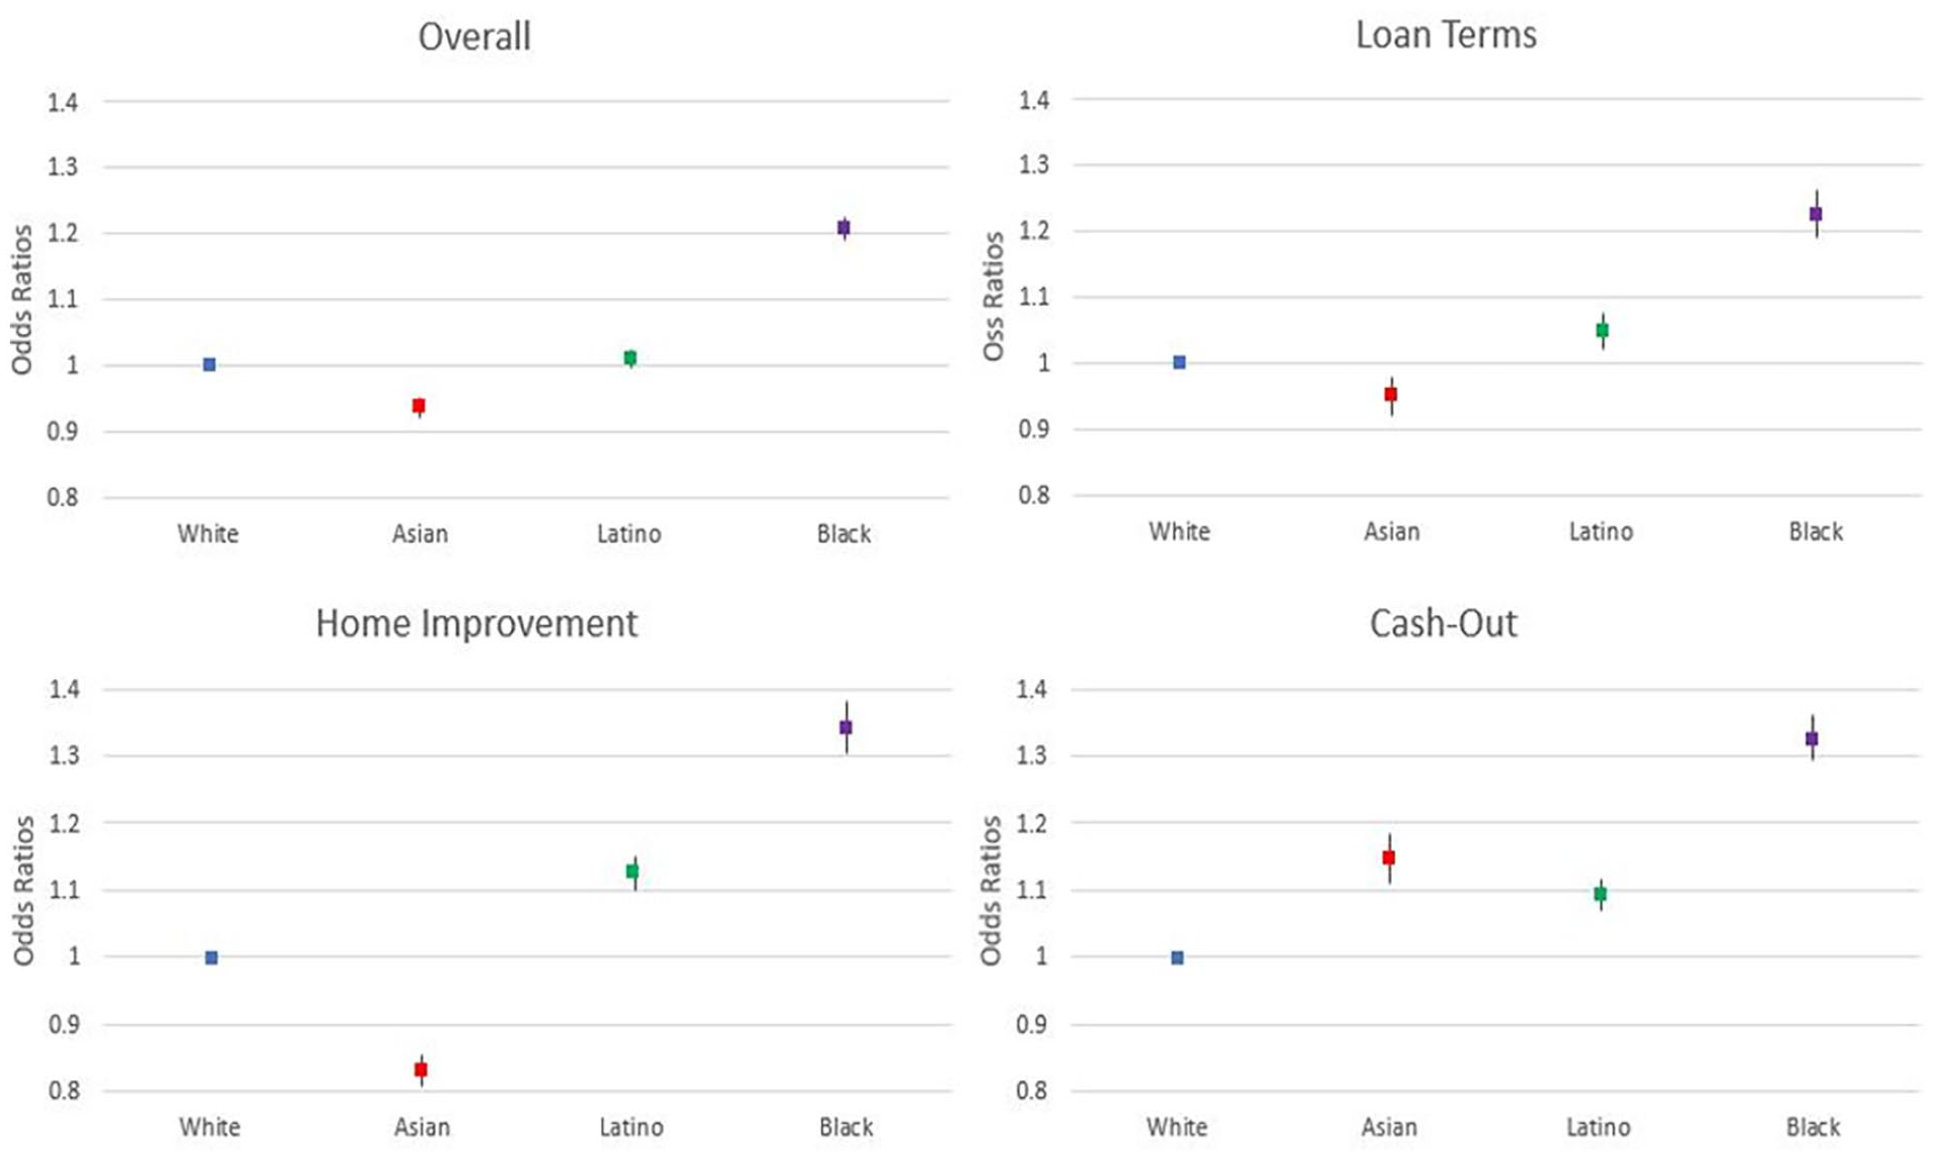
Odds ratios from multinomial logistics regression model predicting refinanced loan application outcomes: High-cost organization (ref = conventional, and Whites applicants).
When examining Figure 3, a similar pattern of ethno-racial stratification emerges when examining the odds ratios for a mortgage denial (versus a conventional loan origination) among those seeking to change their loan terms or trying to make home improvements. White applicants outperform all other ethno-racial groups, while Blacks are the most disadvantaged. In addition, Latinos and Asians perform in between Whites and Blacks, while Latinos underperform Asians. To illustrate, among those seeking to make home improvements, Blacks are 113 percent more likely to be denied compared to Whites. Latinos and Asians are, respectively, 83 percent and 30 percent more likely to be denied compared to Whites. A slightly different trend of ethno-racial stratification exists when examining denials among those cashing-out a portion of their home’s equity. Blacks underperform all other ethno-racial groups as they are 83 percent more likely to be denied when seeking a cash-out refinance compared to Whites. Whites outperform all other ethno-racial groups, while Asians and Latinos perform in between Whites and Blacks, as they are, respectively, about 4 percent and 48 percent more likely to be denied a refinance loan compared to Whites.
Access to refinancing varies across loan types and ethno-racial groups. Asians are more likely to be denied than Whites when seeking a cash-out refinance compared to changing their loan terms or making home improvements. To illustrate, Asians are 48 percent more likely to be denied a mortgage compared to Whites when seeking a cash-out refinance compared to being 22 percent and 30 percent more likely to be denied when seeking to change their loan terms or make home improvements. Latinos and Blacks are more likely to be denied a loan compared to Whites when they seek a home improvement refinance loan compared to all other refinance reasons. For example, Blacks are about 113 percent more likely to be denied than Whites when seeking a home improvement refinance loan, compared to only 83 percent more likely to be denied when seeking to change their loan terms or cash-out housing equity.
Conclusions and Direction for Additional Research
The mortgage refinance market plays a major role in perpetuating wealth and debt stratification and maintaining ethno-racial inequality in housing. The growing importance of homeownership in sustaining and growing wealth points to the need for continuous study on the evolution and accessibility of refinancing mortgage debt in the lending industry and warrants additional research on how the ethno-racial hierarchy is shaped by mortgage refinancing, particularly for Latinos and Blacks. Using HMDA from 2018 to 2019, I document important ethno-racial inequality across refinancing purpose in access to refinancing credit.
The continuance of ethno-racial inequality in access to mortgage refinancing is striking, even after considering the reason for the loan, socio-demographic, loan, neighborhood, and spatial characteristics. Latino and Black refinance applicants are substantially more likely to receive a high-cost loan or be rejected than similar Whites. While Asians are just as likely or are less likely to obtain a refinanced high-cost loan compared to Whites, Asians experience higher levels of refinance loan rejections. In addition, the Latino and Black disparities with Whites were not only statistically significant, they were also substantively large. I also demonstrated that the purpose of the refinance also shapes mortgage outcomes, as borrowers applying to make home improvements or trying to cash-out a portion of their home’s equity are more likely to experience an adverse loan outcome than those applying to improve their loan terms.
I also showed tremendous variation in refinance mortgage outcomes when considering both the applicant’s race and ethnicity and their reason for refinancing. Latino and Black borrowers seeking to refinance their home to make improvements or take cash-out of their home’s equity were much more likely to experience an adverse loan outcome than similar Whites. In spite of a healthy refinance mortgage market with historically low interest rates and strict lending requirements stemming from legislation of the Great Recession, the ethno-racial gap remains statistically and substantively large.
The lack of complete information on the applicant’s credit profile and socio-demographic characteristics, such as legal status, wealth, and credit score makes it difficult to assess ethno-racial discrimination in the refinance mortgage market. My findings add to our previous understanding of structured lending disparities in the housing market. These trends suggest that Latinos and Blacks have less and more expensive access to mortgage refinancing especially when trying to access their home’s equity to make home improvements or when cashing-out equity. Regardless of the precise mechanisms of these ethno-racial disparities, it appears that the substantial inequality in high-cost refinancing and denials are the norm.
The implications of these patterns for ethno-racial stratification and the wealth gap are profound. This study demonstrates the structural inaccessibility of home refinancing for minorities, especially when refinancing for home improvements or taking cash-out of their equity. Latino and Black homeowners who want to take advantage of the equity in their home are unable to access low-cost refinance loans. These barriers that minorities face in the refinance mortgage market do not allow them to grow their wealth or increase their personal consumption. The lack of access to mortgage refinancing for Latinos and Blacks may force them to sell their property to realize their home’s equity. This prevents minorities from making additional investments and may increase residential turnover in the neighborhood. Because of ethno-racial inequality in the mortgage refinance market, using homeownership and the equity built from owning a home as a tool to close the ethno-racial wealth gap is constrained. Access to housing equity in the form of low-cost refinancing for Latinos and Blacks is limited regardless of their refinance purpose.
There is a strong and direct connection between homeownership and creating wealth in the United States, especially because of government incentives such as reduced taxes and subsidies. Research often focuses on this connection, by investigating homeownership opportunities and disparities across ethno-racial groups. However, access to the wealth generated via housing equity is often overlooked or is assumed to be equal across ethno-racial groups. This study demonstrates how the ethno-racial wealth gap has been previously underestimated. The differential access to refinanced mortgage credit across ethno-racial groups suggests that minorities may be building wealth through home equity but find it more difficult to access it via refinancing compared to Whites. As a result, minority homeowners may be forced to sell their home sooner than expected and at higher levels to access their accrued wealth. Finally, differential access to refinance mortgage credit among minority homeowners limits the benefits of homeownership and potentially increases the cost of owning a home because minorities are unable to take advantage of lower mortgage interest rates and cannot fully realize the appreciation of their home.
My study demonstrates the importance and continuation of an ethno-racially structured mortgage refinancing market. Ethno-racial stratification research typically highlights specific ethno-racial hierarchies (e.g., White-Black, White-non-White, and tri-racial hierarchy); however, my study supports certain elements of these theoretical ethno-racial positions. On one hand, Black applicants regardless of the reason for a refinance are the most disadvantaged in accessing refinancing credit. On the other hand, White applicants are the most advantaged in the refinance market. Depending on the adverse loan outcome, Asians perform similarly or underperform compared to Whites, while Latinos typically perform somewhere in between Whites and Blacks.
These findings also point to the need for data improvement on ethno-racial disparities in home lending (original mortgage financing or refinance). The lack of information on an applicant’s credit score and wealth in HMDA restricts our ability to hold financial institutions accountable for ethno-racial discrimination. Previous additions and improvements to HMDA data quality and the release of applicant and loan indicators in the data set have been successful, especially when data collection became more stringent, and covariates were more appropriately defined. Regulators need to add public HMDA requirements such as the applicant’s credit score, wealth, and legal status to properly understand housing inequality, especially related to ethno-racial discrimination.
Footnotes
Appendix A
Refinance Mortgage Loan Outcomes by Race and Ethnicity and Loan Purpose.
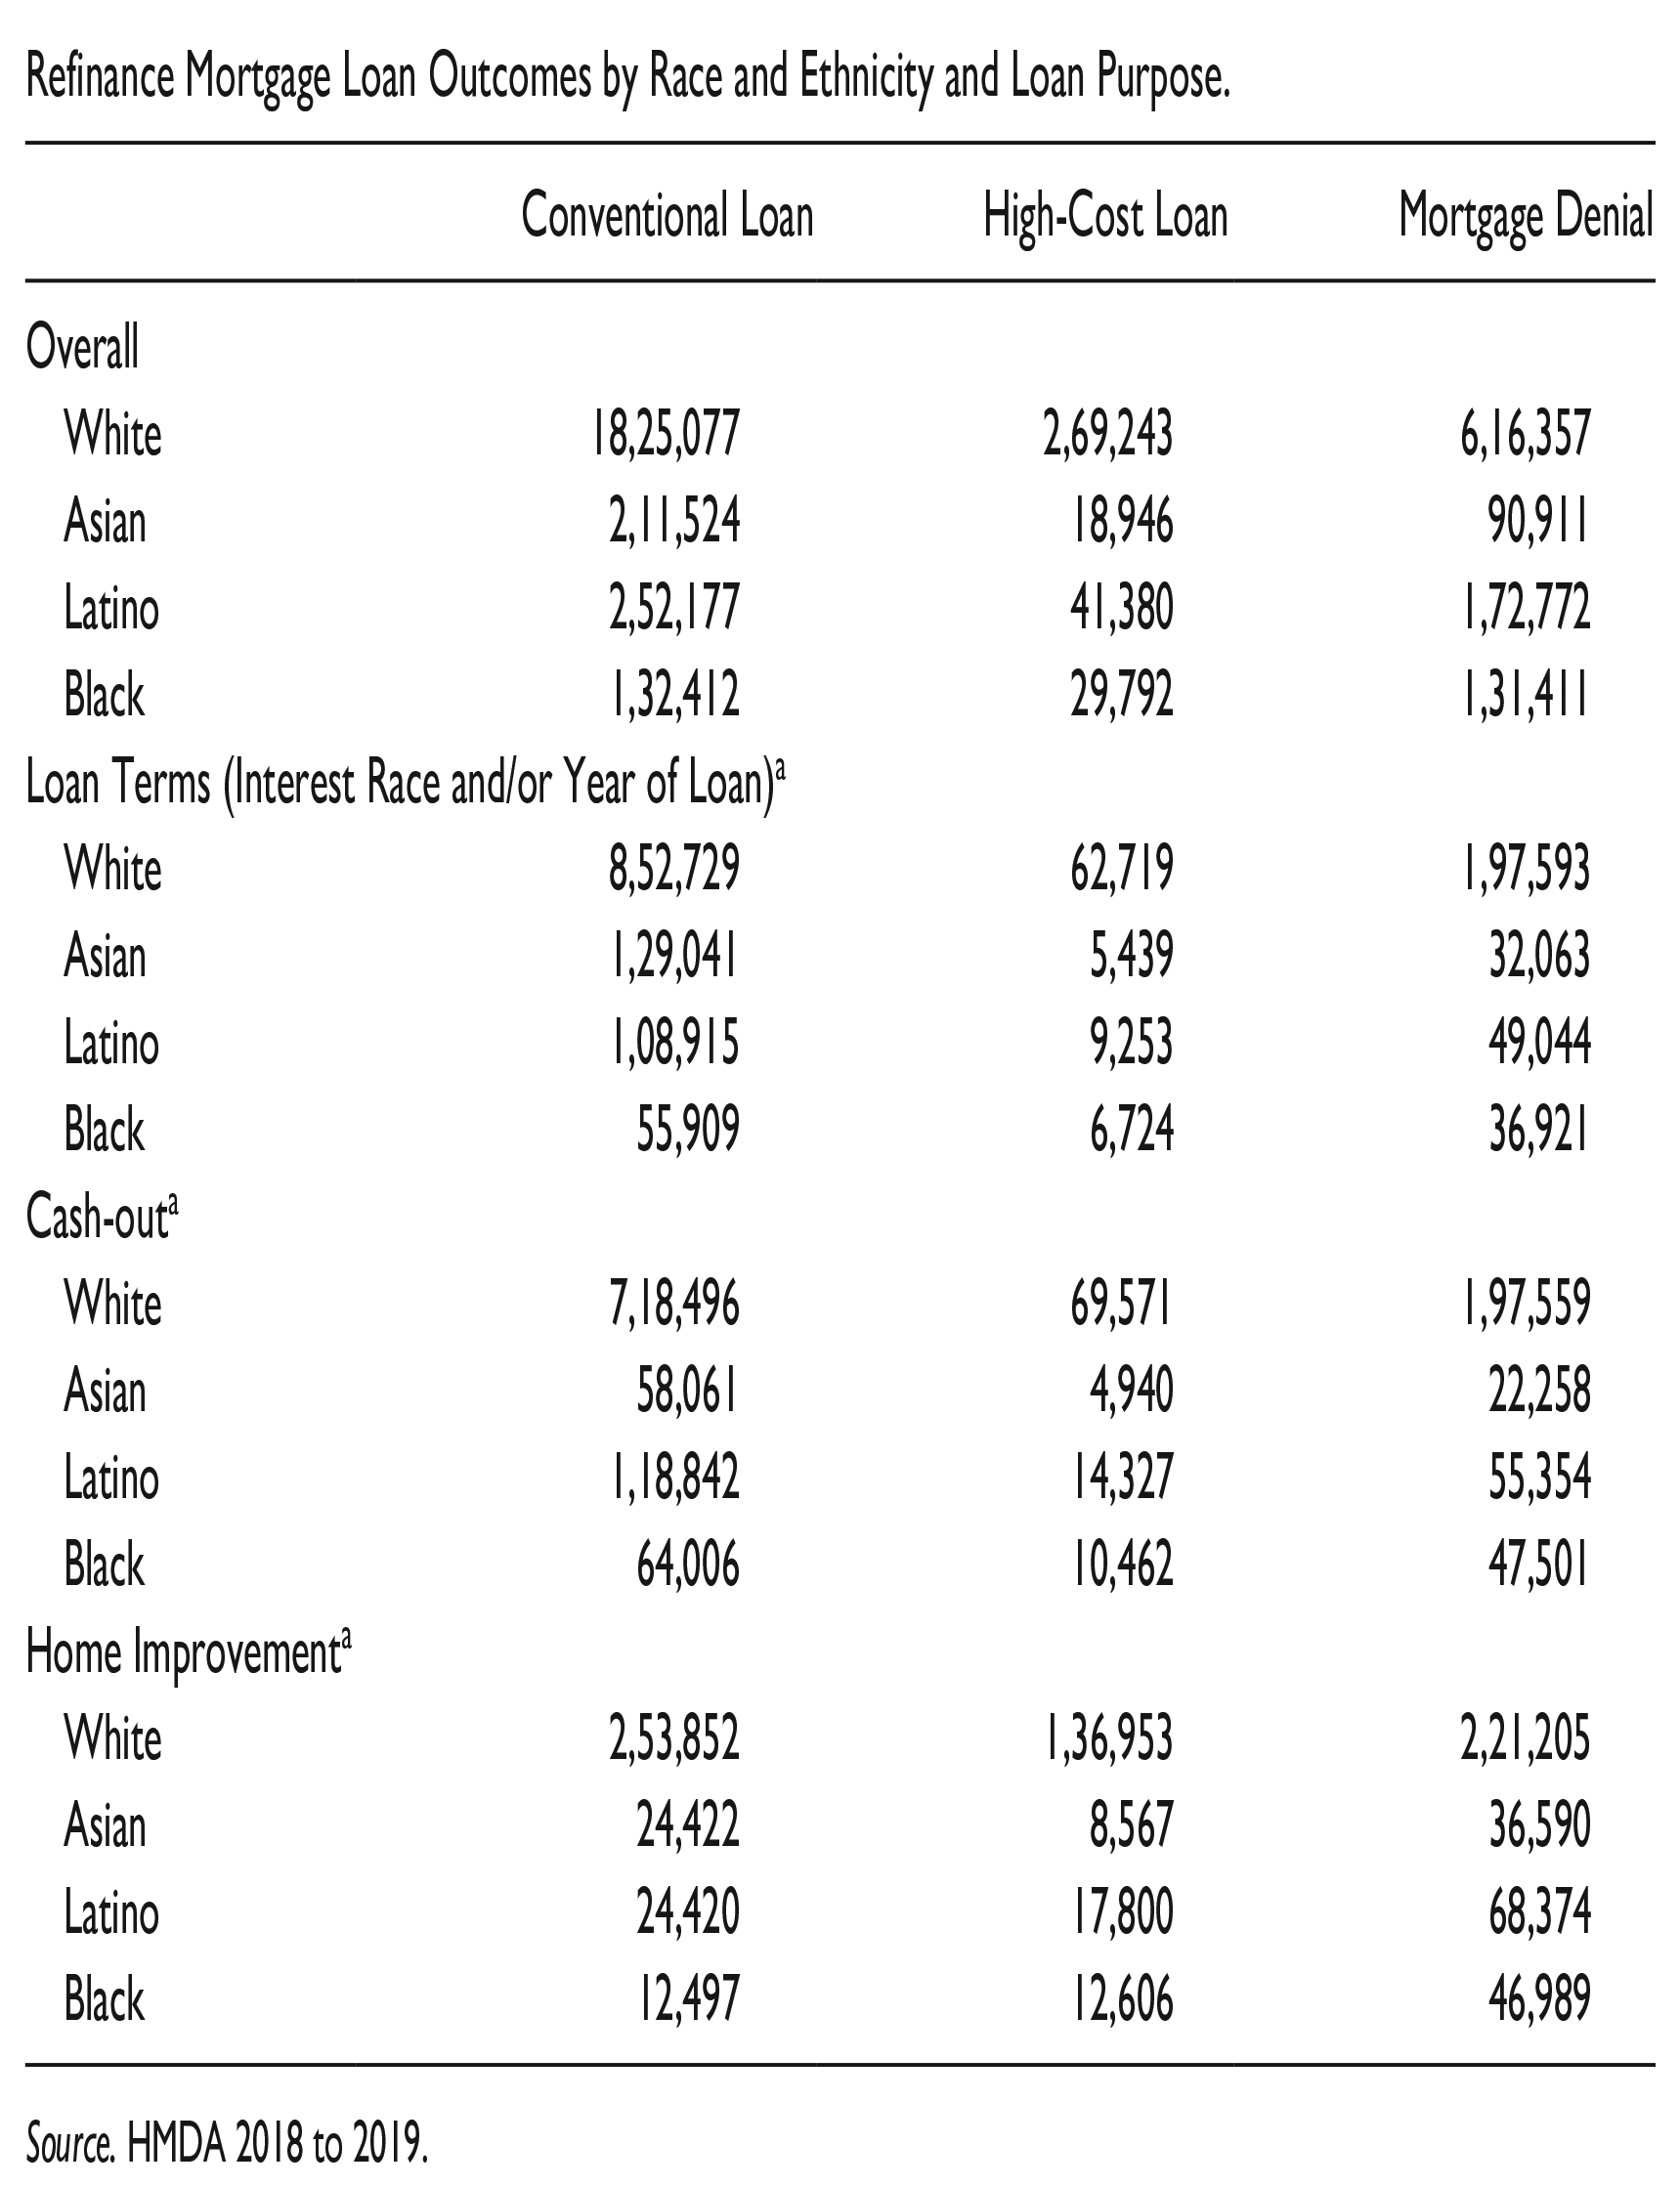
| Conventional Loan | High-Cost Loan | Mortgage Denial | |
|---|---|---|---|
| Overall | |||
| White | 18,25,077 | 2,69,243 | 6,16,357 |
| Asian | 2,11,524 | 18,946 | 90,911 |
| Latino | 2,52,177 | 41,380 | 1,72,772 |
| Black | 1,32,412 | 29,792 | 1,31,411 |
| Loan Terms (Interest Race and/or Year of Loan)a | |||
| White | 8,52,729 | 62,719 | 1,97,593 |
| Asian | 1,29,041 | 5,439 | 32,063 |
| Latino | 1,08,915 | 9,253 | 49,044 |
| Black | 55,909 | 6,724 | 36,921 |
| Cash-outa | |||
| White | 7,18,496 | 69,571 | 1,97,559 |
| Asian | 58,061 | 4,940 | 22,258 |
| Latino | 1,18,842 | 14,327 | 55,354 |
| Black | 64,006 | 10,462 | 47,501 |
| Home Improvementa | |||
| White | 2,53,852 | 1,36,953 | 2,21,205 |
| Asian | 24,422 | 8,567 | 36,590 |
| Latino | 24,420 | 17,800 | 68,374 |
| Black | 12,497 | 12,606 | 46,989 |
Source. HMDA 2018 to 2019.
Appendix B
Odds Ratios From the Multinomial Logistic Regressions With Robust Standard Errors, Predicting Refinanced Loan Application Outcomes: High-Cost Loan Origination (Ref: Conventional Loan Origination).
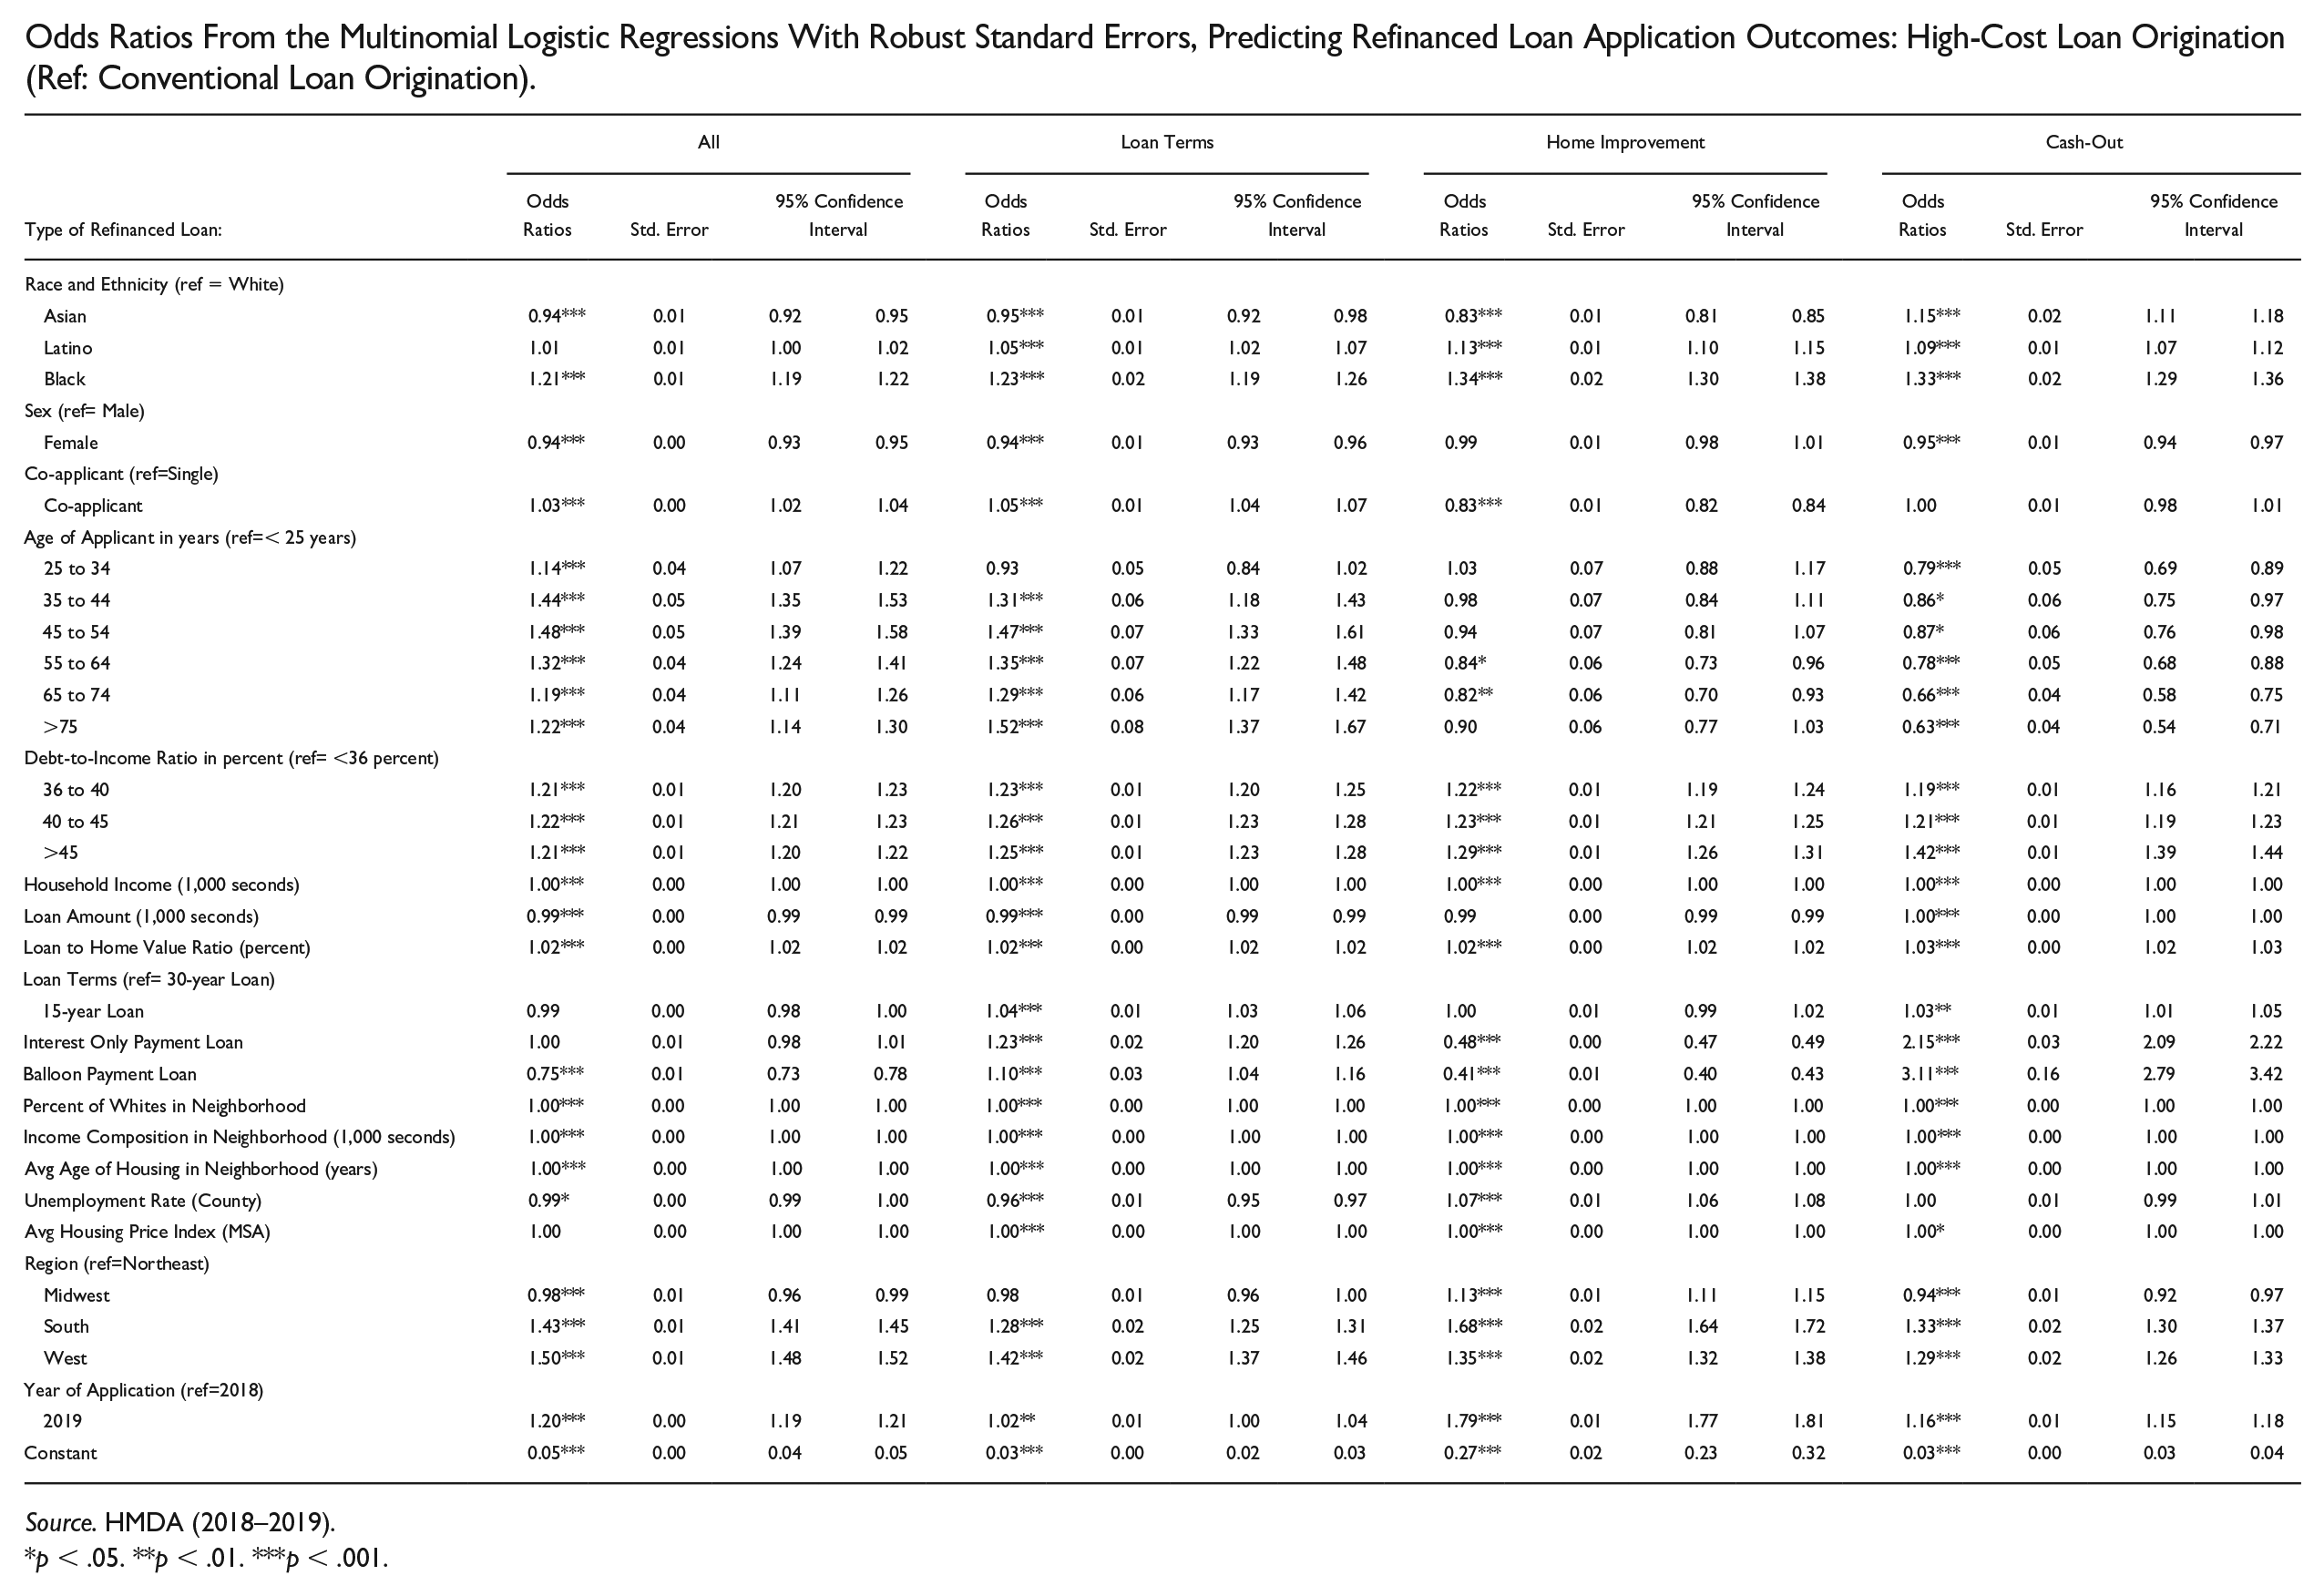
| Type of Refinanced Loan: | All | Loan Terms | Home Improvement | Cash-Out | ||||||||||||
|---|---|---|---|---|---|---|---|---|---|---|---|---|---|---|---|---|
| Odds Ratios | Std. Error | 95% Confidence Interval | Odds Ratios | Std. Error | 95% Confidence Interval | Odds Ratios | Std. Error | 95% Confidence Interval | Odds Ratios | Std. Error | 95% Confidence Interval | |||||
| Race and Ethnicity (ref = White) | ||||||||||||||||
| Asian | 0.94*** | 0.01 | 0.92 | 0.95 | 0.95*** | 0.01 | 0.92 | 0.98 | 0.83*** | 0.01 | 0.81 | 0.85 | 1.15*** | 0.02 | 1.11 | 1.18 |
| Latino | 1.01 | 0.01 | 1.00 | 1.02 | 1.05*** | 0.01 | 1.02 | 1.07 | 1.13*** | 0.01 | 1.10 | 1.15 | 1.09*** | 0.01 | 1.07 | 1.12 |
| Black | 1.21*** | 0.01 | 1.19 | 1.22 | 1.23*** | 0.02 | 1.19 | 1.26 | 1.34*** | 0.02 | 1.30 | 1.38 | 1.33*** | 0.02 | 1.29 | 1.36 |
| Sex (ref= Male) | ||||||||||||||||
| Female | 0.94*** | 0.00 | 0.93 | 0.95 | 0.94*** | 0.01 | 0.93 | 0.96 | 0.99 | 0.01 | 0.98 | 1.01 | 0.95*** | 0.01 | 0.94 | 0.97 |
| Co-applicant (ref=Single) | ||||||||||||||||
| Co-applicant | 1.03*** | 0.00 | 1.02 | 1.04 | 1.05*** | 0.01 | 1.04 | 1.07 | 0.83*** | 0.01 | 0.82 | 0.84 | 1.00 | 0.01 | 0.98 | 1.01 |
| Age of Applicant in years (ref=< 25 years) | ||||||||||||||||
| 25 to 34 | 1.14*** | 0.04 | 1.07 | 1.22 | 0.93 | 0.05 | 0.84 | 1.02 | 1.03 | 0.07 | 0.88 | 1.17 | 0.79*** | 0.05 | 0.69 | 0.89 |
| 35 to 44 | 1.44*** | 0.05 | 1.35 | 1.53 | 1.31*** | 0.06 | 1.18 | 1.43 | 0.98 | 0.07 | 0.84 | 1.11 | 0.86* | 0.06 | 0.75 | 0.97 |
| 45 to 54 | 1.48*** | 0.05 | 1.39 | 1.58 | 1.47*** | 0.07 | 1.33 | 1.61 | 0.94 | 0.07 | 0.81 | 1.07 | 0.87* | 0.06 | 0.76 | 0.98 |
| 55 to 64 | 1.32*** | 0.04 | 1.24 | 1.41 | 1.35*** | 0.07 | 1.22 | 1.48 | 0.84* | 0.06 | 0.73 | 0.96 | 0.78*** | 0.05 | 0.68 | 0.88 |
| 65 to 74 | 1.19*** | 0.04 | 1.11 | 1.26 | 1.29*** | 0.06 | 1.17 | 1.42 | 0.82** | 0.06 | 0.70 | 0.93 | 0.66*** | 0.04 | 0.58 | 0.75 |
| >75 | 1.22*** | 0.04 | 1.14 | 1.30 | 1.52*** | 0.08 | 1.37 | 1.67 | 0.90 | 0.06 | 0.77 | 1.03 | 0.63*** | 0.04 | 0.54 | 0.71 |
| Debt-to-Income Ratio in percent (ref= <36 percent) | ||||||||||||||||
| 36 to 40 | 1.21*** | 0.01 | 1.20 | 1.23 | 1.23*** | 0.01 | 1.20 | 1.25 | 1.22*** | 0.01 | 1.19 | 1.24 | 1.19*** | 0.01 | 1.16 | 1.21 |
| 40 to 45 | 1.22*** | 0.01 | 1.21 | 1.23 | 1.26*** | 0.01 | 1.23 | 1.28 | 1.23*** | 0.01 | 1.21 | 1.25 | 1.21*** | 0.01 | 1.19 | 1.23 |
| >45 | 1.21*** | 0.01 | 1.20 | 1.22 | 1.25*** | 0.01 | 1.23 | 1.28 | 1.29*** | 0.01 | 1.26 | 1.31 | 1.42*** | 0.01 | 1.39 | 1.44 |
| Household Income (1,000 seconds) | 1.00*** | 0.00 | 1.00 | 1.00 | 1.00*** | 0.00 | 1.00 | 1.00 | 1.00*** | 0.00 | 1.00 | 1.00 | 1.00*** | 0.00 | 1.00 | 1.00 |
| Loan Amount (1,000 seconds) | 0.99*** | 0.00 | 0.99 | 0.99 | 0.99*** | 0.00 | 0.99 | 0.99 | 0.99 | 0.00 | 0.99 | 0.99 | 1.00*** | 0.00 | 1.00 | 1.00 |
| Loan to Home Value Ratio (percent) | 1.02*** | 0.00 | 1.02 | 1.02 | 1.02*** | 0.00 | 1.02 | 1.02 | 1.02*** | 0.00 | 1.02 | 1.02 | 1.03*** | 0.00 | 1.02 | 1.03 |
| Loan Terms (ref= 30-year Loan) | ||||||||||||||||
| 15-year Loan | 0.99 | 0.00 | 0.98 | 1.00 | 1.04*** | 0.01 | 1.03 | 1.06 | 1.00 | 0.01 | 0.99 | 1.02 | 1.03** | 0.01 | 1.01 | 1.05 |
| Interest Only Payment Loan | 1.00 | 0.01 | 0.98 | 1.01 | 1.23*** | 0.02 | 1.20 | 1.26 | 0.48*** | 0.00 | 0.47 | 0.49 | 2.15*** | 0.03 | 2.09 | 2.22 |
| Balloon Payment Loan | 0.75*** | 0.01 | 0.73 | 0.78 | 1.10*** | 0.03 | 1.04 | 1.16 | 0.41*** | 0.01 | 0.40 | 0.43 | 3.11*** | 0.16 | 2.79 | 3.42 |
| Percent of Whites in Neighborhood | 1.00*** | 0.00 | 1.00 | 1.00 | 1.00*** | 0.00 | 1.00 | 1.00 | 1.00*** | 0.00 | 1.00 | 1.00 | 1.00*** | 0.00 | 1.00 | 1.00 |
| Income Composition in Neighborhood (1,000 seconds) | 1.00*** | 0.00 | 1.00 | 1.00 | 1.00*** | 0.00 | 1.00 | 1.00 | 1.00*** | 0.00 | 1.00 | 1.00 | 1.00*** | 0.00 | 1.00 | 1.00 |
| Avg Age of Housing in Neighborhood (years) | 1.00*** | 0.00 | 1.00 | 1.00 | 1.00*** | 0.00 | 1.00 | 1.00 | 1.00*** | 0.00 | 1.00 | 1.00 | 1.00*** | 0.00 | 1.00 | 1.00 |
| Unemployment Rate (County) | 0.99* | 0.00 | 0.99 | 1.00 | 0.96*** | 0.01 | 0.95 | 0.97 | 1.07*** | 0.01 | 1.06 | 1.08 | 1.00 | 0.01 | 0.99 | 1.01 |
| Avg Housing Price Index (MSA) | 1.00 | 0.00 | 1.00 | 1.00 | 1.00*** | 0.00 | 1.00 | 1.00 | 1.00*** | 0.00 | 1.00 | 1.00 | 1.00* | 0.00 | 1.00 | 1.00 |
| Region (ref=Northeast) | ||||||||||||||||
| Midwest | 0.98*** | 0.01 | 0.96 | 0.99 | 0.98 | 0.01 | 0.96 | 1.00 | 1.13*** | 0.01 | 1.11 | 1.15 | 0.94*** | 0.01 | 0.92 | 0.97 |
| South | 1.43*** | 0.01 | 1.41 | 1.45 | 1.28*** | 0.02 | 1.25 | 1.31 | 1.68*** | 0.02 | 1.64 | 1.72 | 1.33*** | 0.02 | 1.30 | 1.37 |
| West | 1.50*** | 0.01 | 1.48 | 1.52 | 1.42*** | 0.02 | 1.37 | 1.46 | 1.35*** | 0.02 | 1.32 | 1.38 | 1.29*** | 0.02 | 1.26 | 1.33 |
| Year of Application (ref=2018) | ||||||||||||||||
| 2019 | 1.20*** | 0.00 | 1.19 | 1.21 | 1.02** | 0.01 | 1.00 | 1.04 | 1.79*** | 0.01 | 1.77 | 1.81 | 1.16*** | 0.01 | 1.15 | 1.18 |
| Constant | 0.05*** | 0.00 | 0.04 | 0.05 | 0.03*** | 0.00 | 0.02 | 0.03 | 0.27*** | 0.02 | 0.23 | 0.32 | 0.03*** | 0.00 | 0.03 | 0.04 |
Source. HMDA (2018–2019).
p < .05. **p < .01. ***p < .001.
Acknowledgements
I would like to thank Mariposa for all her support and evaluation of my ideas. Her passion and strategies inspire and amplify the voices of marginalized communities.