
Abstract
When speech increases in level from moderate to high, speech intelligibility (SI) can decrease. Termed rollover, this phenomenon is neglected during hearing aid (HA) fitting. A previous study introduced “sweet-spot compression” (SSC)—an amplification strategy for preventing rollover and improving listening outcomes at moderate to high levels. SSC aims to place speech in that area of an individual's performance-intensity function where both SI and listening comfort are high—the “sweet spot.” To achieve this, it combines high compression ratios with long time constants to provide quasi-linear amplification in the sweet-spot area. Using a HA simulator, headphone presentation, and 16 participants with rollover, SSC previously outperformed a clinical reference condition in terms of listening outcome. Here, we extended this work by (a) mapping out individual differences in the most comfortable speech level (MCL) and SI in noise at moderate to high levels, and (b) evaluating the listening outcome with SSC further. Using a wearable research HA, we tested 18 randomly chosen participants with mild to moderate hearing loss. Our analyses showed clear individual differences in MCL and SI with linear amplification. SSC gave better SI and was clearly preferred in quiet and in noise relative to a clinical reference condition. At the group level, rollover did not occur for either SSC or the reference condition. At the individual level, we found fewer cases of rollover with SSC than with the reference condition. Overall, we conclude that SSC shows promise with respect to improving listening outcomes at moderate to high levels.
Introduction
Approximately two-thirds of all adults aged 65 years and above are affected by sensorineural hearing impairment (World Health Organization, 2021). Sensorineural hearing impairment is commonly treated with hearing aids (HAs). HAs apply frequency- and level-dependent amplification to ensure good audibility and comfort (Dillon, 2012). In clinical practice, amplification is typically prescribed based on the pure-tone audiogram only, even though large individual differences in supra-threshold hearing abilities are common (Duquesnoy, 1983; Hopkins & Moore, 2007; Lopez-Poveda et al., 2017). Consequently, aided listening outcome may be suboptimal.
Rollover is a supra-threshold hearing phenomenon that entails a decrease in speech intelligibility (SI) as the speech level increases from moderate to high. Several studies have found rollover for listeners with normal and elevated hearing thresholds (Fereczkowski & Neher, 2023a; Fereczkowski et al., 2024; Jürgensen et al., 2025; Shanks et al., 2002; Shehorn et al., 2020; Summers & Cord, 2007). Individual listeners can show rollover that exceeds group averages considerably (Fereczkowski & Neher, 2023a, 2023b; Jürgensen et al., 2025). Currently, there are few research studies that have mapped out individual differences in SI at moderate to high levels. Such studies could pave the way for new amplification strategies that accommodate these differences to optimize aided listening outcomes.
To ensure good SI and listening comfort, HAs use amplitude compression, that is, they provide most gain at low input levels and least gain at high input levels (Dillon, 2012). This non-linear behavior is characterized by the compression kneepoint (CK), the compression ratio (CR), the attack time (AT), and the release time (RT) of the compressor. HA developers set these parameters based on their chosen “philosophy” (e.g., a focus on SI or listening comfort) and the results from empirical evaluations. CKs are often set below 50 dB SPL, while CRs typically range from 1.5:1 to 4:1 (Dillon, 2012). While higher CRs can be used to compensate for decreased residual dynamic ranges (Keidser et al., 2007), they can also cause more distortion of the input signal. The severity of such distortions depends on the applied AT and RT, which can range from a few milliseconds to more than a second (Dillon, 2012). As short and long ATs and RTs both come with advantages and disadvantages [for a review, see Moore (2008)], there is no “right” choice for setting them in HAs.
While the benefits of amplitude compression for listening outcomes are overall well documented (e.g., Laurence et al., 1983; Moore et al., 1992), a number of studies have produced results showing that the situation is not clear-cut when background noise is present and when sound levels are high. Humes et al. (1999) compared non-linear with linear amplification in several test conditions, including measurement of SI in quiet at 50- and 60-dB-SPL speech levels, SI in noise at 60- and 75-dB-SPL speech levels (signal-to-noise ratios, SNR, of 5 and 10 dB), and subjective measures related to perceived HA benefit, ease of listening, and sound quality. They found that non-linear amplification gave greater SI improvement than unaided listening at soft (50 dB SPL in quiet) and moderate (60 dB SPL in quiet and in noise) speech levels. For 75-dB-SPL speech in noise, however, non-linear amplification provided no benefits in SI or subjective ratings over linear amplification. Shanks et al. (2002) assessed SI in noise at 52-, 62-, and 74-dB-SPL speech levels for unaided and three aided conditions: (a) linear amplification combined with a hard limiter (peak clipping), (b) linear amplification combined with a compression limiter (CR of 8:1), and (c) wide-dynamic range compression (kneepoint of 52 dB SPL and CR of up to 2.7:1). Compared to unaided listening, all aided conditions improved SI at all presentation levels. However, SI also decreased significantly with increasing presentation level for all aided conditions; that is, none of the three aided conditions was able to maintain SI at higher levels and, thus, to prevent rollover. Another evaluation of the same dataset indicated that at the highest presentation level (74 dB SPL), participants preferred unaided listening over the three amplification strategies (Larson et al., 2000). Collectively, these findings indicate a clear risk for suboptimal aided outcomes for speech in background noise at moderate to high presentation levels.
In a recent study, Fereczkowski et al. (2024) introduced an amplification strategy for preventing rollover and improving listening outcomes at moderate to high levels. Termed sweet-spot compression (SSC), this strategy aims to place speech in the “sweet-spot area” of an individual's performance-intensity function while at the same minimizing signal distortions. This is achieved by anchoring the gain prescription around the individual's most comfortable speech level (MCL) and combining a high CR (5:1) with a long AT and a long RT (800 ms in both cases). Unlike a reference setting based on the “National Acoustic Laboratories – Non-Linear 1” (NAL-NL1) fitting procedure (Byrne et al., 2001), SSC prevented rollover and gave better SI in quiet at high presentation levels. Furthermore, there was a trend for SSC to give better SI in noise, and SSC was clearly preferred over NAL-NL1 for speech in noise at high levels. However, at low levels in quiet, participants preferred the reference setting.
In the aforementioned study, all testing was conducted using headphones and preprocessed stimuli. As such, the setup could only simulate some aspects of listening with HAs. Additionally, a carefully selected group of participants was tested, that is, 16 individuals who had shown rollover previously. The purpose of the current study was to extend this work in several ways. Its aims were: (a) to map out individual differences in speech perception at moderate to high levels for listeners with sensorineural hearing loss (Part A), and (b) to evaluate listening outcome with SSC further (Part B). In Part A, we measured the individual aided MCL and collected SI scores at moderate to high levels in the presence of background noise. Our participants were 18 randomly selected individuals with mild to moderate sensorineural hearing loss who were tested with individual linear amplification. We hypothesized that there would be clear individual differences and that the MCL would be correlated with the level at which maximum SI was achieved. In Part B, we evaluated a realistic implementation of SSC with the same group of participants. More precisely, we implemented SSC on a wearable research HA and optimized the gain prescription at low input levels. We then compared SSC to an NAL-NL1-based reference condition. We assessed SI in noise at moderate and high levels, and we also collected pairwise preference judgments at low, moderate, and high levels in quiet and in noise. We hypothesized that SSC would outperform the reference condition in terms of SI and preference at moderate to high levels, and that it would give comparable results to the reference condition at lower levels.
Methods
Participants
Eighteen native Danish speakers (five females) with an average age of 69.9 years (standard deviation, SD = 5.4 years) and symmetrical, mild-to-moderate sensorineural hearing loss took part. Twelve of them were experienced HA users. For personal reasons, one participant dropped out after Part A (see Procedure). Pure-tone audiometry was conducted with an Interacoustics Affinity Compact system and RadioEar 3045 headphones at the standard audiometric frequencies (0.125, 0.25, 0.5, 1, 2, 4, and 8 kHz). The pure-tone average hearing loss calculated across 0.5, 1, 2, and 4 kHz (PTA4) of these participants ranged from 26.3 to 47.5 dB HL, with an average of 33.6 dB HL (SD = 6.2 dB HL). The average and individual audiometric thresholds for the participants’ ears with the smaller PTA4 (i.e., the test ears; see below) are shown in Figure 1.
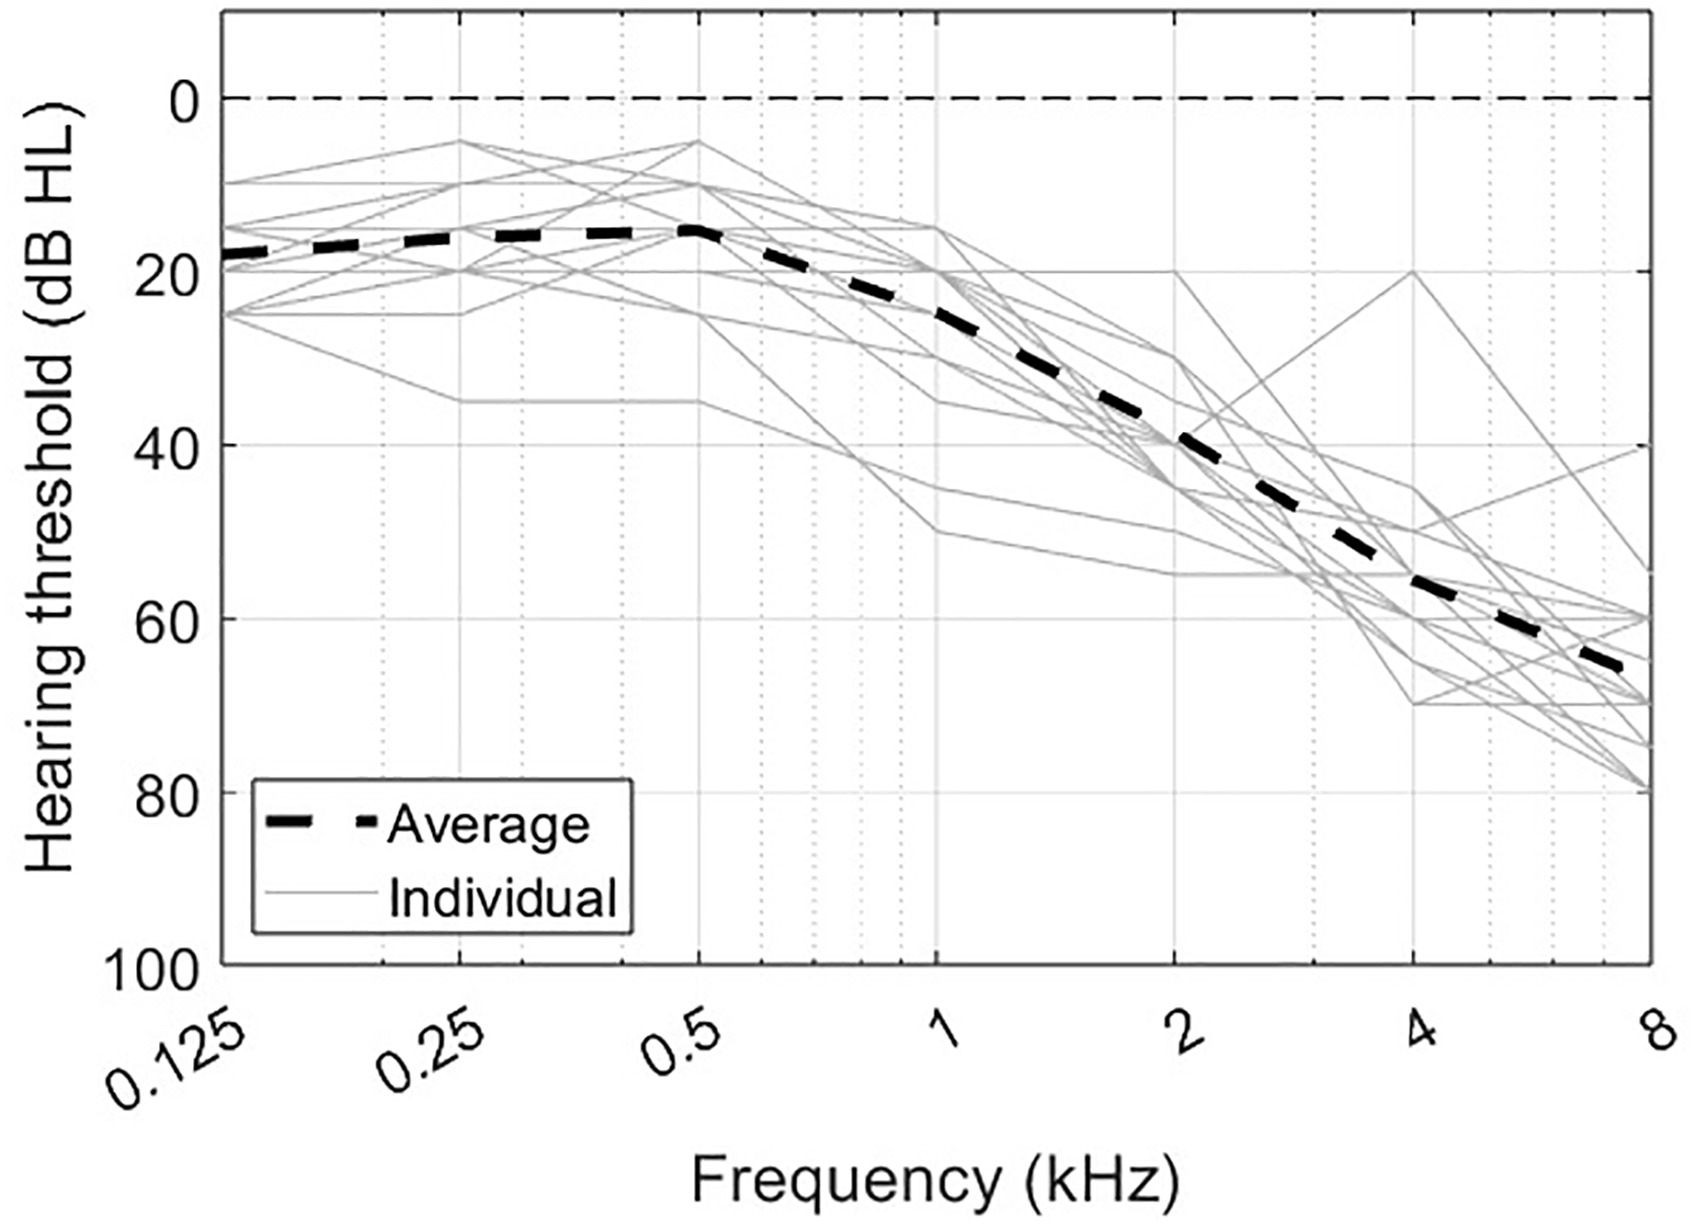
Individual (gray lines) and average (black line) audiometric thresholds of the participants’ test ears.
Hearing Aid Fittings
The participants were fitted with a wearable research HA consisting of the “Portable Hearing Laboratory” (PHL) (Pavlovic et al., 2019) and the “open Master Hearing Aid” (openMHA) (Grimm et al., 2006; Herzke et al., 2017). With regard to SI and perceived speech quality in quiet and in noise, this research HA was previously found to be comparable to a state-of-the-art commercial HA (Andersen et al., 2025). The PHL is a portable miniature computer that offers real-time audio signal processing and can be used with realistic behind-the-ear HA shells. The openMHA is an open-source software platform that can be used to simulate an entire HA signal processing chain. In the current study, an openMHA configuration with 10 channels for frequency-dependent gain prescription and feedback reduction was used. In each channel, gain was calculated for input levels from 0 to 110 dB SPL in 10-dB steps. Gain adjustments were performed with a custom-made user interface implemented in Matlab v2021b. As part of the fitting process, the best-suited options among two receiver lengths and four sizes of closed double-domes were selected for each test ear to ensure good coupling of the behind-the-ear HA shell to the ear canal.
The research HA was programmed with a hard limiter at 110-dB-SPL output level for safety reasons, and linear amplification below 50-dB-SPL input level to reduce the risk of acoustic feedback. For input levels from 50 to 110 dB SPL, three amplification strategies were implemented:
NAL-RP: Linear amplification according to the “National Acoustic Laboratories – Revised, Profound” fitting rule (Byrne, 1991) serving as baseline condition without compression; NAL-NL1: Non-linear amplification according to the NAL-NL1 fitting rule with a short AT (10 ms) and a long RT (800 ms) serving as a clinical reference condition with compression, in accordance with a previous evaluation of SSC (Fereczkowski et al., 2024); SSC: Non-linear amplification according to Fereczkowski et al. (2024) with the gain prescription anchored around the individual aided MCL coupled with a 5:1 CR from 500 to 4,000 Hz and long AT and RT (800 ms in both cases). In this manner, speech was placed in the sweet-spot area around the individual MCL on the output side and amplified in a quasi-linear manner.
All HA fittings were verified with real-ear measurements using an Interacoustics Affinity Compact system. The aim was to meet the target gains for the three amplification strategies with a precision of ±5 dB from 500 to 6,000 Hz. To that end, the International Speech Test Signal (ISTS) (Holube et al., 2010) was presented at input levels of 55, 65, and 80 dB SPL from a loudspeaker at 0° azimuth. Figure 2 shows frequency- and level-dependent gains averaged across test ears for the three amplification strategies. At low input levels (left panel), SSC and NAL-NL1 prescribed comparable gain at most frequencies with a maximum deviation of 5 dB at 500 and 4,000 Hz, while NAL-RP prescribed less gain than NAL-NL1 and SSC. At moderate input levels (middle panel), the three amplification strategies prescribed comparable gain at frequencies below 500 Hz. At frequencies between 500 and 6,000 Hz, SSC prescribed less gain than NAL-NL1 and more gain than NAL-RP. At high input levels (right panel), SSC prescribed markedly less gain than NAL-RP and NAL-NL1 across all frequencies. Below 1,000 Hz, the measured SSC insertion gains consistently exceeded the prescribed target gains and thus the target accuracy of ±5 dB. This can be attributed to the use of (non-customized) domes and, therefore, insufficient ear-canal occlusion at low frequencies. Consequently, negative target gains prescribed by SSC below 1.5 kHz could not always be realized. The effective gain differences between SSC and the other two amplification strategies were therefore less pronounced than prescribed.

Real-ear insertion gain curves (solid lines) for the three amplification strategies (SSC, NAL-NL1, NAL-RP) together with the respective target gain curves (dashed lines) averaged across all test ears for input levels of 55 dB SPL (left panel), 65 dB SPL (middle panel), and 80 dB SPL (right panel).
Test Setup
All measurements were performed in the audiological laboratory at the University of Southern Denmark. The participants were seated in a chair at a 1.4-m distance from a frontal loudspeaker (Genelec 8030C), which was used for stimulus presentation. The loudspeaker was connected to an RME Fireface UC soundcard, which was connected to a Windows computer. Custom-made MATLAB scripts were used for running the measurements. All measurements were performed monaurally with the research HA (see Hearing aid fittings) fitted to the test ear. The other (non-test) ear was occluded with an insert foam plug and a closed circumaural headphone.
Procedure
The measurements were distributed across two 2-hr visits. The first visit focused on mapping out individual differences in SI at moderate to high levels (Part A). It included pure-tone audiometry, fitting the research HA with NAL-RP amplification, determining the individual test SNR, assessing SI with NAL-RP amplification, and measuring the MCL. The second visit focused on the comparison of the two non-linear amplification strategies (Part B). It included fitting the research HA with NAL-NL1 and SSC amplification, and assessing SI and perceived speech quality with these two amplification strategies. Below, the different measurements are described in detail.
Speech Intelligibility in Noise (Parts A and B)
SI in noise was assessed monaurally. For each participant, the ear with the smaller PTA4 was tested. The Danish “Dagmar, Asta, and Tine” (DAT) corpus (Nielsen et al., 2014) was used for these measurements. Each DAT test list contains 20 sentences, with each sentence consisting of a fixed carrier phrase and two unique, unrelated keywords (e.g., “Dagmar tænkte på en
For the measurements, the speech-in-noise stimuli were presented at individual test SNRs. To determine these test SNRs, an adaptive procedure with a fixed speech level of 65 dB SPL and a varying noise level was used. After administering one training list, the speech recognition threshold corresponding to 50%-correct performance (SRT50) was measured twice with two different test lists. The test SNR was then calculated by adding 1 dB to the average of the two SRT50 measurements. This SNR was used for all subsequent SI measurements. In Part A, the SI measurements were performed at 65-, 70-, 75-, and 80-dB-SPL speech levels with NAL-RP amplification. In Part B, SI was assessed at 65- and 80-dB-SPL speech levels with NAL-NL1 and SSC amplification. In all cases, %-correct scores were measured with two separate test lists for each speech level. The two scores were averaged to obtain the final SI score for each condition and participant. In both parts, the order of the different conditions and test lists was balanced across the participants.
Most Comfortable Speech Level (MCL; Parts A and B)
For each participant, the MCL was measured monaurally for the test ear in quiet with NAL-RP amplification. The stimulus was running speech from the Dantale-I corpus (Elberling et al., 1989). The procedure of Fereczkowski and Neher (2023a) was used with a free-field (instead of headphone) presentation. Three separate MCL measurements were performed for each participant. The final MCL was calculated by taking the average of these three measurements.
Perceived Speech Quality in Quiet and in Noise (Part B)
Preference in terms of perceived speech quality was assessed with NAL-NL1 and SSC amplification in four test conditions: (a) 55-dB-SPL speech in quiet, (b) 65-dB-SPL speech in quiet, (c) 65-dB-SPL speech in 60-dB-SPL noise, and (d) 80-dB-SPL speech in 75-dB-SPL noise. The noise was the ISTS. For each condition, preference was assessed five times with a 2-alternative forced-choice paradigm. To this end, the participants were provided with a tablet (iPad A1893) running a custom-made MATLAB user interface with two buttons. On each trial, the HA amplification was set to either NAL-NL1 or SSC, and a speech-in-noise stimulus was presented via the loudspeaker. The allocation of the amplification strategies to the two buttons was randomized prior to each of the five runs per condition. To allow the research HA to apply appropriate amplification for each strategy, the stimulus started with a 2-s long speech-shaped noise segment at the desired speech level. During this “preconditioning” phase, the HA output was muted and then unmuted when the speech-in-noise stimulus started. The speech signal was a randomly chosen, 4-s long sequence from a story spoken by a female speaker taken from the Archimedes project (Hansen & Munch, 1991). The chosen sequence was the same for the two amplification strategies within a trial but changed across trials. Depending on the test condition, the speech signal was mixed with a randomly selected segment of the ISTS signal at 5 dB SNR. On each trial, the participants were asked to listen to the stimulus at least twice with both amplification strategies before choosing the one providing better perceived speech quality.
Statistical Analyses
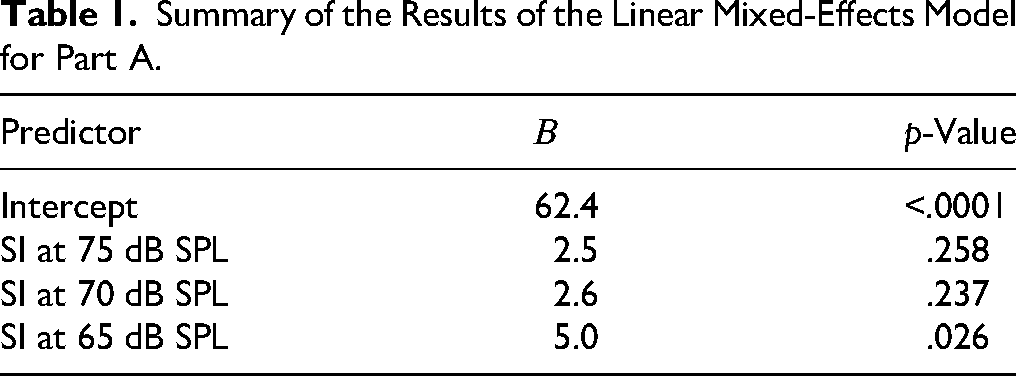
All statistical analyses were performed in MATLAB (version 2024b) with a significance level of 5%. To check for changes in SI across 65-, 70-, 75-, and 80-dB-SPL presentation levels with NAL-RP amplification (Part A), a linear mixed-effects model with SI as the dependent variable, presentation level as a fixed effect, and participants as a random effect was used. The reference condition was set to 80-dB-SPL presentation level.
For Part B, a linear mixed-effects model with SI as the dependent variable, presentation level (65 and 80 dB SPL) and amplification strategy (SSC, NAL-NL1, and NAL-RP) as fixed effects, and participant as a random effect was used. The interaction between presentation level and amplification strategy was also included to check for differences in SI progression with the different amplification strategies. As a reference condition, SSC and 80-dB-SPL presentation level were used.
The preference judgments for SSC and NAL-NL1 amplification were analyzed with separate conditional logistic regression models for the four test conditions (55-dB-SPL speech in quiet, 65-dB-SPL speech in quiet, 65-dB-SPL speech in 60-dB-SPL noise, and 80-dB-SPL speech in 75-dB-SPL noise).
Results
Part A: Individual Differences in Speech Perception at Moderate to High Levels
The left panel of Figure 3 shows the SI scores measured at the four presentation levels with NAL-RP amplification. On average, SI was best at 65 dB SPL (67.4%-correct). With increasing level, SI decreased to 65.0%-correct at 70 and 75 dB SPL, and further to 62.4%-correct at 80 dB SPL. Figure 3 also shows the presentation level at which each participant achieved maximum SI (filled and unfilled green symbols). For nine participants, this was the case at 65 dB SPL. The other participants achieved maximum SI at 75 dB SPL (five participants) or 80 dB SPL (four participants). The statistical analysis revealed a 5.0% difference between SI at 65 and 80 dB SPL (p = .026) consistent with group-level rollover, but no differences between 80 dB SPL and 70 or 75 dB SPL (both p > .05). Notably, one participant (filled green circles in Figure 3) showed atypical behavior with an SI improvement of 29% when the presentation level was increased from 65 to 80 dB SPL. Inspection of the REM data for that participant revealed no issues with the HA fitting. Excluding that participant from the analysis changed the results marginally by increasing the group-level rollover to 7.0% (p < .01). When comparing the individual maximum SI score with the SI score measured at 80 dB SPL, group-level rollover increased further to 9.5% (p < .0001). A summary of the statistical results is provided in Table 1.
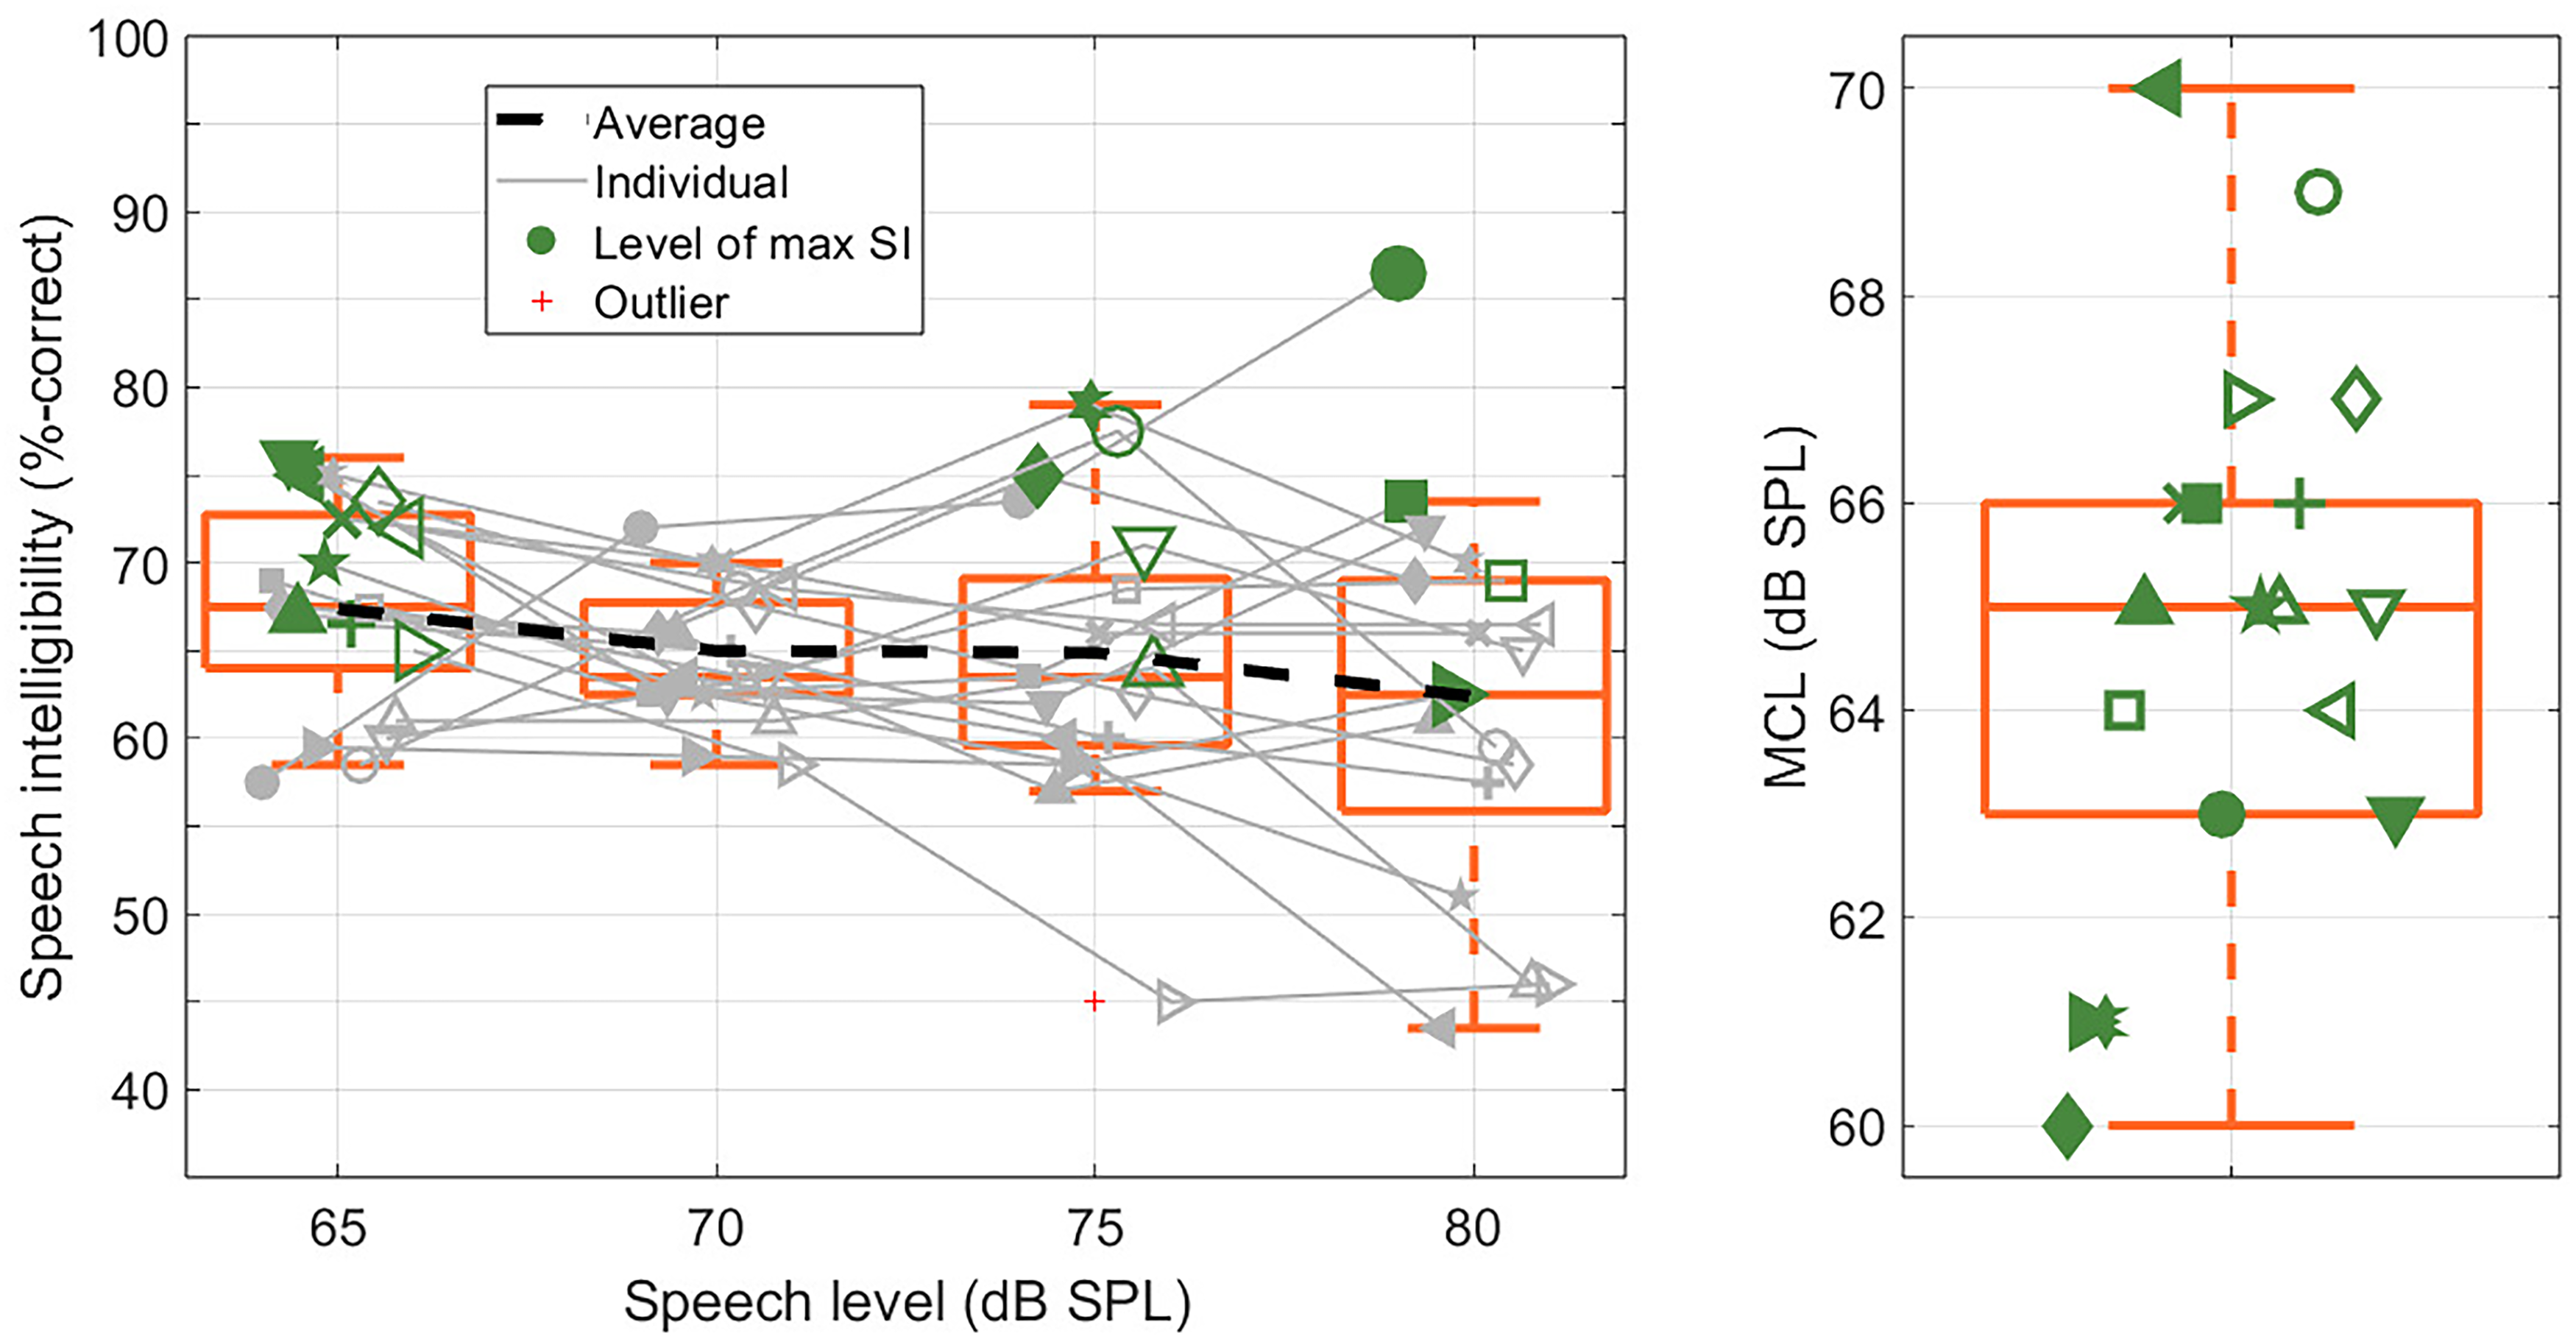
Left panel: SI scores measured with individual NAL-RP amplification at speech levels of 65, 70, 75, and 80 dB SPL. The dashed black line shows average scores. The solid gray lines show individual scores. Right panel: MCLs measured with individual NAL-RP amplification. Orange boxes show 25th and 75th quantiles, and orange horizontal lines show median values. Green symbols (filled and unfilled) show individual results. In the left panel, the green symbols indicate the levels at which the participants achieved maximum SI.
Summary of the Results of the Linear Mixed-Effects Model for Part A.
The right panel of Figure 3 shows a boxplot of the MCL data. All MCL values fell within the range 60–70 dB-SPL, with a mean value of 64.8 dB SPL and an SD of 2.6 dB SPL. A Spearman's rank correlation analysis revealed no relation between the MCL and the level at which maximum SI was achieved (p = .45).
Figure 4 shows the individual maximum SI scores plotted against the SI scores obtained at 80 dB SPL (left panel) and the SI scores obtained at 65 dB SPL plotted against the SI scores obtained at 80 dB SPL (right panel). In both panels, most datapoints fall below the diagonal, that is, SI was better at the lower presentation level than at 80 dB SPL. Also, several datapoints fall outside the 95% confidence interval, corresponding to significant rollover at the individual level. This number is higher in the left panel (six participants) than in the right panel (four participants). Notably, in the right panel, one participant showed significantly better SI at 80 dB SPL than at 65 dB SPL, indicating insufficient audibility with NAL-RP amplification at the lower level.

Left panel: individual maximum SI (measured at one of the four presented speech levels) plotted against SI measured at 80 dB SPL for each participant. Right panel: SI measured at 65 dB SPL plotted against SI measured at 80 dB SPL for each participant. The black dashed lines show the identity lines. The gray dashed lines show 95% confidence intervals.
Part B: Listening Outcomes With SSC Versus NAL-NL1
The top panel in Figure 5 shows the SI scores measured with NAL-RP (left, replotted from Figure 4), NAL-NL1 (middle), and SSC (right) at 65- and 80-dB-SPL speech level. As reported above, with NAL-RP amplification, there was a group-level rollover of 5.0%. With NAL-NL1 and SSC amplification, the rollover values were 3.8% (66.9%-correct vs. 63.1%-correct) and 2.4% (73.6%-correct vs. 71.2%-correct), but in neither case was the difference in mean scores across the two speech levels statistically significant (Table 2). At 80-dB-SPL speech level, the analysis revealed significantly better SI with SSC than with NAL-NL1 (Δ-value: 8.1%,

Top panel: boxplots of SI scores measured with NAL-RP (green), NAL-NL1 (blue), and SSC (red). Boxes show 25th and 75th quantiles. Horizontal lines show median values. Thick dashed black lines show mean results. Thin gray solid lines show individual results. Bottom panels: Individual SI scores measured at 65- and 80-dB-SPL speech level plotted against each other. Left: Results for NAL-RP (green). Middle: Results for NAL-NL1 (blue). Right: Results for SSC (red). Filled symbols mark participants with significant rollover with NAL-RP (see Part A). Black dashed lines show the identity lines. Gray dashed lines show 95% confidence intervals.
Summary of the Results From the Linear Mixed-Effects Model From Part B.

The panels at the bottom of Figure 5 show scatterplots of the individual SI scores measured at the two speech levels for NAL-RP (left), NAL-NL1 (middle), and SSC (right). With NAL-RP amplification, there were four participants who showed significant rollover (see Part A). NAL-NL1 amplification prevented rollover for two of these participants but led to rollover for two other participants. SSC prevented rollover for three of the four participants who showed rollover with NAL-RP but led to rollover for one additional participant.
Better SI with SSC than with NAL-NL1 (top panels) and NAL-RP (bottom panels) can also be seen in Figure 6, where individual scores for the amplification strategies are plotted against each other for the 65-dB-SPL speech level (left panels) and the 80-dB-SPL speech level (right panels). At both levels, most datapoints (14 out of 17 at 65 dB SPL and 15 out of 17 at 80 dB SPL for the comparison to NAL-NL1; 11 out of 17 at 65 dB SPL and 15 out of 17 at 80 dB SPL for the comparison to NAL-RP) lie above the diagonal, corresponding to better SI with SSC. For some participants (four at 65 dB SPL and two at 80 dB SPL for the comparison to NAL-NL1; three at 65 dB SPL and four at 80 dB SPL for the comparison to NAL-NL1), the improvement was significant at the individual level, as their datapoints lie above the 95% confidence interval.
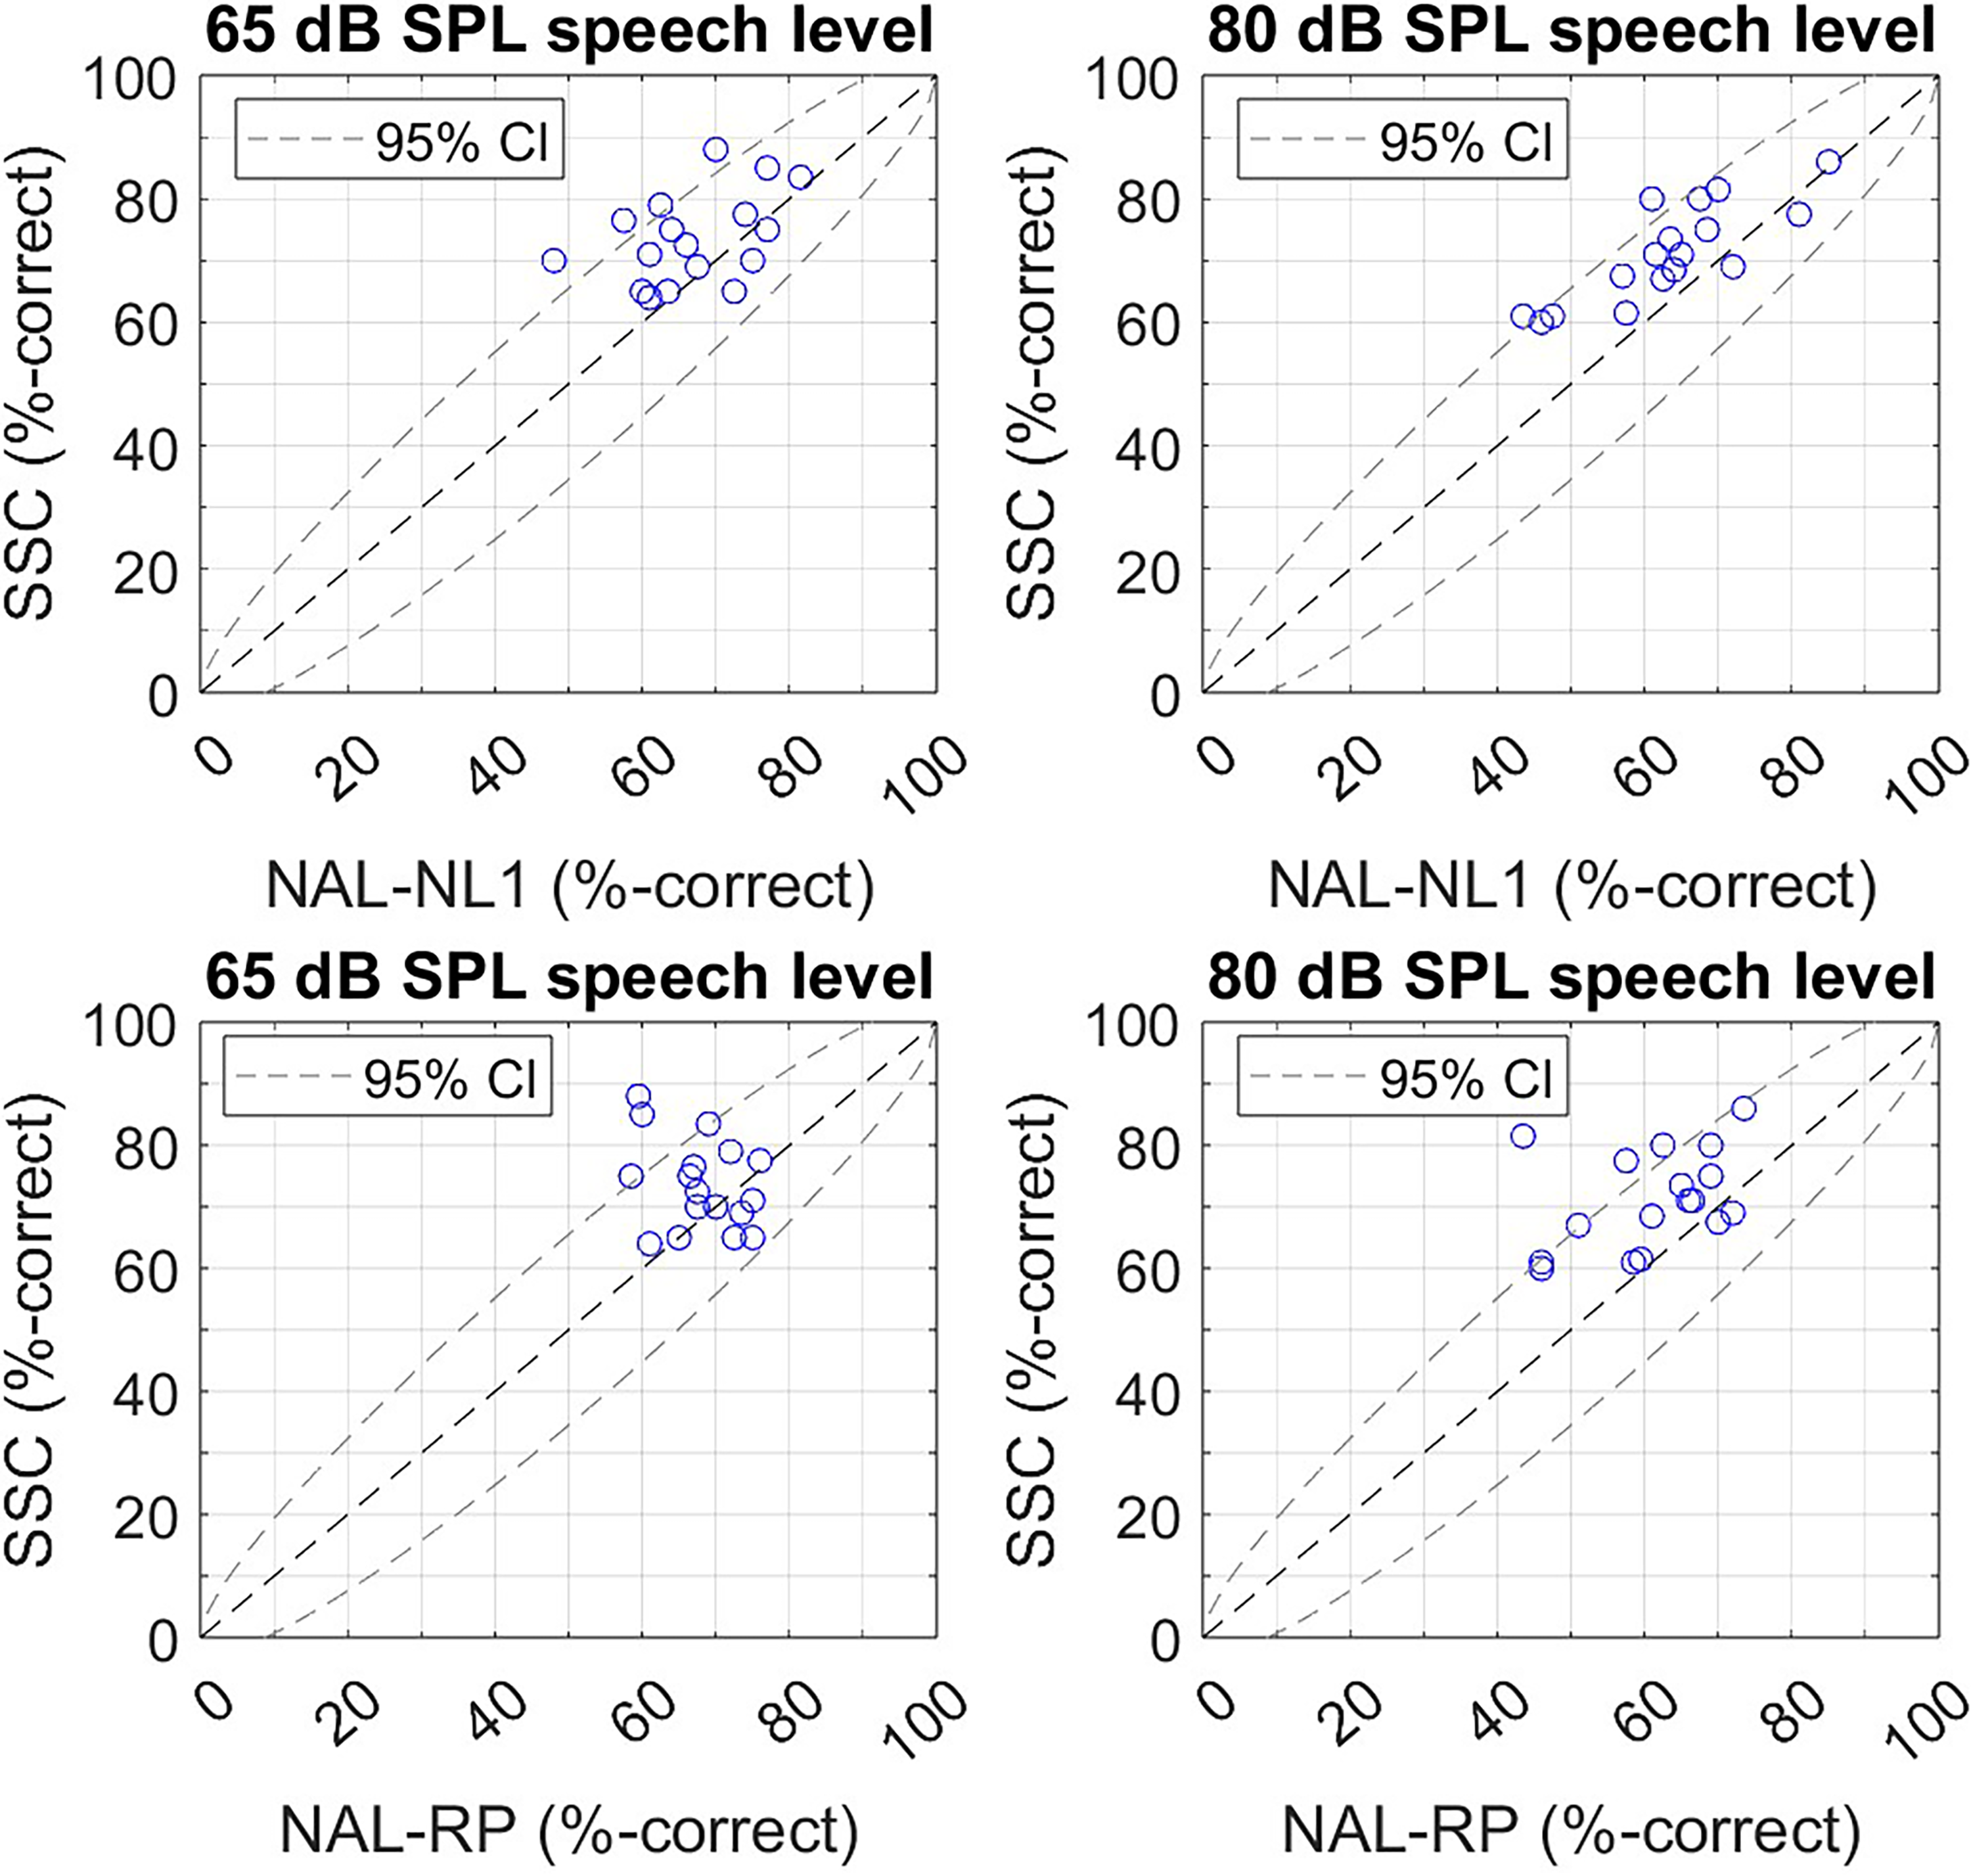
Top panels: SI scores measured with SSC plotted against SI scores measured with NAL-NL1. Bottom panels: SI scores measured with SSC plotted against SI scores measured with NAL-RP. Left: Results at 65-dB-SPL speech level. Right: Results at 80-dB-SPL speech level. Black dashed lines show the identity line. Gray dashed lines show 95% confidence intervals.
Figure 7 shows the results from the pairwise preference judgments for each of the 17 participants for each of the four test conditions (speech in quiet or in babble noise at different levels). Blue bars represent votes in favor of NAL-NL1, whereas red bars represent votes in favor of SSC. Overall, most participants (10 out of 17) preferred SSC over NAL-NL1 across all test conditions. Only one participant preferred NAL-NL1 in all test conditions. For six participants, preference varied between SSC and NAL-NL1 depending on the test condition. The conditional logistic regression models revealed a significant preference for SSC for 55-dB-SPL speech in quiet (

Preference counts in terms of perceived speech quality for NAL-NL1 (blue) and SSC (red) as evaluated in four test conditions (soft speech in quiet: 55/0; moderate speech in quiet: 65/0; moderate speech in babble noise at 5 dB SNR: 65/60; loud speech in babble noise at 5 dB SNR: 80/75). Each panel shows the data for one participant.
Discussion
Part A: Individual Differences in Speech Perception at Moderate to High Levels
In the current study, we found clear individual differences in SI at moderate to high levels, despite testing participants with similar audiograms and ear-specific linear amplification to provide audibility. Broadly speaking, these results support the need for more individualized fitting approaches for HAs. With SSC, we present one such approach that relies on the individual MCL to anchor the gain prescription, assuming this to be a good estimate of the lower bound of the level range where both SI and listening comfort are high.
We did not find a correlation between the individual MCL and the level at which our participants achieved maximum SI. However, closer inspection of Figure 3 reveals that for 13 of the 18 participants, the MCL was equal to or below the level at which the maximum SI was achieved. For the other five participants, the MCL exceeded the maximum performance level by no more than 5 dB: +1 dB for two participants (“+” and “×” in Figure 3), +2 dB for two participants (“◊” and “>”), and +5 dB for one participant (“◄”). This lends some support to the idea that the MCL is a reasonable estimate of the lower bound of the sweet-spot area, which is in line with a study of Neuman et al. (1995), who investigated preferred listening levels for hearing-impaired participants provided with slow-acting compression HAs and concluded that gains should be placed within 5 dB of the MCL (defined as the midpoint of the most comfortable level range). The lack of a correlation between the MCL and the level at which maximum SI occurred might reflect the fact that the SI measurements were performed in noise, whereas the MCL measurements were performed in quiet. A previous study (Richards, 1975) investigated the influence of background noise on speech MCL and found that it increased with higher noise levels.
Other research supports the general approach of prescribing HA gain based on measures of the individual sweet-spot area, such as the individual MCL. “Adaptive Dynamic Range Optimization” (ADRO) (Blamey, 2005) is an amplification strategy that shares some central aspects with SSC. In clinical practice, ADRO is used for users of bimodal fittings, but it has also been found to improve SI and perceived sound quality compared to conventional amplification strategies for HA users. Like SSC, ADRO aims to place speech information where audibility and listening comfort are high while preserving natural level fluctuations in the input signal to avoid signal distortions. Although their goals are similar, SSC and ADRO differ substantially in their realizations. ADRO avoids static compression input-output functions and instead adjusts gains adaptively according to a set of rules to fit between frequency-dependent audibility and comfort targets, applying linear amplification whenever possible. In contrast, SSC achieves quasi-linear processing within the sweet-spot area by combining (static) high CRs and long time constants. Additionally, the comfort targets in ADRO are measured with narrowband noise and resemble the upper limit of the sweet-spot area, whereas SSC utilizes the most comfortable level for broadband speech as its lower boundary.
Part B: Listening Outcomes With SSC Versus NAL-NL1
Better SI in Noise With SSC
Overall, SSC led to better SI than NAL-NL1 (mean improvements of 6.6% and 8.1% at 65 and 80 dB SPL, respectively; both p < .001). Better SI in noise at 65 and 80 dB SPL with SSC extends previous findings of better SI in quiet at high presentation levels (90 dB SPL) for participants with rollover (Fereczkowski et al., 2024) to a broader group of hearing-impaired listeners and to more ecologically valid conditions (i.e., lower levels and the presence of background noise). The observation of better SI with SSC at moderate levels deviates partially from previous work (Fereczkowski et al., 2024), where better SI in noise was observed with SSC measured in terms of SRT50s at 70-dB-SPL speech level, but not when%-correct scores were measured in quiet at 65 dB SPL. Collectively, these results indicate more benefit from SSC at moderate levels in the presence of background noise than in quiet conditions.
Unlike at the 80-dB-SPL speech level, where the benefit provided by SSC was most likely driven by markedly reduced gain, it is less obvious what led to the observable benefit at the 65-dB-SPL speech level. Differences in prescribed gain and AT between SSC and NAL-NL1 could both play a role, whereas insufficient audibility provided by NAL-NL1 is most likely not the reason for the poorer SI relative to SSC. On average, NAL-NL1 prescribed ∼4 dB more gain at 65 dB SPL over the range 500–4,000 Hz. In a previous study (Fereczkowski et al., 2024), there was a relation between the difference in prescribed gain and SI. That is, the less gain SSC prescribed relative to NAL-NL1, the larger the benefit in SI was with SSC relative to NAL-NL1. In the current study, we did not see such a relation. This suggests that the difference in AT (10 ms for NAL-NL1 vs. 800 ms for SSC) was responsible for the differences in SI. Another study found long time constants to result in better SI in noise than short time constants (Shetty & Raju, 2019). This is in line with more pronounced speech envelope distortions due to short compression time constants leading to reduced phoneme recognition (Jenstad & Souza, 2005). In these other studies, however, the RT was varied while the AT was kept short (unlike in our study). A previous study (Fereczkowski et al., 2024) included a comparison of SSC with long and short ATs but otherwise identical gain prescriptions. The results showed a trend toward better SI at moderate levels in noise (but not in quiet) for SSC with the long AT. These results are in line with research related to the dual front-end automatic gain control (Moore & Glasberg, 1988), a compression system consisting of two components: a slow-acting component to determine the overall gain during “normal” operation and a fast-acting component to reduce the gain in case of intense transient sounds. A comparison (Moore et al., 1991) of different ATs for the slow-acting component and RTs for the fast-acting component revealed similar SI in quiet. In background noise, however, SI was highest for the conditions with long ATs and RTs. The authors therefore concluded that a rather long AT of 150–325 ms seems to be the optimum choice for the slow-acting component of their dual front-end. Collectively, these findings indicate that the long AT played an important role in the SI improvements that SSC provided.
Even though SSC provided better SI in noise than NAL-NL1 at 65 and 80 dB SPL, there was no group-level rollover with either amplification strategy. This deviates from previous work, where SSC prevented rollover while NAL-NL1 did not (Fereczkowski et al., 2024). Differences between the participant groups can likely explain this discrepancy. In the previous study, participants with clear rollover were tested, whereas in the current study, we tested a random sample of hearing-impaired individuals. As a result, we observed less group-level rollover (5% in the current study vs. 28% in the previous study) and fewer individual cases of rollover (4 out of 18 participants in the current study vs. 16 out of 16 participants in the previous study) with linear amplification.
Another factor that contributed to the much smaller group-level rollover found here, as compared to before, is the choice of presentation levels. In the previous study, the measurements were conducted at 65 and 90 dB SPL, whereas in the current study, we used 65 and 80 dB SPL for reasons of ecological validity. Additionally, differences in hearing loss profiles could have contributed. The participants tested here had hearing losses of mild to moderate severity (mean PTA4: 33.6 dB HL), whereas the ones included in the previous study had more severe hearing losses (mean PTA4: 54.1 dB HL). Greater hearing loss severity is often accompanied by a narrower residual auditory dynamic range (Kamm et al., 1978). While the causes of rollover are not fully understood, listening discomfort could be a contributing factor. Listening discomfort can be avoided by fitting the input level range into the residual auditory dynamic range to avoid exceeding uncomfortable loudness levels. For the mild to moderate hearing losses tested here, the lower CRs prescribed by NAL-NL1 may have been sufficient to compensate for the participants’ residual auditory dynamic ranges. In our previous study, this might not have been the case for the participants with the larger hearing losses, for whom higher CRs (as prescribed by SSC) were better suited.
Overall, our findings indicate that SSC is particularly suited for individuals with clear rollover and/or low uncomfortable loudness levels, but that it can also provide good listening outcomes for individuals with more typical audiological profiles.
Better Perceived Speech Quality With SSC
We found a clear preference for SSC over NAL-NL1 for several test conditions, including soft and moderate speech in quiet and moderate and loud speech in background noise (at 5 dB SNR). Previous work (Fereczkowski et al., 2024) also found a preference for SSC at high presentation levels, whereas NAL-NL1 was preferred at low presentation levels. The greater consistency of the results in favor of SSC observed here could be due to the altered gain prescription at low levels (see Hearing aid fittings), differences in the test setup, and the participants’ hearing losses. Compared to the previous study, where a CR of 5:1 was applied over the whole input level range, we modified the SSC gain prescription here by applying linear amplification for input levels below 50 dB SPL (the compression kneepoint). Effectively, this led to rather similar gain prescriptions at low input levels for SSC and NAL-NL1 (Figure 2, left panel), with an average gain difference across the PTA4 frequencies of only 1.5 dB (more gain for SSC).
Given the similarities in terms of gain and frequency shape for SSC and NAL-NL1, the participants appeared to prefer the long AT used for SSC over the short AT used for NAL-NL1. This would seem to be at odds with the results of a study by Hansen (2002), where varying the AT between 1 ms and 100 ms in combination with a very long RT (4,000 ms) did not evoke different preferences in terms of speech quality or SI. The markedly different time constants used in our study (AT: 10 ms or 800 ms; RT: 800 ms) limit the comparability of these findings, however.
In terms of test setup, we used free-field presentation and a wearable research HA with real-time processing in the current study instead of presenting preprocessed stimuli via headphones (Fereczkowski et al., 2024). Transitioning to this more realistic setup involved two issues related to coupling the HA to the ear canal: (a) A higher risk of acoustic feedback due to high gain at low input levels, which was minimized by applying linear gain for input levels below 50 dB SPL, and (b) less gain (compared to the previous study) prescribed at the individual MCL, which served as the anchor point of SSC, due to testing participants with milder hearing losses in the current study. The use of a high CR and, thus, even lower gain at higher input levels frequently led to negative gain prescriptions. As mentioned above, negative gain could not always be realized due to insufficient occlusion of the ear canal. While this can be considered irrelevant for the observed preference for SSC at low levels, it could have influenced preference at high levels. Whether being able to fit more precisely to the negative target gains would have had a positive or a negative impact on the results is uncertain. Nevertheless, since our results show a clear preference for reduced gain at higher levels, a negative impact seems unlikely.
Limitations and Outlook
Further Development of SSC
As mentioned above, SSC can require negative target gains. In the current study, negative gains could not always be realized due to the use of standard domes. In future studies, the gain prescription should either be modified to avoid unrealistic target gains or custom ear molds should be used to enable more occlusion of the ear canal at low frequencies.
To achieve the goal of placing speech information within a listener's sweet-spot area, a fixed CR of 5:1 was applied in the speech-relevant frequency range (500–4,000 Hz). Typical age-related hearing loss is characterized by poorer hearing thresholds at high frequencies and better hearing thresholds at low frequencies (Figure 1). For such audiometric configurations, frequency-dependent CRs might be more appropriate to use, as the sweet-spot area likely varies with the degree of hearing loss. Future research should ideally address this.
Another feature that should be incorporated into SSC is protection against sudden level increases. An algorithm that detects non-speech transients and quickly reduces gain for such sounds while retaining speech transients would be optimal for this, as this would minimize distortions of the speech signal (a key goal of SSC). Based on previous approaches such as “dual-front-end automatic gain control” (Moore & Glasberg, 1988), “AntiSchock” (Liu et al., 2012), or “SoundSmoothing” (Chalupper & Powers, 2007), this could be achieved by analyzing the input signal in terms of its envelope steepness and/or the ratio between the peak level and long-term level. If the envelope is steeper than expected for speech and/or the peak-to-long-term level ratio exceeds a certain threshold, the incoming sound would be classified as a non-speech transient and be attenuated.
Further Evaluation of SSC
In the current study, we assessed SI using fixed overall speech and noise levels. To capture performance differences between SSC and other amplification strategies beyond those observed here, future evaluations should include more dynamic acoustic conditions, including transient sounds. Additionally, differences between the amplification strategies can be influenced by the noise type and test SNR. At negative per-channel SNRs, where HA gain is driven by the noise level, across-signal-modulation distortions can have detrimental effects on SI (Stone & Moore, 2007, 2008). Since across-signal modulations are more likely to occur with short compression time constants (May et al., 2018; Stone & Moore, 2007, 2008), potential benefits in fluctuating noise provided by SSC (with its long time constants) could be greater than in the current study, where mainly positive test SNRs (grand average across participants: 3.4 dB SNR) were used. In stationary noise, on the other hand, these benefits could be less pronounced due to the amplification strategies behaving more linearly in the absence of large level fluctuations. In future work, a more comprehensive evaluation with different noise types and test SNRs is therefore warranted.
Another limitation of our study is the relatively small sample size (Part A: N = 18; Part B: N = 17). Additionally, we focused on participants with mild to moderate hearing losses. It is therefore unclear whether our findings generalize to larger cohorts and listeners with more severe hearing losses.
Finally, the current study used NAL-NL1 amplification with a short AT and a long RT as the reference condition. While this approach ensured good comparability with previous work (Fereczkowski et al., 2024), NAL-NL1 has been largely replaced by the “National Acoustic Laboratories – Non-Linear 2” (NAL-NL2) rationale (Keidser et al., 2011) and the recently released “National Acoustic Laboratories – Non-Linear 3” (NAL-NL3) rationale (Incerti et al., 2025). Compared to NAL-NL1, NAL-NL2 and NAL-NL3 prescribe higher CRs. In follow-up research, we will therefore compare SSC with NAL-NL2- and NAL-NL3-based amplification.
Footnotes
Acknowledgments
The authors thank Brian C.J. Moore and another anonymous reviewer for their useful comments on an earlier version of this article. They also thank Josephine Bach Rasmussen and Emma Søndergaard Pedersen (both University of Southern Denmark) for their help with the data collection.
Ethical Considerations
The current study was evaluated by the Regional Committees on Health Research Ethics for Southern Denmark, which deemed that full ethical approval was unnecessary (case no. 20222000-91). A waiver was therefore granted, as is standard practice in the Danish system.
Consent to Participate
The participants received oral and written instructions about the study's purpose and aims and signed an informed consent form. They were compensated financially for their participation.
Funding
The authors disclosed receipt of the following financial support for the research, authorship, and/or publication of this article: This work was supported by the William Demant Fonden (grant number 21-2011).
Declaration of Conflicting Interest
The authors have no financial or non-financial conflicts of interest to declare.