
Abstract
The long-term stability of neural responses to cochlear implant (CI) stimulation and programmed stimulation levels remains unclear. Although smaller cohort studies suggest stabilization within months postimplant, reprogramming still consumes significant clinical time. The aim of this study was to investigate the resilience of the auditory nerve to prolonged stimulation from CIs and identify changes in the clinically provided stimulation levels over time. Stimulation parameters (n = 14,072 MAPs), electrophysiological auditory nerve thresholds (n = 23,215), and slopes of amplitude growth functions (n = 17,849) were obtained from 664 bilaterally implanted children (n = 1,291 devices) followed between September 2003 and July 2022. Stimulation parameters stabilized within 12 months following implantation for most, but not all, devices (75.3% and 75.4% of devices for C-levels and T-levels, respectively). Electrophysiological measures demonstrated very minor changes per year postimplant (slopes: mean [SE] = 0.03 [0.002] μV/CU/year [95% CI: 0.02–0.03]; thresholds: mean [SE] = 0.35 [0.06] CU/year [95% CI: 0.24–0.47]). While age at implantation did not relate to clinically meaningful changes in electrophysiological measures (slopes: mean [SE] = 0.02 [0.002] μV/CU/year [95% CI: 0.01–0.02]; thresholds: mean [SE] = 0.07 [0.08] CU/year [95% CI: −0.08 to 0.23]), stimulation levels decreased for children implanted at older ages (T-levels before plateau: mean [SE] = −0.47 [0.03] CU/year [95% CI: −0.53 to −0.42]; C-levels before plateau: mean [SE] = −0.78 [0.03] CU/year [95% CI: −0.85 to −0.72]). These findings indicate long-term neural and CI programming stability, suggesting potential for directing clinical time to care in areas other than reprogramming after the first year of implant use.
Keywords
Introduction
The aim of the study was to investigate the resilience of the auditory nerve to prolonged stimulation from cochlear implants (CIs) in children and identify changes in the clinically provided stimulation levels over time. CIs deliver current from intracochlear electrodes to stimulate the auditory nerve throughout the lifetime of an implanted child. Clinically, this interaction can be monitored by recording auditory neural responses to CI stimulation, electrically evoked compound action potentials (ECAPs; Pfingst et al., 2015b). Implants are expected to last for decades, however, the stability of ECAP measures has not been assessed beyond the first few years of implant use, particularly in children (Hughes et al., 2001; Lai et al., 2004; Tanamati et al., 2009; Telmesani & Said, 2016). The continuous deterioration of the auditory pathway associated with some etiologies (Brooks et al., 2020; Cheng et al., 2020; Zhang et al., 2022) and acclimation of the developing auditory system to receiving any stimulation, may make children particularly vulnerable to changes over time (Hughes et al., 2001), despite the maturity of the peripheral neurons (Locher et al., 2013).
While the trauma of CI insertion can transiently disrupt the function of auditory neurons, previous work suggests ECAPs from healthy neural populations typically stabilize within a few weeks postimplant (Pfingst et al., 2015a). Instability in ECAP measures may reflect deteriorating neural populations. Changes between intraoperative and postoperative measurements over the duration of the follow-up period (up to almost 17 years postimplant) may indicate tissue growth or neural deterioration. The slopes of ECAP amplitude growth functions (AGFs) reflect neural density and health (Pfingst et al., 2015a; Pfingst et al., 2017; Ramekers et al., 2014; Swiderski et al., 2020), while ECAP thresholds indicate changes in the intracochlear environment surrounding the electrode site (Pfingst et al., 2015a). ECAP measures are hypothesized to demonstrate minimal changes over time indicating stable neural responses. However, changes that do occur could impact CI sensitivity and programming.
The goal of CI programming is to provide the developing auditory system with comfortable and meaningful stimulation for each electrode. Clinicians hesitate to provide loud sounds during initial programming sessions, especially in very young children, and gradually increase stimulation levels as the child acclimates to the device (Gordon et al., 2004; Incerti et al., 2017). Accordingly, stimulation levels are likely to increase initially postimplant and then stabilize. Age at implantation influences behavioral responses in CI programming (Gordon et al., 2004; Incerti et al., 2017). Older children can experience prolonged auditory deprivation, cortical reorganization, reduced neural recruitment, and altered loudness perception, and younger children may have higher initial thresholds due to inexperience and/or developmental immaturity necessitating age-specific CI programming strategies, particularly at initial CI activation (Gordon & Papsin, 2013; Steel et al., 2014).
Previous studies with smaller sample sizes suggest that stimulation levels and ECAPs stabilize postoperatively (Björsne & Magnusson, 2020; Henkin et al., 2003, 2006; Hughes et al., 2001; Incerti et al., 2017), yet, CI programming remains the focus of follow-up visits (Vaerenberg et al., 2014). While changes in stimulation levels have been reported for individual subjects (Hughes et al., 2001), small sample sizes may lack the power to detect long-term changes or differentiate group and subject-level trends. The stability of stimulation levels after their initial increase over the lifetime of the implant remains unclear. Adjustments are driven by subjective user feedback (Boyd, 2010; Vaerenberg et al., 2014), abnormal cochlear structure (Papsin, 2005), cochlear damage and etiologies of hearing loss (Incerti et al., 2017; Vargas et al., 2013), efforts to expand the electric dynamic range (DR; D’Elia et al., 2012), cognitive abilities (Sawaf et al., 2022), and impedance changes related to tissue encapsulation (Kawano et al., 1998; Newbold et al., 2011; Ni et al., 1992; Shepherd et al., 1994; Xu et al., 1997). Moreover, ECAP thresholds and stimulation levels depend on the type of CI array, primarily due to differences in proximity to the modiolus based on the intracochlear position of the array (DeVries et al., 2016; Franck et al., 2002; Gordon & Papsin, 2013; Jeong et al., 2015) and differ along the cochlea's apical and basal segments in an array-specific manner (Björsne & Magnusson, 2020; Gordon et al., 2004; Henkin et al., 2003; Jeong et al., 2015; Polonenko et al., 2016; Tavartkiladze et al., 2015; Telmesani & Said, 2016; Vargas et al., 2013). Consequently, some array types may be more vulnerable to impacts on speech perception from exceeding the implant's voltage compliance limits (Saoji et al., 2021).
Bilateral implantation is becoming increasingly common and bilateral devices are independently programmed requiring significant clinical time. If only minor adjustment in stimulation levels occurred following initial CI use, rather than reprogramming each ear during annual fitting appointments, clinical time could instead be spent collecting neural health measures (Bierer & Nye, 2014; Schvartz-Leyzac et al., 2020), selectively deactivating channels (Wohlbauer et al., 2025) or evaluating the use of alternative stimulation strategies, especially ones designed to optimize binaural hearing cues (Lopez-Poveda et al., 2019; Pastore et al., 2021). Moreover, quantifying long-term stability will indicate when after initial acclimation to CI input, symmetric programmed levels should be expected between bilateral devices, helping clinicians identify and prevent detrimental programming asymmetries (Fung et al., 2025; Tsai et al., 2022). Because bilateral implants are programmed independently, these findings will apply to unilateral users as well and can inform clinicians when reprogramming is needed. The present study considered the impact of implantation age and intracochlear array position when evaluating the long-term stability of peripheral neural responses and CI programming in parallel in over 600 children over nearly two decades.
Methods
The protocol for this study was approved by the Hospital for Sick Children's Research Ethics Board which adheres to the Tri-council Policy Statement: Ethical Conduct for Research Involving Humans (study #1000077376). Written consent was obtained from participants and/or caregiver.
Data
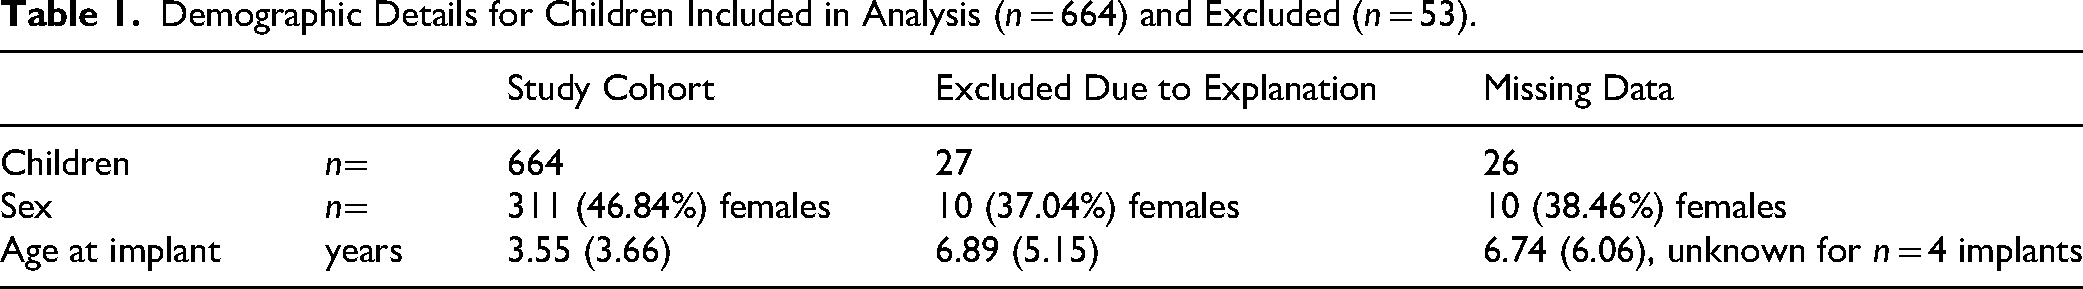
Inclusion criteria were children with bilateral CIs (n = 717) enrolled in the hospital research program who visited the Hospital for Sick Children's audiology clinic for routine clinical visits between September 2003 and July 2022 and who received Cochlear Ltd devices. Demographic details, CI stimulation settings (n = 684 children) and ECAP waveforms (n = 631 children) collected intraoperatively and at routine clinical visits between September 2003 and July 2022 were available for children bilaterally implanted (n = 691 with 1,345 devices). Some children only had data available for one implant (n = 37 children). Children who had undergone explantation were excluded (n = 27). The demographics of children included (n = 664 children included) and excluded (n = 26 excluded for missing data and n = 27 excluded for explantation) were compared (Table 1).
Demographic Details for Children Included in Analysis (n = 664) and Excluded (n = 53).
In total, n = 664 children with 1,291 devices were included in the analysis which comprised CI stimulation settings (MAPs) programmed during routine clinical visits between September 2003 and July 2022 (n = 14,072 MAPs from n = 657 children, n = 1,277 devices) as well as ECAP measurements obtained intraoperatively and during clinical visits between February 2006 and July 2022 (n = 23,215 ECAP AGFs from n = 608 children, n = 1,132 devices). Some children had MAPs but not ECAP measurements (n = 56) while some with ECAP measurements did not have MAPs (n = 7). The type of array and implant sequence are detailed for children included in the study (Table 2).
Implantation Details and Device Type of Children Who Participated in the Study (n = 664 Children, n = 1,291 Devices).

Note. CI = cochlear implant.
ECAP Measurement Procedures
ECAPs were recorded intraoperatively and postoperatively as part of routine follow-up visits scheduled to occur at the initial device activation (3–4 weeks postoperatively) and approximately 1 week, 1 month, 3 months, 6 months, and 12 months later with annual audiology appointments thereafter. The actual timing of the follow-up appointments was more variable due to clinical availability and patients’ schedules. ECAPs measured at these clinical visits between February 2006 and July 2022 (n = 23,215 ECAP AGFs from n = 608 children, n = 1,132 devices) were included. The average length of follow-up of clinical visits was 5.36 (4.46) [95% CI: 5.24–5.48] years postimplant and 4.57 (3.24) [95% CI: 4.48–4.65] observations were collected on average for each electrode over this period.
ECAPs were recorded using the Neural Response Telemetry (NRT) system (Cochlear Ltd, Sydney, Australia) by stimulating a target electrode and recording from an adjacent electrode referenced to the intracochlear electrode MP1 using the forward masking procedure (Brown et al., 1990). The clinical protocol included measurement of ECAPs at basal (#3), midarray (#9), and apical (#20) electrodes. Measurements were conducted at additional electrodes in select cases based on the clinicians’ judgment.
ECAP thresholds were measured in response to a range of current stimulation levels in a part of clinical software designed to perform objective measures (CustomSoundEP) using a regression analysis or through the autoNRT algorithm (Botros et al., 2007) available in the software used for programming user settings (CustomSound). Typically, ECAP thresholds are measured intraoperatively using a regression analysis to immediately confirm device function and allow for stimulation across a wider DR as the child is sedated. At postoperative follow-up visits ECAPs were measured using either a regression analysis or autoNRT. AGFs were derived using the NRT system by measuring ECAP waveform amplitudes in response to increasing stimulation levels. For the regression analysis, a regression line was fit to the AGF with increasing stimulation levels. The y-intercept of the regression line predicted the threshold of the response (tNRT). The tNRT has been shown to correlate with ECAP thresholds measured using a visual detection approach, like the autoNRT algorithm, defined as the minimum current stimulation level at which an ECAP amplitude peak was visibly detectable (Glassman & Hughes, 2013). To minimize the confounding impact of ECAP waveforms sampled non-uniformly and below threshold or above saturation, the AGF slope was quantified using a sliding window approach (Skidmore et al., 2022). Data points in the original AGF above threshold were resampled at 11 data points using linear interpolation and linear regression was sequentially applied to windows of four data points. The AGF slope was determined as the maximum slope of the data point subsets. Resampling was restricted to AGFs with more than three data points above threshold (n = 17,849 AGF slopes included, n = 5,366 AGF slopes excluded).
ECAP Waveform Analysis
If multiple ECAP waveforms were recorded in response to the same current intensity for the same AGF, the most recent timestamp was used. The last recorded ECAP threshold was used if multiple were recorded on the same day. If the timestamps were identical, the mean value was included. Only waveforms containing 32 samples collected at a 20,492 Hz sampling rate with a consistent pulse width were analyzed. To remove noisy AGFs, template matching was performed using a template waveform generated by averaging the ECAP recordings. Valid waveforms were identified as a positive correlation with the template. Only AGFs with at least three valid waveforms were included (n = 911 AGFs excluded out of 24,742).
CI Programming Procedures
CI programming occurred during the same routine follow-up visits when postoperative ECAP measurements were recorded (initial device activation [3–4 weeks postoperatively] and approximately 1 week, 1 month, 3 months, 6 months, and 12 months postimplant and annually thereafter). CI stimulation settings (MAPs) programmed during these routine clinical visits between September 2003 and July 2022 (n = 14,072 MAPs from n = 657 children, n = 1,277 devices) were included in the analysis. The average length of the follow-up for each implant was 7.05 (4.84) [95% CI: 6.78–7.31] years postimplant and included an average of 11.02 (6.02) [95% CI: 10.69–11.35] clinical MAPs (programmed sets of stimulation levels). Time series analysis was restricted to implants with more than three observations (see the Statistical Analysis section).
The lower (T-level) and upper (C-level) limits of electrical stimulation were programmed separately for each bilateral CI device in all users by a clinical audiologist. T- and C-levels were set at individual electrodes using a combination of behavioral responses to electrical stimulation as well as ECAP thresholds and electrically evoked stapedius reflexes where available. All audiologists had experience working with children and used developmentally appropriate behavioral measures. Levels for electrodes that had no test measures were set through interpolation and/or estimation based on a target DR or adjustment of all electrodes in concert. Sets of programmed stimulation levels (MAPs) and stimulation settings were extracted from CustomSound (Cochlear Ltd, Sydney, Australia) and all MAP parameters were extracted using a custom script in Python. The CI processors can hold multiple MAPs. Analyses were conducted on data in Program 1 as this was the primary MAP intended for daily use.
Statistical Analysis
Exclusion criteria were applied. Noisy AGFs (n = 911) and extremely low ECAP thresholds (<50 clinical units [CU]), stimulation levels (T-levels < 5 CU), and AGF slopes (<0 µV/CU) were attributed to measurement error and excluded from the analyses (n = 161 observations with extreme values excluded out of 797,538 observations total).
Temporal Stability Analysis
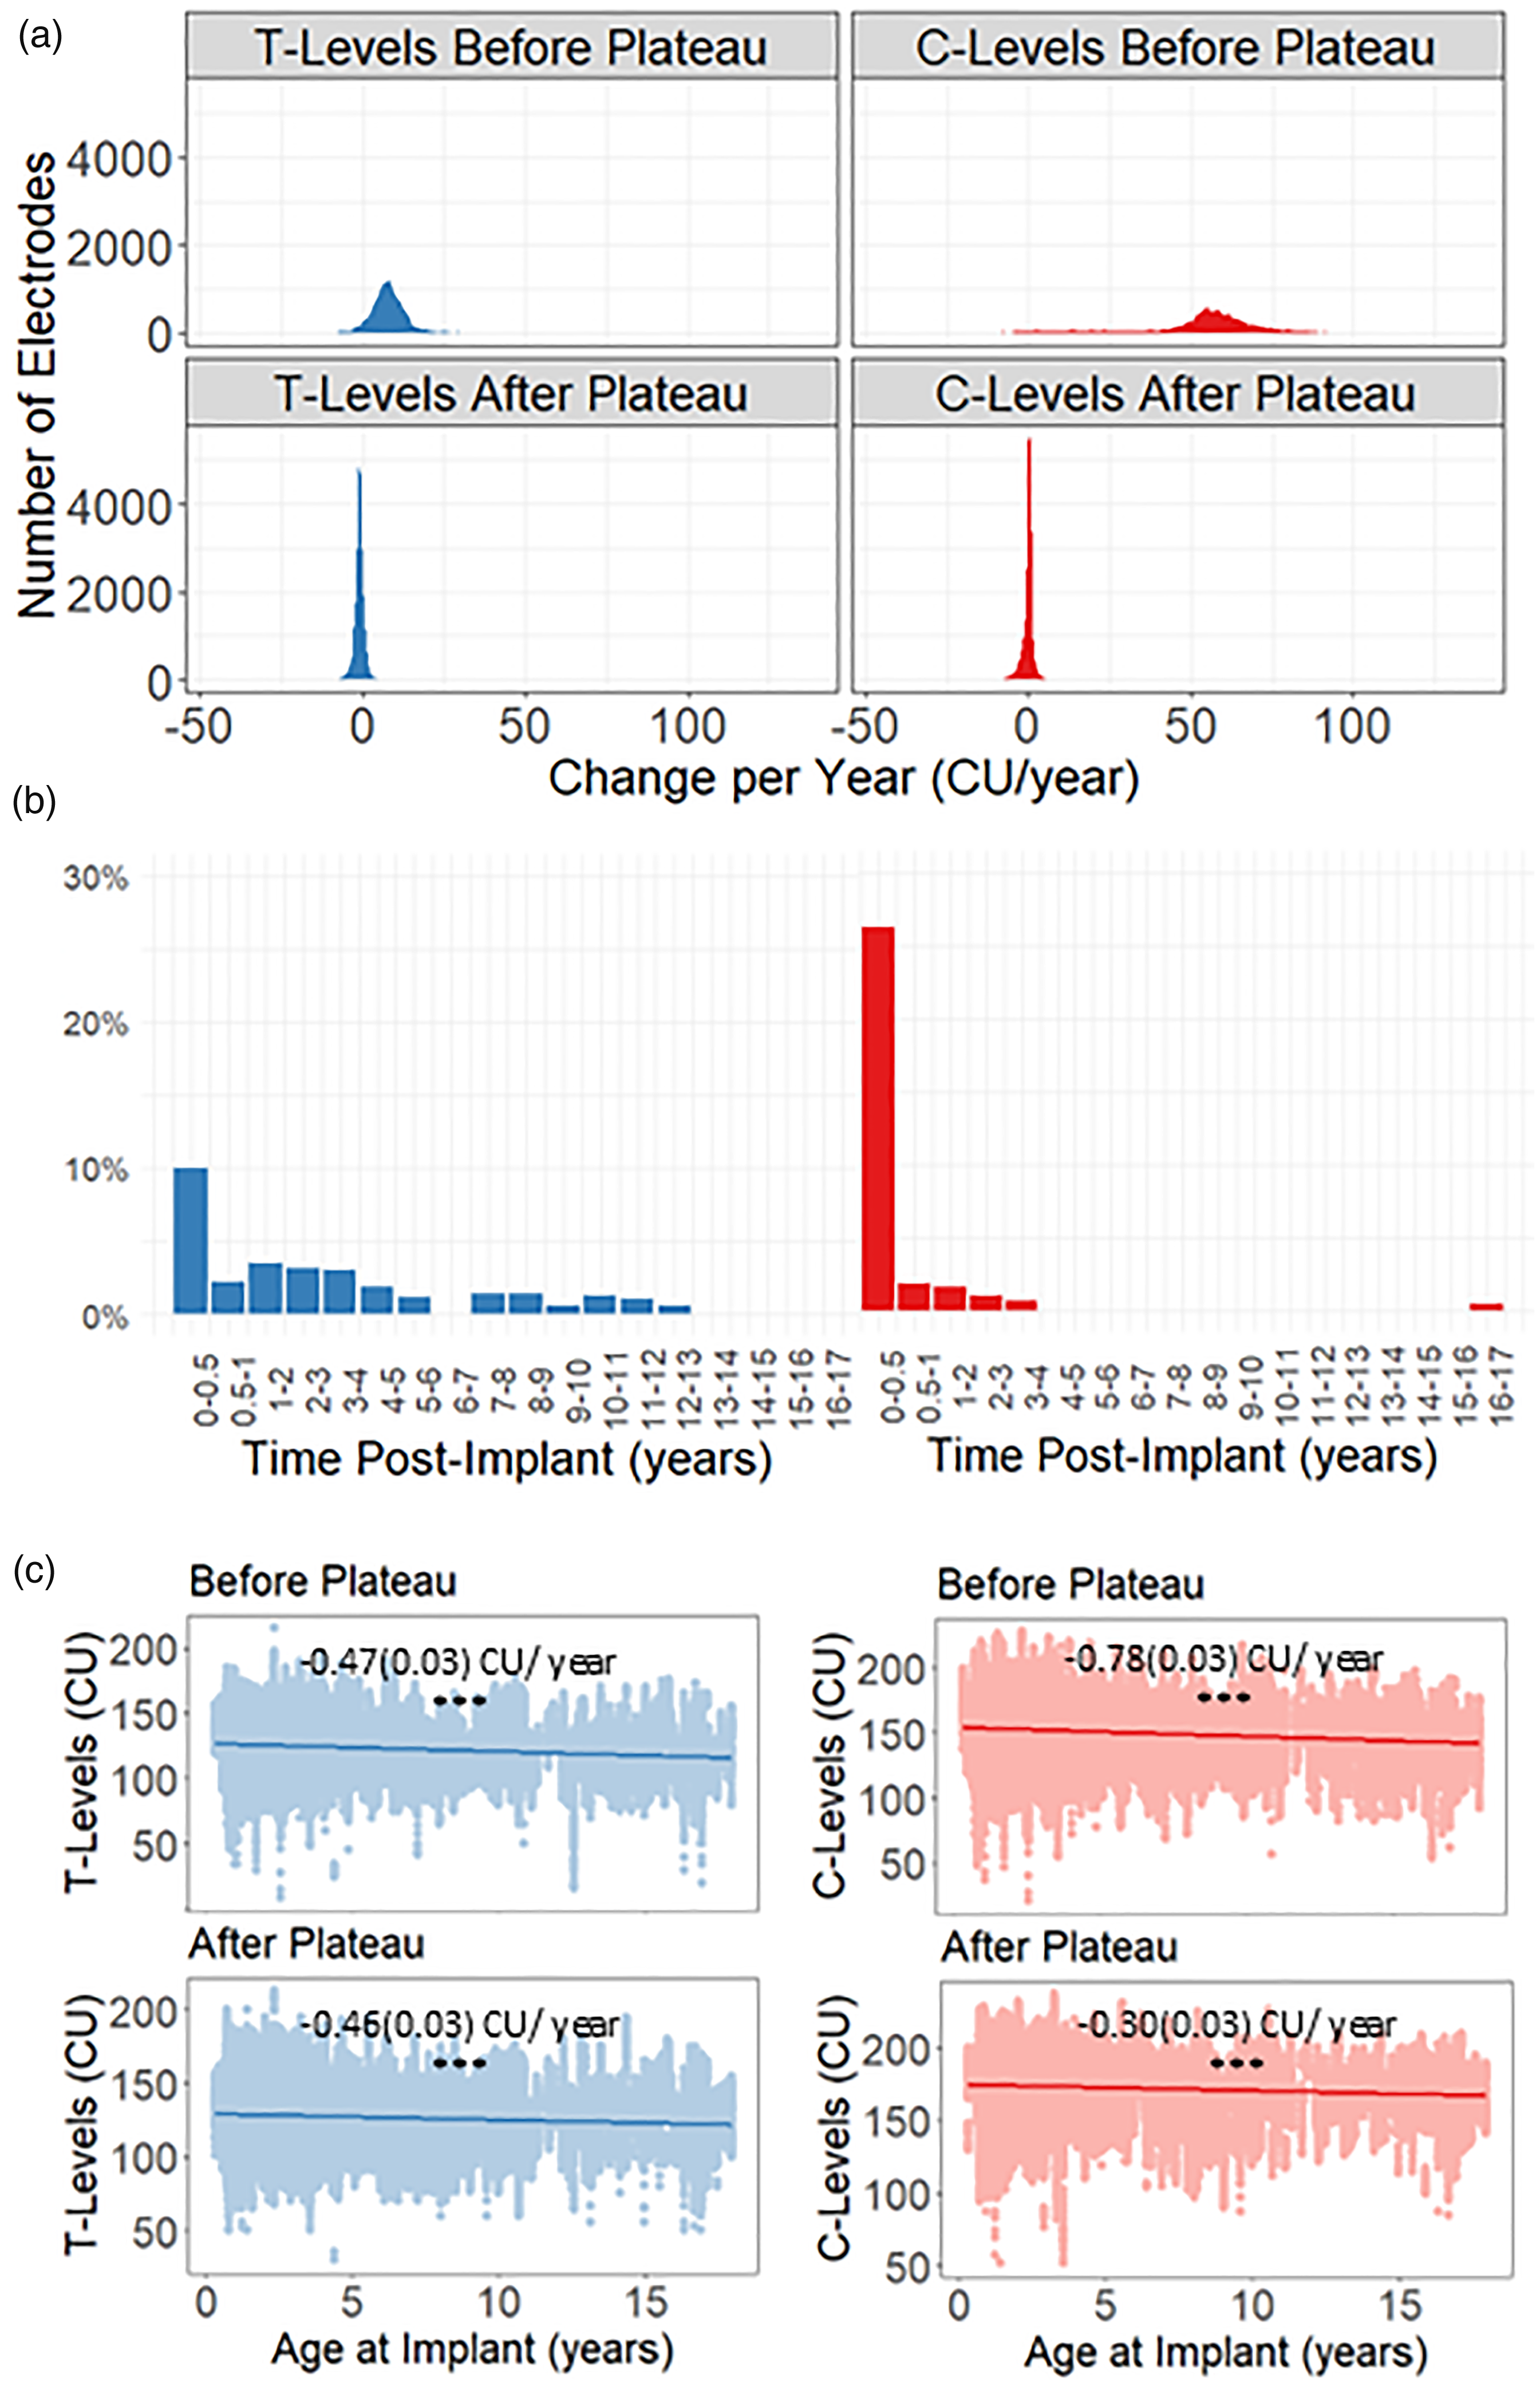
The expected initial increase in stimulation levels was isolated from the long-term evolution of T- and C-levels by fitting an increasing growth function and calculating the time needed for these levels to reach a plateau. For each electrode in each array from each child, an asymptotic function,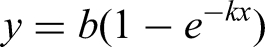
C-levels, T-levels, ECAP thresholds, and AGF slopes were independently evaluated using multivariable, linear mixed models for effects of time postimplant (years), age at implant (years), an interaction between time postimplant (years) and age at implant (years), electrode position (electrodes 1–22), CI device type (perimodiolar or straight), an interaction between electrode position and device type, as well as the ear implanted (left or right ear for simultaneously implanted CI users or first or second implanted ear or unknown order of implantation for sequentially implanted CI users) to account for bilateral implantation. Random intercepts and random slopes for years postimplantation were specified for each electrode allowing for variation in both the intercept and the slope over time postimplant (years). To address the positive skew and presence of low positive values of the AGF slopes distribution, a scaled log transformation (log(x + 1)) was applied. Model effects were assessed using type III analysis of variance tables using Satterthwaite's method (Tables 1–6 in the Supplemental materials). Means and 95% CIs from the models were reported. Posthoc comparisons were conducted on the categorical fixed-effects variables using estimated marginal means using the Tukey’s method to adjust for multiple comparisons and Satterthwaite's method to correct for degrees of freedom. Due to the large number of factors for electrode position, posthoc comparisons for example electrodes are included (see the Supplemental materials). Significance was defined as P < mpa#thinsp;0.05. Pre- and post-testing of model assumptions revealed collinearity between fixed effects and their interactions in the AGF slope, ECAP threshold, and T- and C-level models. To address this, models were evaluated without the interaction, and no differences in the significance of fixed effects were observed, aside from CI device type (perimodiolar or straight) reaching significance for the AGF slope model (F(1, 4542.20) = 4.05, P = .04).
To evaluate the stability of stimulation levels over time, separate mixed-effects models were used for T- and C-levels before and after their identified plateaus. Annual changes in T- and C-levels were quantified both at the electrode level (random slopes for time postimplant) and at the group level (fixed effects for time-postimplant), allowing comparison of stability during initial CI use versus after the determined plateau.
Voltage Compliance Analysis
Clinical guidance on the acceptability of out of compliance events and impact on speech perception (Saoji et al., 2021) has changed over the decades of CI programming included in this study. One clinical concern is that C-levels are limited by the 8.65 V compliance in Cochlear Ltd devices, particularly for straight arrays and older devices, where increasing the pulse width rather than the programmed C-levels may be detrimental to the battery life and temporal resolution (Langner et al., 2017).
Only C-levels with monopolar impedance recordings from the same day were included in the analyses (1,265 devices from 651 children). C-levels in clinical units, given by CustomSound software, were converted to charge per phase, according to Incerti et al. (2017). Older devices (n = 86) used a CIC3 chip while newer generations used a CIC4 chip (n = 1,179). C-levels were converted from clinical units to amperes based on the implant type chip (Incerti et al., 2017). The charge per phase was calculated as the product of the current amplitude (in μA) and pulse width and converted to charge in dB. Charge in dB scales linearly with current in CU. The required voltage for a given C-level was calculated as the product of the electrode monopolar impedance and the C-level (in μA).
Using the same techniques as described above, mixed model regression was used to evaluate C-levels (charge per phase in dB). Fixed effects included age at implant (years), device type (straight vs. perimodiolar), chip type (CIC3 vs. CIC4), and electrode position as well as an interaction between device and chip type, an interaction between chip type and electrode position, and an interaction between device type and electrode position. Random effects were included for each device (ear nested in subject ID). To investigate differences beyond implant type, a subanalysis was conducted on all CIC4 implant types. Fixed effects included age at implant (years), device type (straight vs. perimodiolar), and electrode position as well as an interaction between device type and electrode position. A random effect was again included for each device (ear nested in subject ID). Type III analysis of variance tables using Satterthwaite's method was used to evaluate the models (Tables 7 and 8 in the Supplemental materials). Pre- and post-testing of model assumptions indicated that electrode position was observed to be collinear with its interactions for all models. However, evaluation of models with and without the interactions did not reveal any difference in significance.
Following the previously described approach, a subanalysis of DR (charge per phase in dB) was conducted using separate mixed-effects models for the periods before and after T- and C-levels reached a plateau, employing the same fixed and random factors as the temporal stability analyses (see the Supplemental materials).
Data extraction and analysis was conducted using Python (version 3.11.1) and R (version 4.2.1; RStudio Inc.) using the lme4 package (Bates et al., 2015), lmerTest (Kuznetsova et al., 2017), emmeans (Lenth, 2025), bestNormalize (Peterson, 2021), VGAM (Yee, 2010), and CAR (Fox et al., 2024).
Results
Peripheral Neural Measures Depend on Their Position in the Cochlea
Long-term changes in auditory nerve responses to CI stimulation were evaluated in over 600 children with data spanning 16+ years. Figure 1a shows ECAP waveforms recorded in response to increasing currents. Figure 1b plots the AGFs from which the ECAP threshold and AGF slope are derived as N1-P2 amplitude against current. Mixed-model regression evaluated ECAP dependence on electrode location. Posthoc comparisons were conducted on the electrode position and array type fixed effects using estimated marginal means for the ECAP threshold and AGF slope models. Lower ECAP thresholds (as indicated by the asterisks in Figure 1c) but similar AGF slopes (Figure 1d) were observed for perimodiolar arrays, positioned proximal to the modiolus, than straight arrays residing further away (ECAP thresholds: mean [SE] = −13.05 [2.24] CU [95% CI: −17.43 to −8.67]; AGF slopes: mean [SE] = −0.08 [0.08] μV/CU, [95% CI: −0.20 to 0.08]). ECAP measures were affected by position from basal to apical ends of the CI array (electrode 3 vs. electrode 20 for ECAP thresholds: mean [SE] = 10.68 (1.36) CU [95% CI: 5.78–15.57]; AGF slopes: mean [SE] = −0.21 (0.04) μV/CU [95% CI: −0.31 to −0.09]).
(a) Example series of ECAP waveforms is shown as amplitude (µV) over time (µs) for each increasing current level (CU). (b) The corresponding growth of ECAP N1-P2 amplitude (µV) with increasing current level (CU). The ECAP threshold is indicated by the red dashed line. The distribution of ECAP thresholds (c) and AGF slopes (d) for perimodiolar arrays and straight arrays as a function of electrode position are shown. Posthoc comparisons of the AGF slopes and ECAP thresholds mixed-effects models revealed that similar AGF slopes were observed for both array types (mean [SE] = −0.08 [0.08] μV/CU [95% CI: −0.21 to 0.08]). But increased values were observed for apical electrodes (electrode 3 vs. electrode 20: mean [SE] = −0.21 [0.04] μV/CU [95% CI: −0.31 to −0.09]). ECAP thresholds were greater for straight arrays (mean [SE] = −13.05 [2.24] CU [95% CI: −17.43 to −8.67]; P < .05 as denoted by the asterisks), while decreased values were found at the apical end of the array (electrode 3 vs. electrode 20: mean [SE] = 10.68 [1.36] CU [95% CI: 5.78–15.57]). ECAP = electrically evoked compound action potential; AGF = amplitude growth function.
Peripheral Neural Measures Demonstrate Minor Deviations Over Time
The temporal patterns of ECAP measures, plotted in Figure 2a, were investigated. Intraoperative ECAPs are obtained while the child is sedated, providing immediate confirmation of implant function and enabling stimulation across the full DR without requiring behavioral cooperation. These measures provide an early baseline of neural responsivity that may inform initial CI programming. The median decrease between ECAP thresholds measured intraoperatively and at a postoperative follow-up visit within 6 weeks postimplant (presumably initial activation) was 19 CU (Q1 = 9, Q3 = 30) while the median decrease for AGF slopes was 5.40 μV/CU (Q1 = 2.04, Q3 = 9.44) (n = 820 electrodes with available data from n = 255 children). The model estimates for time postimplant for the ECAP thresholds and AGF slopes mixed-effects models indicated minor increases in AGF slopes (mean [SE] = 0.03 [0.002] μV/CU/year [95% CI: 0.02–0.03]) and ECAP thresholds (mean [SE] = 0.35 [0.06] CU/year [95% CI: 0.24–0.47]) between the operating room and over the course of 16+ years postimplant as denoted by the asterisks in Figure 2a.

(a) ECAP thresholds (mean [SE] = 0.35 [0.06] CU/Year [95% CI: 0.24–0.47]) and AGF slopes (mean [SE] = 0.03 [0.002] μV/CU/year [95% CI: 0.02–0.03]) slightly increased over time. (b) ECAP thresholds did not vary with age at implant (mean [SE] = 0.07 [0.08] CU/year [95% CI: −0.08 to 0.23]) but AGF slopes marginally increased with age (mean [SE] = 0.02 [0.002] μV/CU/year [95% CI: 0.01–0.02]). The asterisks denote significance as P < 0.001. The fixed-effect estimates for time postimplant and age at implantation for the AGF slopes and ECAP thresholds mixed-effects models are annotated as mean (SE). AGFs with measurable ECAPs over a DR > 10 CU (blue) were likely obtained via clinician-led regression analysis, while those ≤10 CU (pink) were likely measured using autoNRT, which applies a narrower stimulation range. While a wider AGF DR was used intraoperatively, a similar dispersion of both threshold determination methods is seen over time postimplant and age at implant. ECAP = electrically evoked compound action potential; AGF = amplitude growth function; DR = dynamic range.
In Figure 2b, the AGF slopes and ECAP thresholds mixed-effects models revealed that the age at which the child was implanted did not relate to changes in ECAP thresholds (mean [SE] = 0.07 [0.08] CU/year [95% CI: −0.08 to 0.23]) and did not interact with time postimplant (mean [SE] = −0.01(0.01) CU/year [95% CI: −0.04 to 0.02]). As indicated by the asterisks in Figure 2b, AGF slopes slightly increased with implant age (mean [SE] = 0.02 [0.002] μV/CU/year [95% CI: 0.01–0.02]) and the interaction between age at implant and time postimplant was minor for AGF slopes (mean [SE] = −0.002 [0.001] μV/CU/year [95% CI: −0.003 to −0.0006]). Overall, ECAPs stabilized postoperatively and exhibited marginal changes, if any, over time.
Stimulation Levels Stabilize Within the First Year of CI Use
As shown in Figure 3a for an example CI array and in Figure 3b for the entire cohort (n = 14,072 MAPs from n = 657 children, n = 1,277 devices) over a time span of up to 18 years, stimulation levels steadily increased immediately postimplant and appeared more stable thereafter. For each electrode, the initial increase was separated from the long-term evolution of T- and C-levels by fitting a function following this trajectory and determining the plateau onset. Mixed model regression quantified annual changes during early CI use and after the plateau, with random slopes for each electrode and a fixed effect of time postimplant to assess stability over time.

(a) T- and C-levels (blue and red, respectively) for all CI electrodes from an example child are plotted over time, demonstrating initial increases. (b) In the group, T- and C-levels increased exponentially to a plateau in 88.90% and 89.42% of electrodes for up to 18 years of CI use, respectively. Distributions of the time to plateau (years) for T- and C-levels for each individual electrode (c) and on average for each device (d) reveal that most reach plateau within the first year (gray shaded area). CI = cochlear implant.
In Figure 3, the times to plateau are plotted across electrodes (Figure 3c) and on average for each device (Figure 3d) with gray shading indicating electrodes plateauing within 1 year postimplant. Including electrodes for which time to plateau was not determined (11.10% and 10.58% of electrodes for T- and C-levels), the average time to plateau for each implant occurred within the first year of CI use for 75.25% and 75.41% of devices for T- and C-levels, respectively. For electrodes for which time to plateau was determined (n = 624 children of 657 total), mixed model regression assessed the temporal stability of each measure.
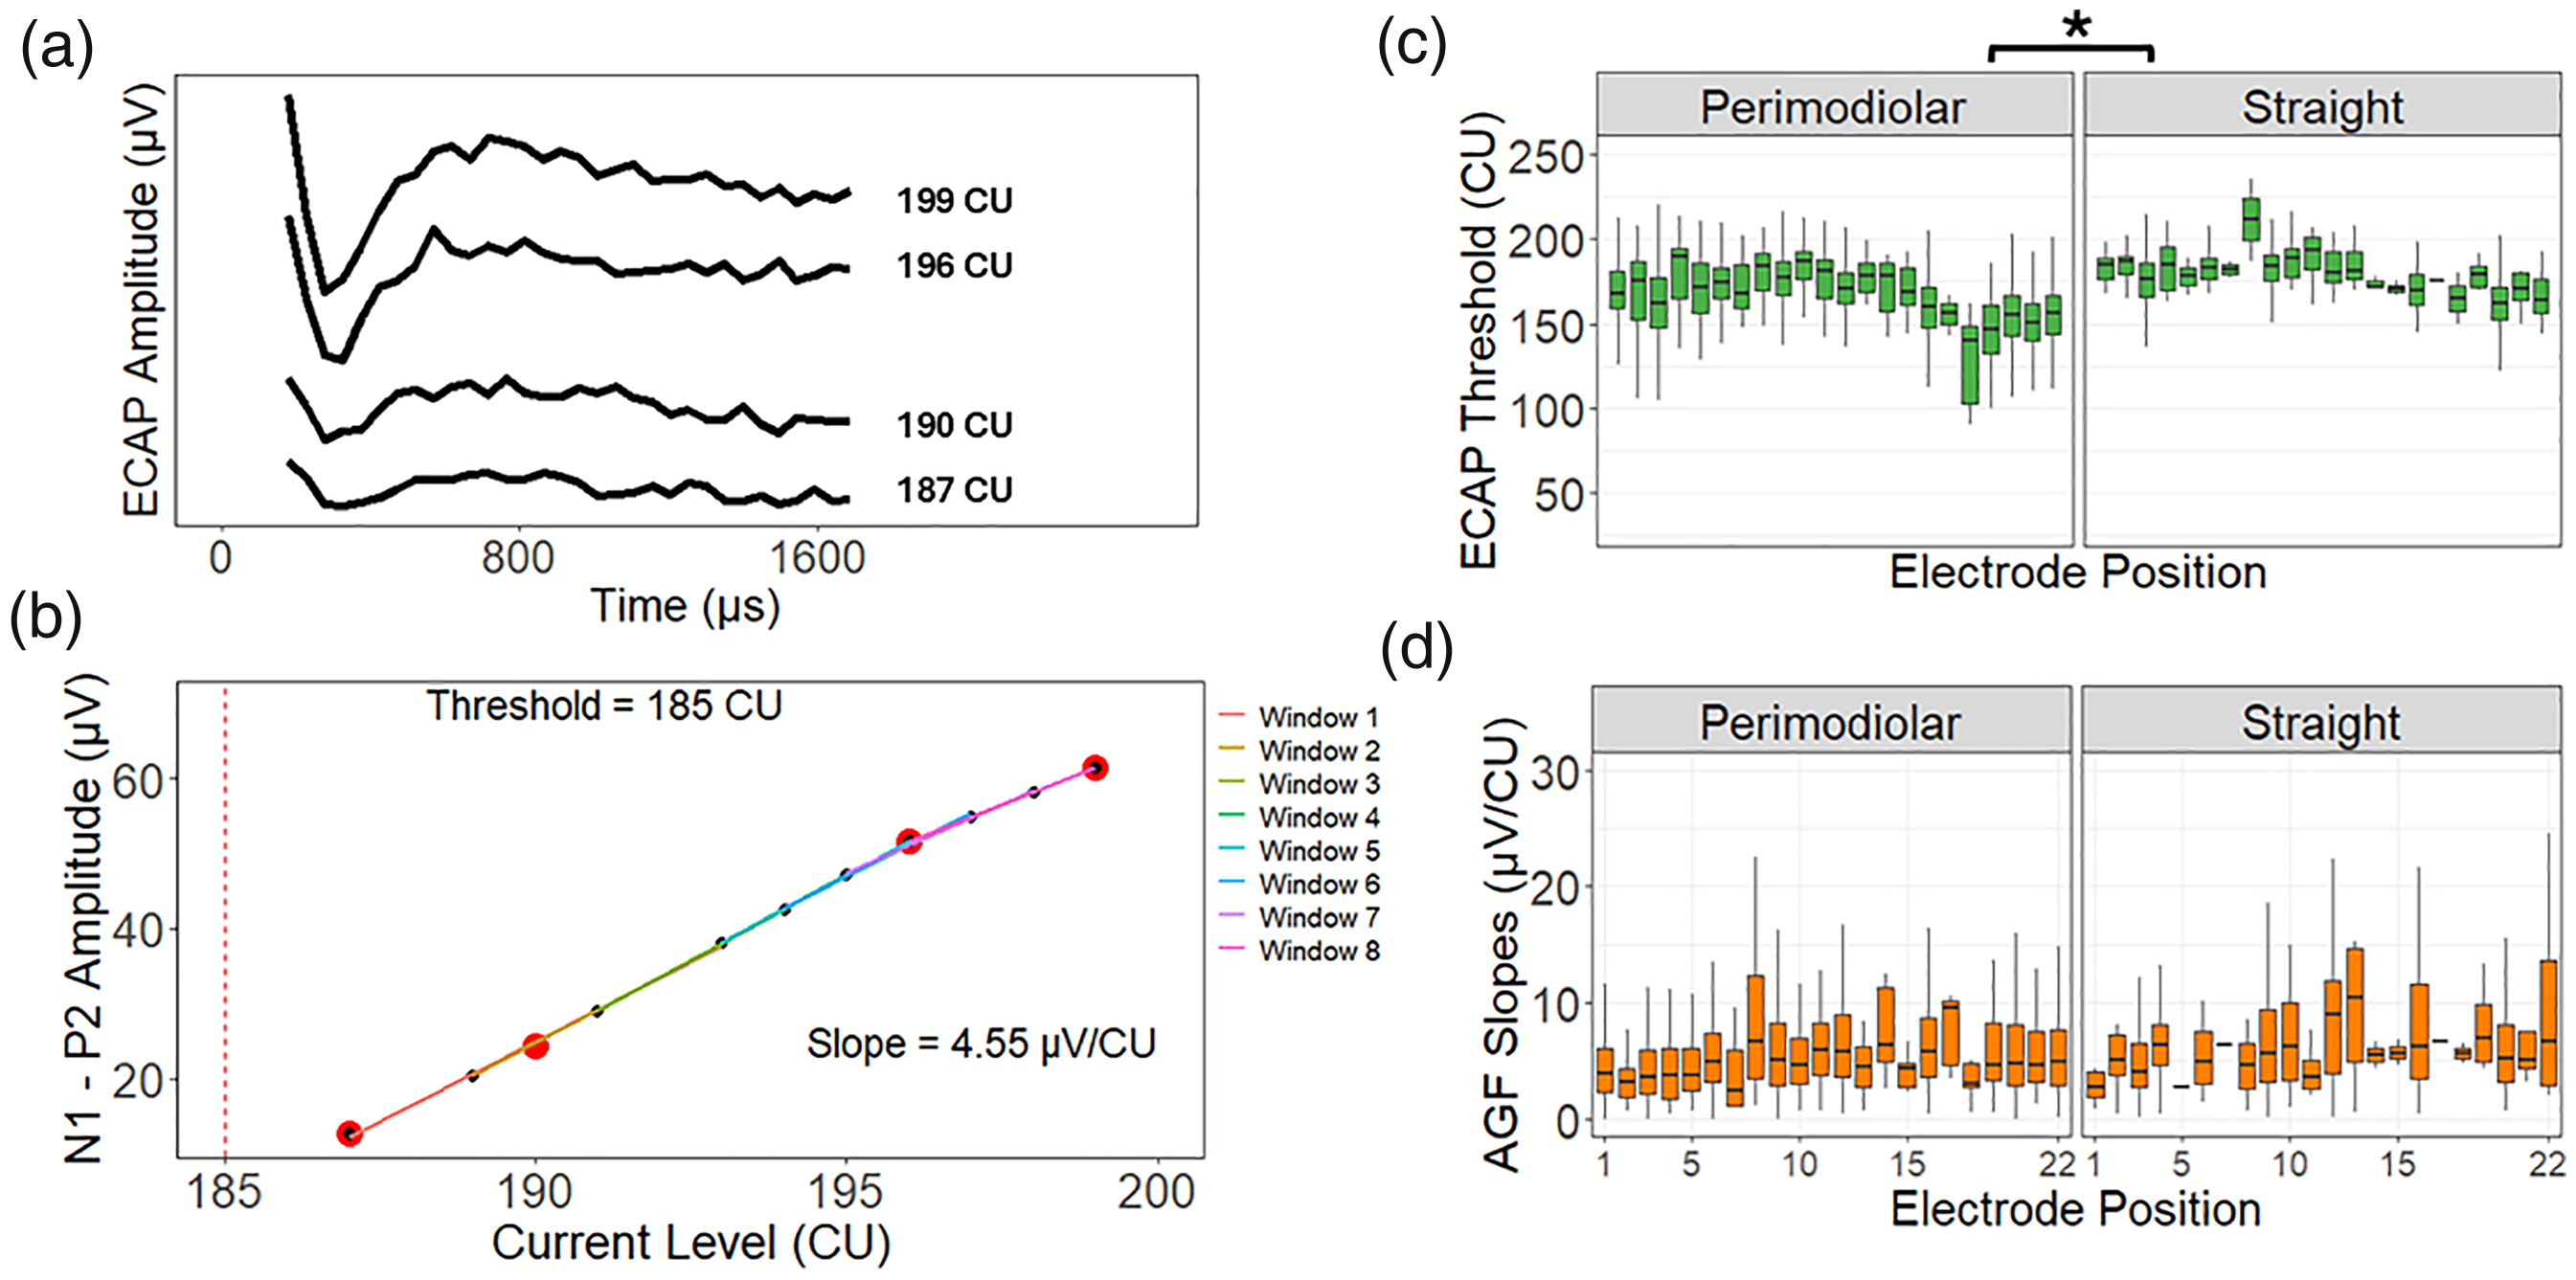
To isolate long-term changes from the initial increase, T- and C-levels were analyzed before and after plateauing. Electrode-specific slopes for time postimplant were calculated for data before the plateau to capture initial changes and for later data to assess long-term stability. Figure 4a plots the slopes for T-levels (left column) and C-levels (right column) before (top row) and after (bottom row) the identified plateau. Electrode-specific slopes for T-levels over time demonstrated a wide range (−27.82 to 53.38 CU/year), reflecting large increases in T-levels over time at the group-level indicated by the fixed-effects estimates for time postimplant (mean [SE] = 8.02 [0.27] CU/year [95% CI: 7.45–8.60]) in some children (Figure 4a, top left). After the plateau, electrode-specific slopes showed a smaller range of changes in T-levels over time (−9.50 to 7.28 CU/year) indicating stability in most children (Figure 4a, bottom left). T-levels minimally changed over time at the group level (mean [SE] = −0.88 [0.02] CU/year [95% CI: −0.92 to −0.83]).
(a) Distribution of electrode-specific slopes for time postimplant (years) for the linear mixed models for T-levels (blue) and C-levels (red) before the plateau (top row) and after the plateau (bottom row). (b) The median percent change (%) in T-levels (left) and C-levels (right) for the first 6 months, 0.5–1 year, and yearly time intervals thereafter for the entire time series. (c) T-levels (Left) and C-levels (right) for all electrodes were compared to the age at which the child was implanted (years) before (top row) and after (bottom row) the plateau. The model estimates for age at implantation are annotated as mean (SE). The asterisks denote a significant difference as P < 0.001. While significant changes in T- and C-levels occur over the first few months postimplant, only minor changes are observed long term. Moreover, T-levels (before the plateau: mean [SE] = −0.47 [0.03] CU/year [95% CI: −0.53 to −0.42]; after the plateau: mean [SE] = −0.46 [0.03] CU/year [95% CI: −0.52 to −0.41]) and C-levels (before the plateau: mean [SE] = −0.78 [0.03] CU/year [95% CI: −0.85 to −0.72]); after the plateau: (mean [SE] = −0.30 [0.03] CU/year [95% CI: −0.35 to −0.24]) decreased for children implanted at older ages.
Slopes of C-level changes before the plateau revealed a wide range of positive values (up to 136.93 CU/year) reflecting large initial increases (Figure 4a, top right) which reduced to −11.16 to 7.59 CU/year after the plateau (Figure 4a, bottom right). Model effects revealed that C-levels increased considerably before the plateau (mean [SE] = 53.13 [0.75] CU/year [95% CI: 51.07–55.17]) but showed minor changes over time after the plateau (mean [SE] = 0.08 [0.02] CU/year [95% CI: 0.03–0.13]). Moreover, as shown in Figure 4b, the median percent change in consecutive T- and C-levels per electrode showed large increases in the first six months postimplant, then gradually declined to negligible levels.
Children Implanted at Younger Ages Have Higher Programmed Current Levels
As shown in Figure 4c (denoted by asterisks), the model estimates for age at implant for the mixed-effects models indicated that T-levels were higher for children implanted at younger than older ages before and after the plateau (before the plateau: mean [SE] = −0.47 [0.03] CU/year [95% CI: −0.53 to −0.42]; after the plateau: mean [SE] = −0.46 [0.03] CU/year [95% CI: −0.52 to −0.41]). C-levels were also higher for younger than older implantees (mean [SE] = −0.78(0.03) CU/year [95% CI: −0.85 to −0.72] before the plateau), but to a lesser extent after the plateau (mean [SE] = −0.30 [0.03] CU/year [95% CI: −0.35 to −0.24]). Age at implantation was associated with long-term differences in CI programming even after stabilization was reached as evidenced by the mixed-effects model interaction between time postimplant (years) and age at implantation (years) for C-levels before (mean [SE] = 1.75 [0.16] [95% CI: 1.44–2.07]), and to a lesser extent after plateauing (mean [SE] = −0.05 [0.005] [95% CI: −0.06 to −0.04]) as well as T-levels after plateauing (mean [SE] = −0.02 [0.005] [95% CI: −0.03 to −0.01]), but not before (mean [SE] = −0.08 [0.06] [95% CI: −0.19 to 0.04]). Consistent with the faster increases in C-levels over time for older ages of implant prior to the identified plateau, the mean age at implant was comparable to the mean for the entire cohort (mean [SD] age, 3.55 [3.66] years) for C-levels plateauing before one year of CI use (mean [SD] age, 3.61 [3.73] years) but slightly lower for C-levels plateauing after (mean [SD] age, 2.91 [2.65] years). While age at implantation influences stimulation levels over time, the most noticeable effect is the greater increase in C-levels during initial CI use among children implanted at older ages.
Stimulation Levels are Dependent on CI Array Type
Figure 5 shows stimulation levels for two example children (Figure 5a), one with a straight array and the other with a perimodiolar array. Across children (asterisks denotes significance as P < mpa#thinsp;0.001 in Figure 5b), a larger reduction in T- and C-levels was observed for perimodiolar arrays before the plateau (T-levels before plateau: mean [SE] = −9.28 [0.37] CU [95% CI: −10.00 to −8.55]; C-levels before plateau: mean [SE] = −6.16 [0.39] CU [95% CI: −6.93 to −5.40]) than after (T-levels after plateau: mean [SE] = mpa#thinsp; - 6.79 [0.36] CU [95% CI: −7.49 to −6.08]; C-levels after plateau: mean [SE] = −3.47 [0.36] CU [95% CI: −4.18 to −2.76]) as indicated by posthoc comparison of the mixed-effects models for CI array type. The DR of electrical stimulation (charge per phase in dB), the difference between the T- and C-levels (Figure 5a), was also reduced for straight arrays compared to perimodiolar before and after the plateau of both the T- and C-levels (perimodiolar vs. straight: DR before T-levels plateau: mean [SE] = 0.48 [0.03] dB [95% CI: 0.42–0.54]; DR before C-levels plateau: mean [SE] = 0.49 [0.03] dB [95% CI: 0.43–0.55]; DR after T-levels plateau: mean [SE] = 0.46 [0.03] dB [95% CI: 0.40–0.52]; C-levels after plateau: mean [SE] = 0.46 [0.03] dB [95% CI: 0.40–0.52]).

(a) An example MAP showing C-levels (red) and T-levels (blue) for each electrode position for a child implanted with a perimodiolar array (left column) and a child implanted with a straight array (right column). (b) The distribution of T-levels (left) and C-levels (right) after the identified plateau for perimodiolar arrays and straight arrays for each electrode position are shown. (c) Distribution of required voltage for programmed C-levels for perimodiolar arrays (left column) and straight arrays (right column). The black solid line depicts the compliance limit (8.65 V). Values well below (<7 V), nearing (7–8.65 V), and exceeding compliance limits (>8.65 V) are respectively indicated by the white, light gray, and dark gray shading. The asterisks indicate the significance as P < .001 for the posthoc comparisons using estimated marginal means for CI array type for the T- and C-levels after the plateau linear mixed-effects models. Stimulation levels vary throughout the cochlea with lower values observed for perimodiolar arrays compared to straight arrays (T-levels before plateau: mean (SE) = −9.28 (0.37) CU [95% CI: −10.00 to −8.55]; C-levels before plateau: mean (SE) = −6.16 (0.39) CU [95% CI: −6.93 to −5.40]); T-levels after plateau: mean (SE) = -6.79 (0.36) CU [95% CI: −7.49 to −6.08]; C-levels after plateau: mean (SE) = −3.47 (0.36) CU [95% CI: −4.18 to −2.76]). Out of compliance events were uncommon but occurred more often for straight than perimodiolar arrays.
Almost all (97.04% and 99.51%) C-levels were set below the compliance limit for straight and perimodiolar arrays, respectively (Figure 5c). Posthoc comparisons of the voltage compliance models for CI array type and implant chip type revealed that that stimulation requirements were lower for perimodiolar implants and newer CIC4 chips (see the Supplemental materials).
Discussion
Long-Term Stability of CI Programming and ECAPs
Despite prolonged CI stimulation, peripheral neural measures did not demonstrate clinically meaningful changes over time (Figure 2), consistent with neural stability. The postoperative stabilization of ECAPs has also been shown in previous studies (Hughes et al., 2001; Lai et al., 2004; Tanamati et al., 2009; Telmesani & Said, 2016), indicating the resilience of the auditory nerve over the initial few years of CI use after healing from CI insertion (Pfingst et al., 2015a) and the protective effects of stimulation in some cases (Chen et al., 2010; Leake et al., 1991, 1992, 1999).
While differences in stimulation parameters, measurement techniques, and units complicate the relationship, AGF slopes consistently explain some variability in spiral ganglion neuron (SGN) density (Brochier et al., 2021; Skidmore et al., 2022). That being said, the AGF slopes analyzed here were derived from clinical threshold measurements using varying current ranges and likely reflect neural responsivity over a limited portion of the DR. Based on example AGF slopes (converted to μV/CU assuming a CIC4 Cochlear Ltd implant) for animals with variable SGN density (Pfingst et al., 2015b), differences in AGF slopes at the whole-number scale may reflect meaningful variation in neural responsivity. For most electrodes, changes on the level of decimals were observed here (Figure 2a). ECAP thresholds lie within the DR of C- and T-levels suggesting meaningful changes in ECAP thresholds (Figure 2a) would be on the same scale as those observed for CI programming (Figures 3b and 4a). However, changes in ECAP thresholds were an order of magnitude smaller than those observed for T- and C-levels during initial CI use and the long term. These minor changes in ECAP thresholds (changes at the electrode site; Helmstaedter et al., 2018; Lambriks et al., 2023; Spivak et al., 2011) and AGF slopes (varying neural health; Pfingst et al., 2015a, 2017; Ramekers et al., 2014; Swiderski et al., 2020) over the implant's lifetime (Figure 2) may reflect gradual neural deterioration with ongoing hearing loss.
For most implants, clinical programs followed the hypothesized trajectory in which current levels increased postimplant prior to plateauing at a set DR (Figure 3). Increasing C-levels as users become more experienced with electric hearing postimplant likely indicates emerging comfort with the DR provided by the CI or the setting of C-levels at a fixed DR above increased T-levels (Gordon et al., 2004; Incerti et al., 2017). Electrode-specific slopes showed considerable increases before the plateau, with only minor deviations observed afterward (Figure 4a). Although the relationship between stimulation levels and perception is likely highly variable between children, large changes in stimulation levels during early CI use might influence both speech perception and loudness cues. Expansion of the DR by even a few decibels can improve speech outcomes and affect access to interaural level differences relied on by CI users for sound localization (Dorman et al., 2014; Fung et al., 2025; Nunn et al., 2019).
Stimulation levels plateaued on average for each implant within the first year for most devices (∼75% in Figure 3c and 3d) aligning with previous studies indicating that T- and C-levels typically stabilize within months postimplant (Henkin et al., 2003, 2006; Hughes et al., 2001; Incerti et al., 2017). The slight difference in stabilization time points between this study and previous work may be due to the pooling or averaging of data for group-level analyses in other studies or the irregularly spaced sampling and variable temporal resolution of this study due to its retrospective design. While the data from a large cohort analyzed here indicated relative stability over time, there may be individual children who experience changes over time with clinically meaningful impact.
Some children did experience changes in sensitivity to CI stimulation over time and did not follow the hypothesized trajectory for T- and C-levels (Figures 3 and 4). It is possible that these children had particular etiologies of hearing loss and/or medical comorbidities affecting global development (Incerti et al., 2017). For example, CI programming is known to be particularly challenging in children with cochlear and auditory nerve malformations (Incerti et al., 2017) and some etiologies are associated with progressive SGN deterioration (Brooks et al., 2020; Cheng et al., 2020; Zhang et al., 2022). Changes in CI stimulation levels could also be related to asymmetric cortical reorganization in bilateral CI users (Gordon et al., 2013b, 2015).
Age at Implant Relates to CI Programming but Not ECAP Measures
Age at implant did not significantly affect ECAP thresholds (Figure 2). The minor increase in AGF slopes for children implanted at older ages (Figure 2b) suggests improved neural health (Pfingst et al., 2015a, 2017; Ramekers et al., 2014; Swiderski et al., 2020) in these children potentially reflecting better residual hearing at younger ages which progressed into CI candidacy with time. Alternatively, this could reflect declines with longer CI use in younger-implanted children but chronic CI stimulation has little effect on SGN populations in animal models (Chen et al., 2010) and the observed changes in AGF slopes over time were so small (Figure 2a) that they were unlikely to impact clinical outcomes.
In contrast to the ECAP measures, programmed stimulation levels were lower in children implanted at older ages (Figure 4c). The interaction between age at implant and time postimplant suggests that C-levels increase faster over time for children implanted at older ages before the plateau. This might be explained by more variability in behavioral responses observed during programming in younger than older implantees. T-levels are behavioral thresholds and may be impeded by sound inexperience or cortical processing impairments from prolonged hearing loss in older implanted children (Gordon et al., 2013a; Jiwani et al., 2013, 2016). Similarly, C-levels are a subjective measure of sound loudness and depend on the child's comfort with CI stimulation. Clinically, C-levels can be hard to set in children who have little prior experience of auditory loudness (Gordon et al., 2012, 2016). Further, loudness growth may change as neural recruitment adapts to the programmed DR (Steel et al., 2014). Thus, behavioral CI programming may become more efficient and consistent with age, CI experience, and therapy that emphasizes auditory development (Gordon et al., 2004).
CI Programming and ECAPs Depend on Electrode Positioning
Peripheral neural measures and MAP stimulation levels reflect differences in electrode positioning within the cochlea (Figures 1 and 5). Perimodiolar arrays, positioned closer to the modiolus, require lower stimulation levels and ECAP thresholds compared to straight arrays (Franck et al., 2002; Gordon & Papsin, 2013; Jeong et al., 2015). The wider DR observed here may improve speech perception and access to loudness cues needed for binaural hearing in bilateral CI users (Fitzgerald et al., 2015; Fu & Shannon, 2000; Nunn et al., 2019). Insertion of straight arrays is thought to be less traumatic and better preserve SGN populations and residual hearing (Mistrík et al., 2017; Wanna et al., 2014). However, the similar AGF slopes for perimodiolar and straight arrays observed here suggest that SGN populations can remain healthy and responsive to CI stimulation following implantation of a perimodiolar array.
Clinical Implications of Long-Term CI Stability
Overall, these findings support the long-term stability of neural responses and CI programming, suggesting that after the first year of implant use, clinical time may be more effectively directed toward other areas of care for children with CIs. This would also free time for more advanced aspects of CI programming including modifying channel frequency allocations, measurement of neural health and current spread (Bierer & Nye, 2014; Schvartz-Leyzac et al., 2020) to guide the selection of alternative stimulation strategies (Lopez-Poveda et al., 2019; Pastore et al., 2021), or selective channel deactivation (Wohlbauer et al., 2025). Moreover, efforts to match inputs between devices in bilateral CI users or bimodal listeners could be considered (Fung et al., 2025; Kan et al., 2013; Tsai et al., 2022; Zirn et al., 2015).
Analyses showed stability of ECAP and programmed stimulation levels over the long term but do not rule out random fluctuations from visit to visit. Random fluctuations in ECAP thresholds or slopes could result from measurement differences including changes to the DR of stimulation tested. Fluctuations in programmed levels could reflect clinical decision-making based on reports from the children and caregivers.
Limitations
This study has several limitations. First, data were from a single-CI center and manufacturer, with unassessed variability in etiology and hearing history. Most children used default stimulation settings, so deviations were not assessed in detail. Audiologists may vary CI programming approaches and ECAP threshold use individually. Analyses focused on the primary MAP, so results may not extend to secondary MAPs used for acclimation or context-specific listening. Additionally, slopes were quantified from AGFs measured for threshold determination over a relatively short DR and are likely not as sensitive to changes in peripheral neural responses as AGFs measured below threshold and above saturation. To mitigate these limitations, the AGF slopes were quantified using a sliding window regression which demonstrated improved correlation with SGN density (Skidmore et al., 2022). Finally, due to the retrospective design of the study, the number of observations decreased over time, potentially limiting the detection of changes late in the follow-up period.
Conclusion
Beyond initial healing following array insertion, ECAP measures do not demonstrate clinically significant differences over time or with age at implant, whereas stimulation levels vary over at least the first year of implant use. This study confirmed findings from smaller, short-term studies, showing that stimulation levels typically stabilize after the first year of CI use. Yet, some children do experience changes over time which may have a clinically meaningful impact. The stability of these measures over many years of CI use reflects the peripheral auditory pathway's resilience to electrical stimulation. Clinicians might consider consulting with families to identify and address any unsatisfactory aspects of the CI hearing experience in addition to or instead of remeasuring MAPs. Informing clinical decision-making based on the results outlined here may help achieve optimal electrical stimulation more efficiently in children who are currently experiencing potentially critical periods of auditory plasticity.
Supplemental Material
sj-docx-1-tia-10.1177_23312165251398130 - Supplemental material for Long-Term Stability of Electrical Stimulation in Children with Bilateral Cochlear Implants
Supplemental material, sj-docx-1-tia-10.1177_23312165251398130 for Long-Term Stability of Electrical Stimulation in Children with Bilateral Cochlear Implants by Carina J. Sabourin, Stephen G. Lomber, Jaina Negandhi, Sharon L. Cushing, Blake C. Papsin and Karen A. Gordon in Trends in Hearing
Footnotes
Acknowledgments
We would like to acknowledge the contributions of the study participants.
Ethical Approval and Informed Consent
The protocol for this study was approved by the Hospital for Sick Children's Research Ethics Board which adheres to the Tri-council Policy Statement: Ethical Conduct for Research Involving Humans (study #1000077376). Written consent was obtained from participants and/or caregiver.
Consent to Participate
Written consent was obtained from participants and/or caregiver.
Funding
The authors disclosed receipt of the following financial support for the research, authorship, and/or publication of this article: This work was supported by grants from the Canadian Institutes of Health Research (CIHR PJT-178259 and PJT-190077) to SGL.
Declaration of Conflicting Interests
The authors declared the following potential conflicts of interest with respect to the research, authorship, and/or publication of this article: Drs. Gordon, Papsin, and Cushing reported being on the Speakers Bureau for Cochlear Corporation during the conduct of the study. Dr. Cushing reported being on the Speakers Bureau for Interacoustics, receiving royalties as a Plural Publishing Editor for Balance Disorders in the Pediatric Population, as well as a Nova Publishing Editor for KJ Lee's Essential Pediatric Otolaryngology Textbook Volumes 1 and 2. Dr. Gordon reported being an adjunct faculty member at Salus University, Cochlear Americas Chair in Auditory Development, Bastable-Potts Health Clinician Scientist in Hearing Impairment, on the Advanced Bionics speakers bureau and receiving travel support from Med-El. Dr. Gordon is a consultant for Eli Lilly and Sensorion. Drs. Cushing and Papsin hold patent no. 7041-0, Systems and Methods for Balance Stabilization Sponsored Research Agreement—Cochlear Americas. Dr. Cushing is a Consultant for Decibel Therapeutics (Regeneron), Akouos (Eli Lilly). Sabourin was employed by Cochlear Ltd during the final revision stage of this manuscript. The remaining authors declared no potential conflicts of interest.
Data Availability Statement
Data are available upon request with agreement for specific purposes.
Supplemental Material
Supplemental material for this article is available online.
References
Supplementary Material
Please find the following supplemental material available below.
For Open Access articles published under a Creative Commons License, all supplemental material carries the same license as the article it is associated with.
For non-Open Access articles published, all supplemental material carries a non-exclusive license, and permission requests for re-use of supplemental material or any part of supplemental material shall be sent directly to the copyright owner as specified in the copyright notice associated with the article.