
Abstract
Auditory brainstem response (ABR) interpretation in clinical practice often relies on visual inspection by audiologists, which is prone to inter-practitioner variability. While deep learning (DL) algorithms have shown promise in objectifying ABR detection in controlled settings, their applicability to real-world clinical data is hindered by small datasets and insufficient heterogeneity. This study evaluates the generalizability of nine DL models for ABR detection using large, multicenter datasets. The primary dataset analyzed, Clinical Dataset I, comprises 128,123 labeled ABRs from 13,813 participants across a wide range of ages and hearing levels, and was divided into a training set (90%) and a held-out test set (10%). The models included convolutional neural networks (CNNs; AlexNet, VGG, ResNet), transformer-based architectures (Transformer, Patch Time Series Transformer [PatchTST], Differential Transformer, and Differential PatchTST), and hybrid CNN-transformer models (ResTransformer, ResPatchTST). Performance was assessed on the held-out test set and four external datasets (Clinical II, Southampton, PhysioNet, Mendeley) using accuracy and area under the receiver operating characteristic curve (AUC). ResPatchTST achieved the highest performance on the held-out test set (accuracy: 91.90%, AUC: 0.976). Transformer-based models, particularly PatchTST, showed superior generalization to external datasets, maintaining robust accuracy across diverse clinical settings. Additional experiments highlighted the critical role of dataset size and diversity in enhancing model robustness. We also observed that incorporating acquisition parameters and demographic features as auxiliary inputs yielded performance gains in cross-center generalization. These findings underscore the potential of DL models—especially transformer-based architectures—for accurate and generalizable ABR detection, and highlight the necessity of large, diverse datasets in developing clinically reliable systems.
Keywords
Introduction
Auditory brainstem response (ABR) is the early component of auditory evoked potentials, and commonly occurs within the first 10 ms after the stimulus onset (Ballachanda et al., 1992; Jewett & Williston, 1971). A typical ABR consists of seven vertex-positive waves labeled I–VII, of which I–V are usually investigated, with wave V being most prominent (Boettcher, 2002; Tsutsui et al., 1986). The ABR threshold, usually defined as the lowest stimulus intensity capable of evoking wave V, is clinically useful in objective assessment of hearing ability (Dobrowolski et al., 2016; Ren et al., 2016; Valderrama et al., 2012), particularly necessary for patients whose behavioral test results are unreliable. Determining whether an ABR, here particularly referred to as wave V, is present at various intensities is an essential step for this application. However, this process often requires visual inspection and subjective judgment by human experts (Lightfoot et al., 2019), which is time-consuming, costly, and highly variable (Vidler & Parker, 2004; Wimalarathna et al., 2022). Disagreements arise among even experienced audiologists and different trials on the same ABR data by the same expert (Pratt et al., 1995; Stueve & O'Rourke, 2003; Zaitoun et al., 2014), particularly as the stimulus intensity is decreased to threshold level. For these reasons, a computer-aided diagnosis method for objective and automated ABR detection is desirable to assist human experts.
Previous attempts to automate ABR detection for estimating hearing thresholds have primarily included statistical methods and artificial intelligence (AI) techniques. Statistical methods, such as Fsp (Chesnaye et al., 2018; Elberling & Don, 1984), Fmp (Chesnaye et al., 2018; McKearney, 2023), q-sample uniform scores test (Chesnaye et al., 2018; Stürzebecher et al., 1999), Hotelling's T2 test (Chesnaye et al., 2018, 2019), cross-covariance analysis (Suthakar & Liberman, 2019; Tanaka et al., 2023), Pearson product-moment correlation (Arnold, 1985; Wang et al., 2021; Weber & Fletcher, 1980), cross-correlation against a template (Davey et al., 2003, 2007; Elberling, 1979) or interleaved responses (Berninger et al., 2014), have been used to model relationships between variables and make predictions based on statistical assumptions. In contrast, AI techniques appear to exhibit stronger predictive power by learning complex relationships and temporal patterns within data in a data-driven manner, which are beneficial for ABR detection.
Machine learning (ML) and deep learning (DL) algorithms are subsets of AI. Several studies have leveraged ML to detect the ABR. With 285 ABR recordings from 10 ears available, Alpsan (1991) proposed a three-layered artificial neural network (ANN) to detect the presence or absence of ABR, achieving an accuracy of 74.9%. Acır et al. (2006) trained and evaluated a support vector machine (SVM) classifier on 648 ABR recordings from 36 adult normal-hearing ears, with the highest accuracy of 97.7% attained using discrete cosine transform coefficients as input features. Davey et al. (2007) proposed hybrid classification models combining ANN and C5.0 decision tree algorithms for automated ABR detection, using time, frequency, and cross-correlation measures from 550 ABR recordings of 85 subjects. They reported 95.6% accuracy for strong responses and 85% for weak responses. Based on the same dataset, McCullagh et al. (2007) extracted features in both the time and wavelet domains, achieving 83.4% accuracy with a Naïve Bayes classifier. These studies demonstrate that when combined with proper feature engineering methods, ML algorithms can achieve promising performance in ABR detection. However, they heavily rely on manual feature engineering, which requires considerable expertise.
Recently, the application of DL has enabled ABR detection without the need for manual feature extraction on waveforms, as demonstrated in a few studies. McKearney and MacKinnon (2019) introduced a one-dimensional convolutional neural network (CNN) to classify ABRs into three classes: “response present,” “response absent,” and “inconclusive”. The network was trained and tested on 232 paired ABR waveforms from 8 normal-hearing individuals, achieving an overall accuracy of 92.9%. McKearney et al. (2022) trained four types of ML and DL models on simulated data that were generated based on ABRs recorded from 12 normal-hearing participants and no-stimulus EEG data from 15 participants to detect the presence or absence of ABR. Their stacked ensemble model, which combined CNN-long short-term memory (CNN-LSTM) and random forest models, achieved an area under the receiver operating characteristic (ROC) curve of approximately 0.975. Liang et al. (2024) proposed the Wide & Deep model, which integrated a five-layer MLP model with time and frequency features, along with demographic factors, and a CNN-BiLSTM-Attention model using original and denoised signal sequences as inputs. Trained and evaluated on 2,556 ABR waveforms from 100 participants, this model achieved an accuracy of 91.0%. However, the inclusion of the pure-tone thresholds may have led to an overestimation of the model's true performance.
Despite the promising results, DL models have not yet been implemented in clinical practice, partly due to concerns about their generalizability. First, the scarcity of ABR data, typically with fewer than 100 participants, hinders the application of DL models that are always data-hungry for strong generalizability. Second, previous DL models have predominantly been trained on experimental datasets comprising young adults with normal hearing. This lack of diversity in training data can lead to poor generalizability, especially when applied to heterogeneous populations in real-world clinical settings (e.g., infants, children, and the elderly with and without hearing loss). It is important for training data to encompass the populations for which it will be used, including individuals with varying ages, sexes and hearing statuses. For example, there are known latency differences in the ABR between infants and adults (Moore et al., 1995) and age-related amplitude changes (Grose et al., 2019). Sex-related differences have also been observed, with males typically exhibiting longer latencies and smaller amplitudes compared to females (Aloufi et al., 2023; Dehan & Jerger, 1990). Additionally, age-related hearing loss has led to a decrease in the amplitude of ABR peaks (Frisina et al., 2016). Lastly, there is a lack of external validation since the models have been trained and tested on a single cohort. Moreover, none of the studies have comprehensively compared various DL algorithms on a large body of ABR data, a valuable step in recommending suitable models for clinical ABR detection.
To address these issues, the primary goal of this study is to develop generalizable DL models to detect the presence of wave V in the ABR using a large cohort of real-world clinical data. We evaluate and compare multiple DL models for detecting the ABR across multicenter datasets. The primary clinical dataset analyzed includes a total of 128,123 responses from 13,813 participants of varying ages and hearing statuses, ensuring better generalizability to clinical settings. Additionally, the trained models are externally validated on an independent clinical dataset and three publicly available datasets. The secondary goal is to systematically investigate the effect of training data size and diversity on the model's generalization performance. To achieve this, we train our model on subsets of varying sizes and compare its performance with that of the full training set. Furthermore, the model is trained on datasets with restricted age and hearing status groups and then validated on unseen groups, emphasizing the importance of diverse data for training generalizable DL models.
Materials and Methods
Datasets
In this study, we utilized a large clinically recorded dataset, referred to as “Clinical Dataset I,” for our main analysis. Additionally, an independent clinical dataset from a different hospital, referred to “Clinical Dataset II,” and three publicly available experimental datasets, namely the Southampton Dataset, PhysioNet Dataset, and Mendeley Dataset, were used for external validation. An overview of the properties of these datasets is shown in Table 1.
Description of Datasets.

− indicates information not reported in that study. CED = Cambridge electronic design; ABR = auditory brainstem response.
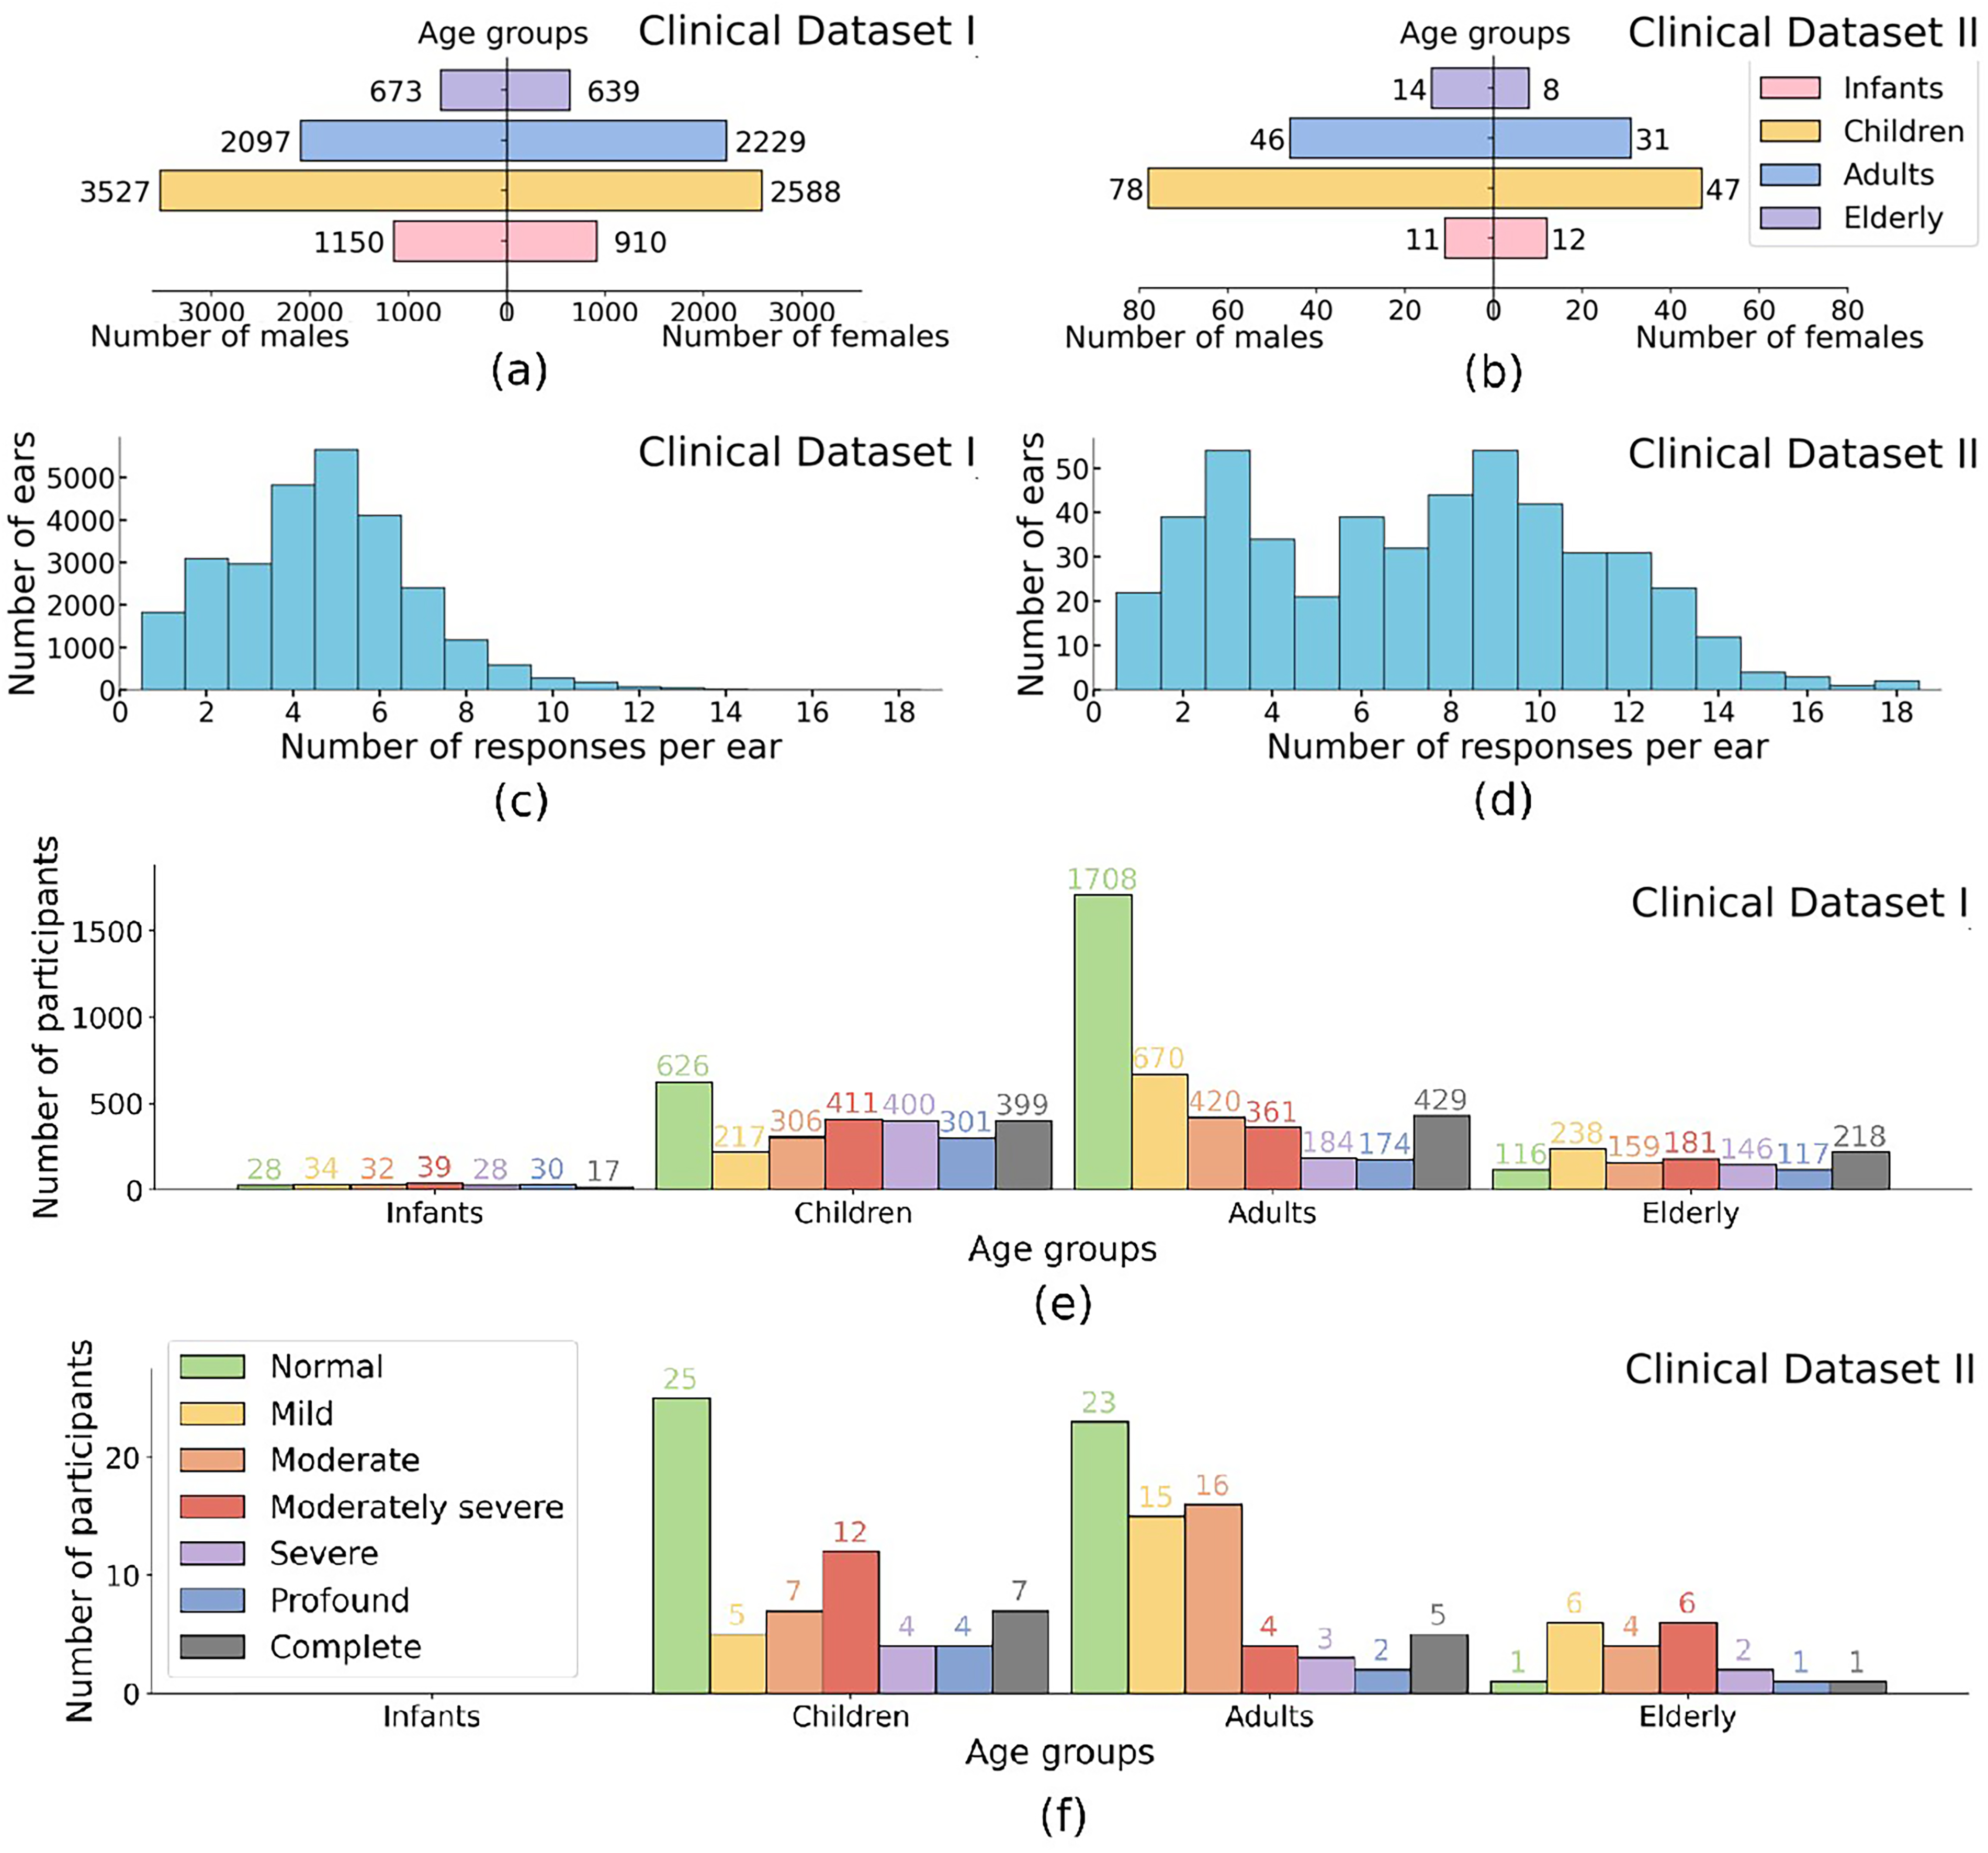
Participant demographics and data distribution for Clinical Datasets I and II. (a), (b) Age group distribution by gender: Infants: (
ABR testing was conducted in a sound-treated chamber with participants lying on a bed comfortably, using Eclipse evoked potential test system (Interacoustics Inc., Denmark) as part of routine clinical audiological assessments. A 100
The click intensities ranged from 100, 90, or 80 dBnHL (dB scale relative to normal hearing level) to the participant's ABR threshold in steps of 10 or 5 dB. Figure 2 provides four examples of ABR data recorded at a range of stimulus intensities. Labeling followed the criteria described by Sutton et al. (2013) and involved two stages. In the first stage (between January 2, 2018 and April 15, 2023), one of six experienced audiologists labeled the waveform immediately after ABR testing at each intensity, then reviewed the threshold based on the series of waveforms. Each waveform was labeled as either ‘‘response present (RP)’’ or ‘‘response absent (RA)’’ based on the presence or absence of peak V. In the second stage (between April 17, 2023 and December 28, 2023), two audiologists with over five years of experience independently inspected the series of waveforms and checked the labels. In cases of disagreement, a third expert was consulted to reach a consensus. In this dataset, 65% of ABR waveforms were labeled as RP and the remaining 35% as RA. These labels served as the ground truth for model training and testing.

Examples of auditory brainstem response (ABR). Four examples of ABR at a range of stimulus levels for hearing threshold estimation. Wave V is labeled where assessed as present.
Data Partition
Figure 3 illustrates the workflow of DL development and evaluation. Clinical Dataset I was used for our main analysis, split into 90% for model development (115,409 ABRs from 12,256 individuals) and 10% for testing (12,714 ABRs from 1,557 individuals). The 90% data were further divided into nine folds, with eight used for training and one for internal validation while fine-tuning hyper-parameters. The 10% data, referred to as the “held-out test set,” was used for model testing as it was wholly separate from model training. There was no overlap of subjects between subsets to reflect how well the DL models generalized to unseen ABR data.

Overview of the proposed deep learning framework for detecting auditory brainstem responses (ABRs). (a) Data preparation: Clinical Dataset I is split into 90% for training and 10% as the held-out test set, while Clinical Dataset II, along with the Southampton, PhysioNet, and Mendeley datasets, are used for external validation. (b) Model development: The training set is used for model development, including hyperparameter tuning using 9-fold cross-validation, followed by retraining with the optimized hyperparameters. (c) Model evaluation: The final models classify ABRs as response present or response absent, with performance assessed on five test sets to evaluate generalization across multicenter datasets.
Additionally, multicenter validation was conducted using Clinical Dataset II, Southampton Dataset, PhysioNet Dataset, and Mendeley Dataset as independent test sets, ensuring robust evaluation across diverse datasets and demonstrating the models’ generalizability in a multicenter context.
Data Preprocessing
First, the original ABR waveforms in Clinical Dataset I were down-sampled to 15 kHz, compressing each waveform to 180 data points for optimized memory usage and processing efficiency. Normalization was essential to ensure generalization across datasets with varying magnitude scales. Specifically, the waveform with the maximum amplitude in the set from one ear was transformed to the −1 to 1 range, while all the other waveforms in the same set were scaled proportionally. To align with Clinical Dataset I, a window of 0–12 ms was applied to all waveforms from Clinical Dataset II, Southampton, PhysioNet, and Mendeley Datasets, which were then re-sampled to 15 kHz and normalized using the same procedure. In this way, each ear had its own normalization factor rather than a global one, preserving relative amplitude information within each ear while mitigating interear variability. This process ensured that all datasets, despite their variations in amplitude, were represented on a uniform scale, facilitating effective model generalization across multicenter datasets.
Model Architectures
This study developed nine DL models for ABR detection, utilizing a variety of architectures. Three CNN-based models—AlexNet, VGG, and residual neural network (ResNet)—were designed to extract local ABR features. Additionally, four Transformer-based models were implemented: Transformer, Patch Time Series Transformer (PatchTST), Differential Transformer (DiffTransformer), and Differential PatchTST (DiffPatchTST), which leverage self-attention mechanisms to capture temporal dependencies in the ABR waveforms. To combine the strengths of CNNs and attention mechanisms, two hybrid models were introduced: ResTransformer (ResNet + Transformer) and ResPatchTST (ResNet + PatchTST). All models were trained using scaled ABR waveforms, represented as one-dimensional time series with 180 data points. The architectures of these models are illustrated in Figure 4.

Architectures of various DL models. CNN-based models: AlexNet, VGG, and ResNet; Transformer-based models: Transformer, PatchTST, DiffTransformer and DiffPatchTST; Hybrid models: ResTransformer and ResPatchTST. Note. DL = deep learning; CNN = convolutional neural network; PatchTST = patch time series transformer; DiffTransformer = differential transformer; DiffPatchTST = differential PatchTST.
Model Training and Evaluation
To address the class imbalance in the training dataset, the model was trained using weighted cross-entropy loss, where each class was assigned a weight inversely proportional to its sample size, ensuring equal contribution during training. We employed a combination of grid and random search to optimize the model's hyper-parameters with 9-fold cross-validation on the training set. Once the optimal hyperparameters were determined, the model was retrained on the full training set to produce the final model. Subsequently, its performance was evaluated on the held-out test set from Clinical Dataset I to assess its generalization on unseen ABR data. Besides, the trained model was externally validated on the four independent datasets-Clinical Dataset II, Southampton Dataset, PhysioNet Dataset, and Mendeley Dataset-to test its cross-center generalizability. All the nine models underwent the same training and evaluation process. Each training session had 20 epochs and a batch size of 512. The Adam optimizer was utilized to adjust the learning rate, with initial values tuned for each model (see optimal hyperparameters in Table 1 in SDC 2). A random seed of 888 was set for reproducibility in the data split process. All experiments were executed on a Linux machine with an NVIDIA RTX-4090 Ti GPU, using Python (version 3.11.5) and Pytorch framework (version 2.1.1).


F1-score provides a harmonic mean of precision and sensitivity, and is calculated by:
ROC curves are plots of sensitivity versus 1-specificity. Area under the ROC curve (AUC) was also calculated to evaluate the test performance. To compute 95% confidence interval (CI), the bootstrap resampling method with 1,000 bootstrap repetitions was used. Pairwise DeLong's tests (DeLong et al., 1988) were conducted to assess the statistical significance of AUC differences between models. Data were analyzed between April 16, 2023, and January 3, 2024.
Results
Performance Comparison of Models on Primary Clinical Dataset I
The performance of various DL models, including AlexNet, VGG, ResNet, Transformer, PatchTST, DiffTransformer, DiffPatchTST, ResTransformer, and ResPatchTST, was evaluated on Clinical Dataset I through both internal validation and hold-out validation. A summary of the results is provided in Figure 5.

Performance of deep learning models on Clinical Dataset I. (a) Error bar plots for accuracy, sensitivity, specificity, F1-score, and area under the receiver operating characteristic curve (AUC) (left to right), evaluated using 9-fold cross-validation on the training set. (b) Forest plots for the same metrics evaluated on the held-out test set. Bold values indicate the best performance for each metric.
For internal validation (i.e., 9-fold cross-validation on the training set), ResPatchTST achieved the highest accuracy at 91.07%
As shown in Figure 5(b), when evaluated on the held-out test set from Clinical Dataset I, ResPatchTST demonstrated the best performance across multiple metrics, achieving 91.90% accuracy (95% CI: 91.43%–92.40%), an AUC of 0.976 (95% CI: 0.973–0.978), and an F1-score of 0.919 (0.914–0.923). It also maintained balanced specificity (92.93%) and sensitivity (90.89%). ResTransformer, VGG, and ResNet, although slightly behind in accuracy, demonstrated strong generalization with AUCs above 0.974. These models maintained competitive F1-scores and showed robustness across both internal and hold-out validations on Clinical Dataset I.
To assess the statistical significance of performance differences among models, we conducted pairwise DeLong's tests on their AUCs. Significant differences (p < .05) were observed between most model pairs, except for ResNet versus VGG (p = .686), AlexNet versus DiffTransformer (p = .286), AlexNet versus Transformer (p = .231), PatchTST versus ResPatchTST (p = .450), and ResPatchTST versus ResTransformer (p = .350). Notably, many of these non-significant pairs share similar architectural structures. For example, ResNet and VGG are both CNN-based models. PatchTST and ResPatchTST share a common structural foundation in the PatchTST design; while ResPatchTST and ResTransformer are hybrid models that combine ResNet components with Transformer-based architectures.
To further validate the clinical utility of our models for automated ABR threshold determination, we converted waveform-level predictions into ear-level ABR threshold estimates using a rule-based aggregation strategy. Specifically, to address cases with inconsistent outputs at the same intensity level or false positives at lower intensities, the threshold was defined as the lowest intensity at which the majority of waveforms were classified as ABR-present. Figure 6 presents the distribution of individual prediction errors for the ResPatchTST. When applied to the held-out test set, 2,588 out of 3,052 ears (84.80%) were correctly predicted, and 2,912 out of 3,052 ears (95.41%) were predicted within 10 dB of expert-labeled thresholds.

Distribution of absolute errors in auditory brainstem response (ABR) threshold prediction and corresponding cumulative accuracy for ResPatchTST. Each bar represents the number of ears at a given absolute prediction error level (in dB). Accuracy,
Performance Comparison of Models on Multicenter Datasets
Figure 7 summarizes the accuracy of various trained models evaluated on multicenter datasets: Clinical Dataset I, Clinical Dataset II, Southampton Dataset, PhysioNet Dataset, and Mendeley Dataset. Notably, the results for Clinical Dataset I were computed on a held-out test set that was completely independent of the training process.

Forest plots for accuracies of various models externally evaluated on multicenter datasets: Clinical Dataset I, Clinical Dataset II, Southampton, PhysioNet, and Mendeley Datasets. Bold values indicate the best result for each dataset.
CNN-based models, including AlexNet, VGG, and ResNet, achieved strong performance on Clinical Dataset I (89.60%–91.47%) and Southampton Dataset (90.28%–95.83%), and performed adequately on Clinical Dataset II (87.84%–89.69%). However, their accuracies declined significantly on the Mendeley Dataset (80.00%–85.26%). Performance on the PhysioNet Dataset varied, with accuracies ranging from 87.50% to 93.75%.
Transformer-based models (e.g., Transformer, PatchTST, DiffTransformer, and DiffPatchTST) demonstrated superior generalization to external datasets despite not achieving the highest accuracy on Clinical Dataset I. Among these, PatchTST exhibited the most robust performance, with accuracies of 90.55% on Clinical Dataset I, 88.90% on Clinical Dataset II, 95.83% on Southampton Dataset, 92.31% on PhysioNet, and 89.47% on Mendeley Dataset. Transformer performed worse than PatchTST on Clinical Datasets I and II and the Southampton Dataset, but outperformed PatchTST on PhysioNet and achieved comparable results on the Mendeley Dataset. DiffTransformer excelled on the Mendeley Dataset, achieving the highest accuracy (90.53%) among all models.
Hybrid models, such as ResTransformer and ResPatchTST, combined CNN and Transformer architectures, showing improved performance on Clinical Datasets I and II compared to their individual components but struggling with generalization to the Mendeley Dataset. Specifically, ResPatchTST achieved the highest accuracy on Clinical Dataset I (91.90%) and demonstrated strong generalization to Clinical Dataset II (90.34%), Southampton Dataset (94.44%), and PhysioNet Dataset (92.31%). However, its performance on Mendeley Dataset was notably lower (81.05%), highlighting limitations in handling highly heterogeneous datasets. ResTransformer exhibited consistently lower performance than ResPatchTST across all datasets. Overall, the results emphasize the importance of both data diversity and architecture adaptability in achieving robust generalization across diverse clinical datasets.
Generalization Analysis on Data Size and Diversity
This section presents experiments analyzing the impact of training data volume and diversity on DL models’ generalization performance. PatchTST was selected for these experiments due to its robust generalization capabilities across multicenter datasets.
Figure 8 illustrates how accuracy and AUC change with larger training set. Both metrics improved rapidly across all three testing methods as the training set size increased, converging beyond a knee point (typically around 8,000 individuals). Beyond this threshold, the growth in accuracy and AUC slowed down. These results indicate that larger training datasets enhance the model's performance, though the rate of improvement diminishes beyond certain thresholds.
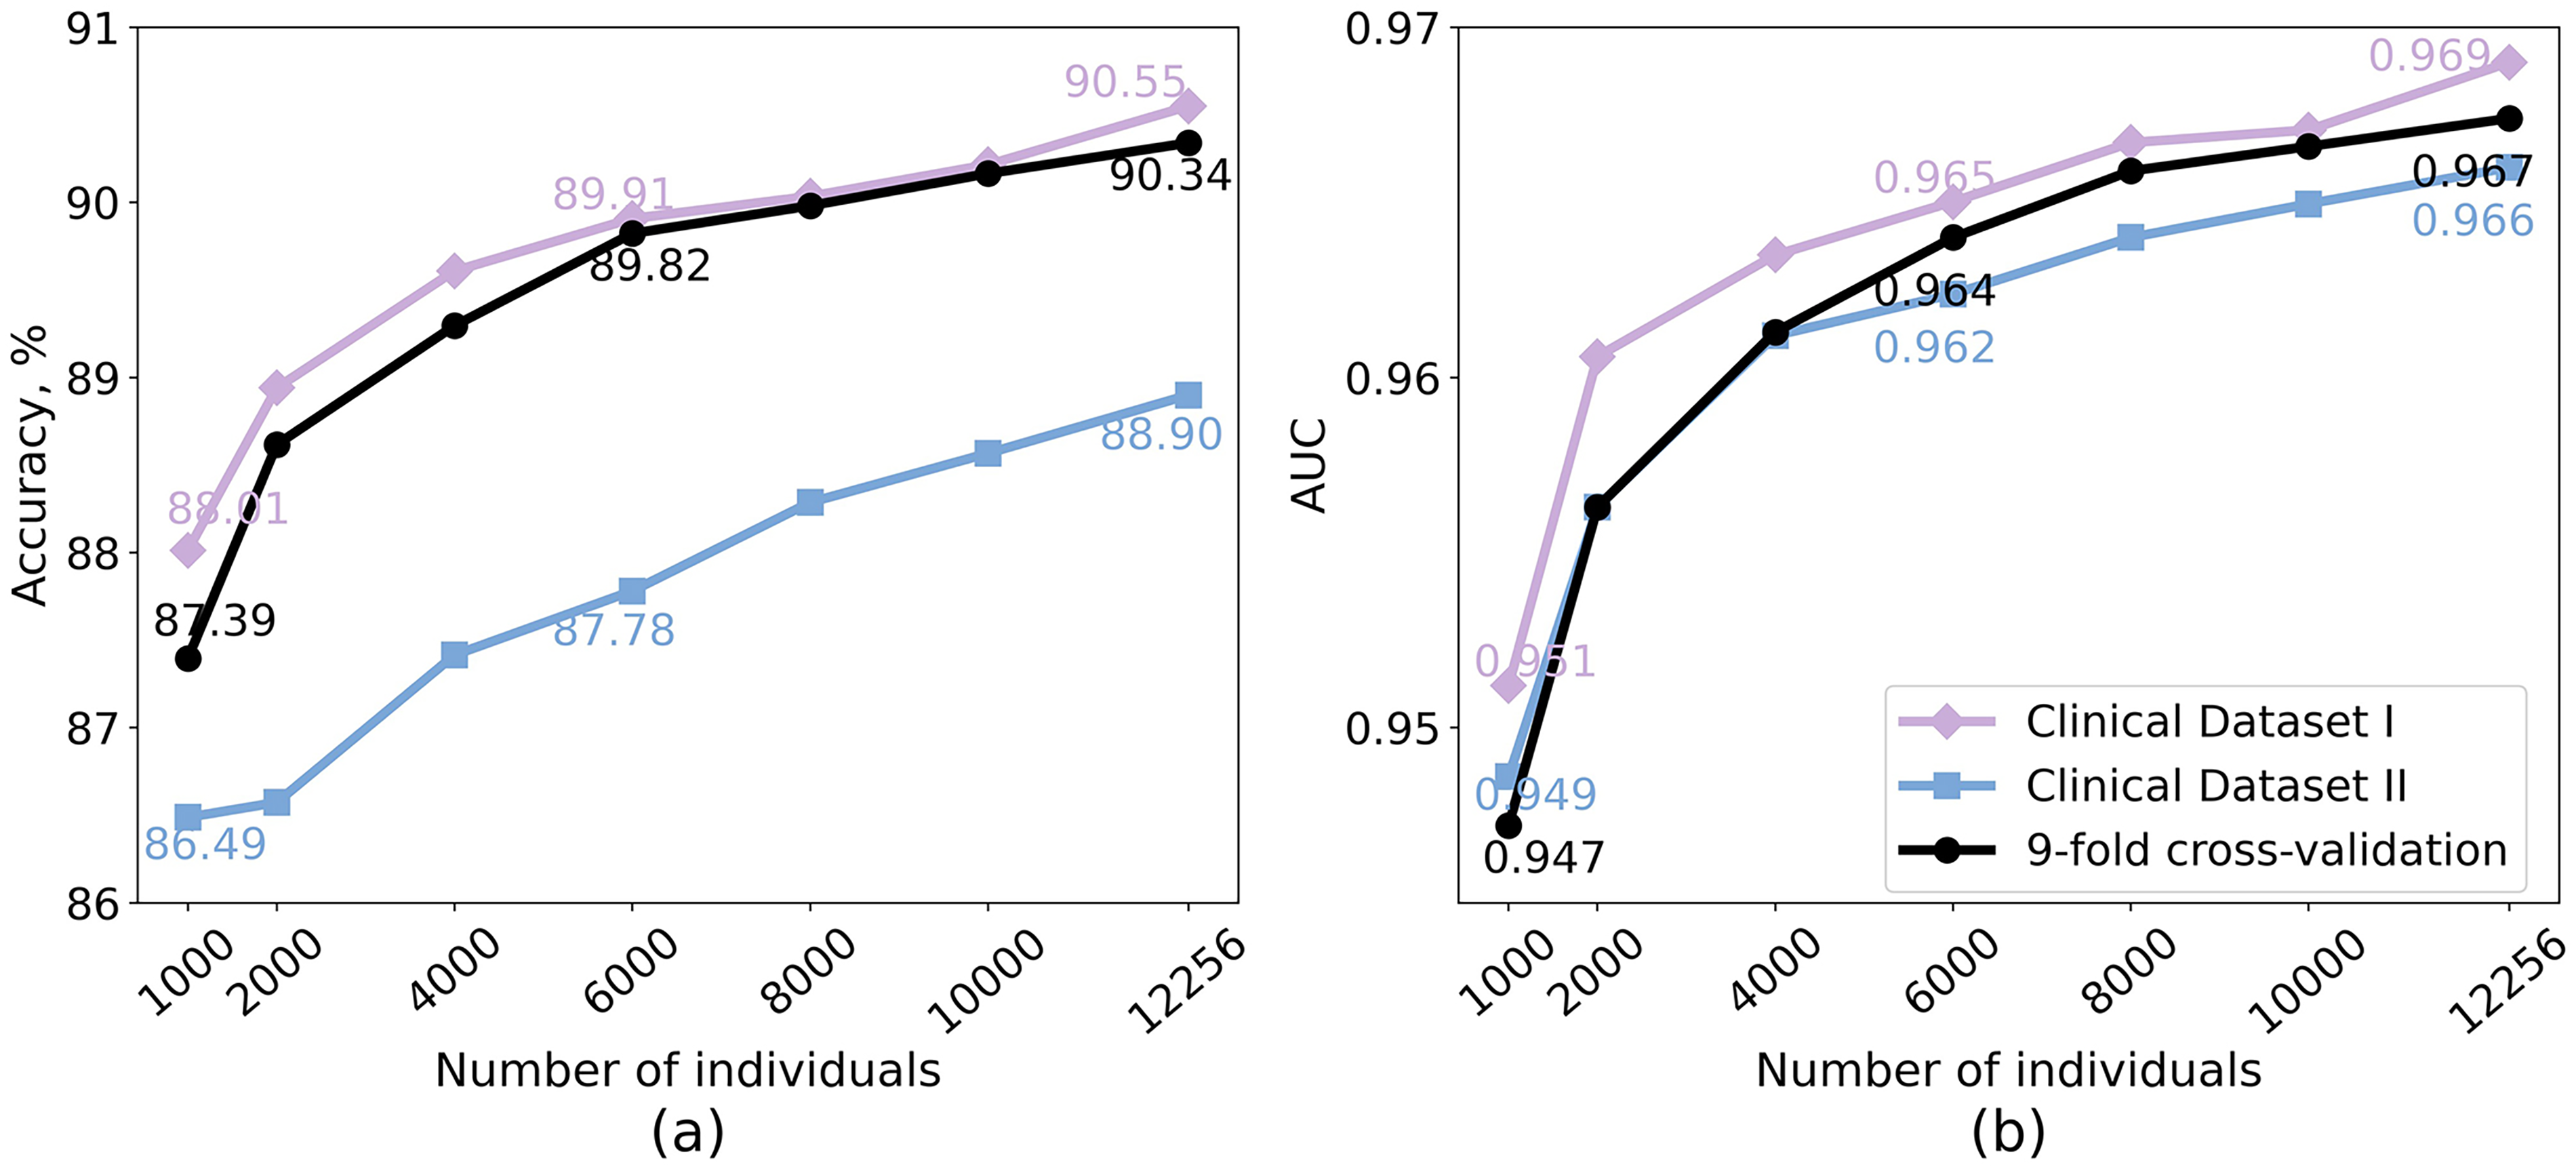
Impact of training dataset size on the generalization performance of PatchTST. The model is retrained on subsets randomly sampled from the full training dataset (12,256 individuals) and validated using 9-fold cross-validation on the training set, as well as on the held-out test set from Clinical Dataset I and the Independent Clinical Dataset II. (a) Accuracy; (b) AUC. Note. AUC = area under the receiver operating characteristic curve; PatchTST = patch time series transformer.
As shown in Figure 9, models trained on age-restricted data consistently exhibited reduced generalization to other age groups compared to their mixed-age counterparts. The infant-trained model achieved an overall accuracy of 83.54% and an AUC of 0.915 across unseen age groups, notably lower than the 87.34% accuracy and 0.954 AUC obtained with a mixed-age subset of equal size (p < .001 for the AUC values). Although it performed reasonably well on children (accuracy: 88.17%, AUC: 0.952), its performance dropped substantially on adults (accuracy: 78.83%, AUC: 0.866) and the elderly (accuracy: 73.97%, AUC: 0.823) compared to the mixed-age model, with all AUC differences being statistically significant (p < .001). The child-trained model generalized well to infants (accuracy: 92.46%, AUC: 0.978) and performed adequately on adults (accuracy: 85.95%, AUC: 0.940) and elderly groups (accuracy: 83.89%, AUC: 0.931), achieving an overall accuracy of 87.13% and AUC of 0.949—still consistently lower than the corresponding mixed-age model (p < .001), except for the comparison with the infant group (p = .283). The adult-trained model showed relatively stable generalization across age groups (accuracy: 86.13%–89.01%, AUC: 0.946–0.960) and even slightly outperformed the mixed-age model on elderly data. Nevertheless, its overall accuracy (88.53%) and AUC (0.955) remained lower than the mixed-age baseline (accuracy: 90.37%, AUC: 0.970, p < .001). In contrast, the elderly-trained model exhibited limited generalization, particularly to infants (accuracy: 80.27%; AUC: 0.908), with an overall accuracy of 83.90% and AUC of 0.918, much lower than the 87.64% accuracy and 0.952 AUC obtained with the mixed-age model (p < .001). These findings highlight the importance of diverse, age-varied datasets for training generalizable DL models.
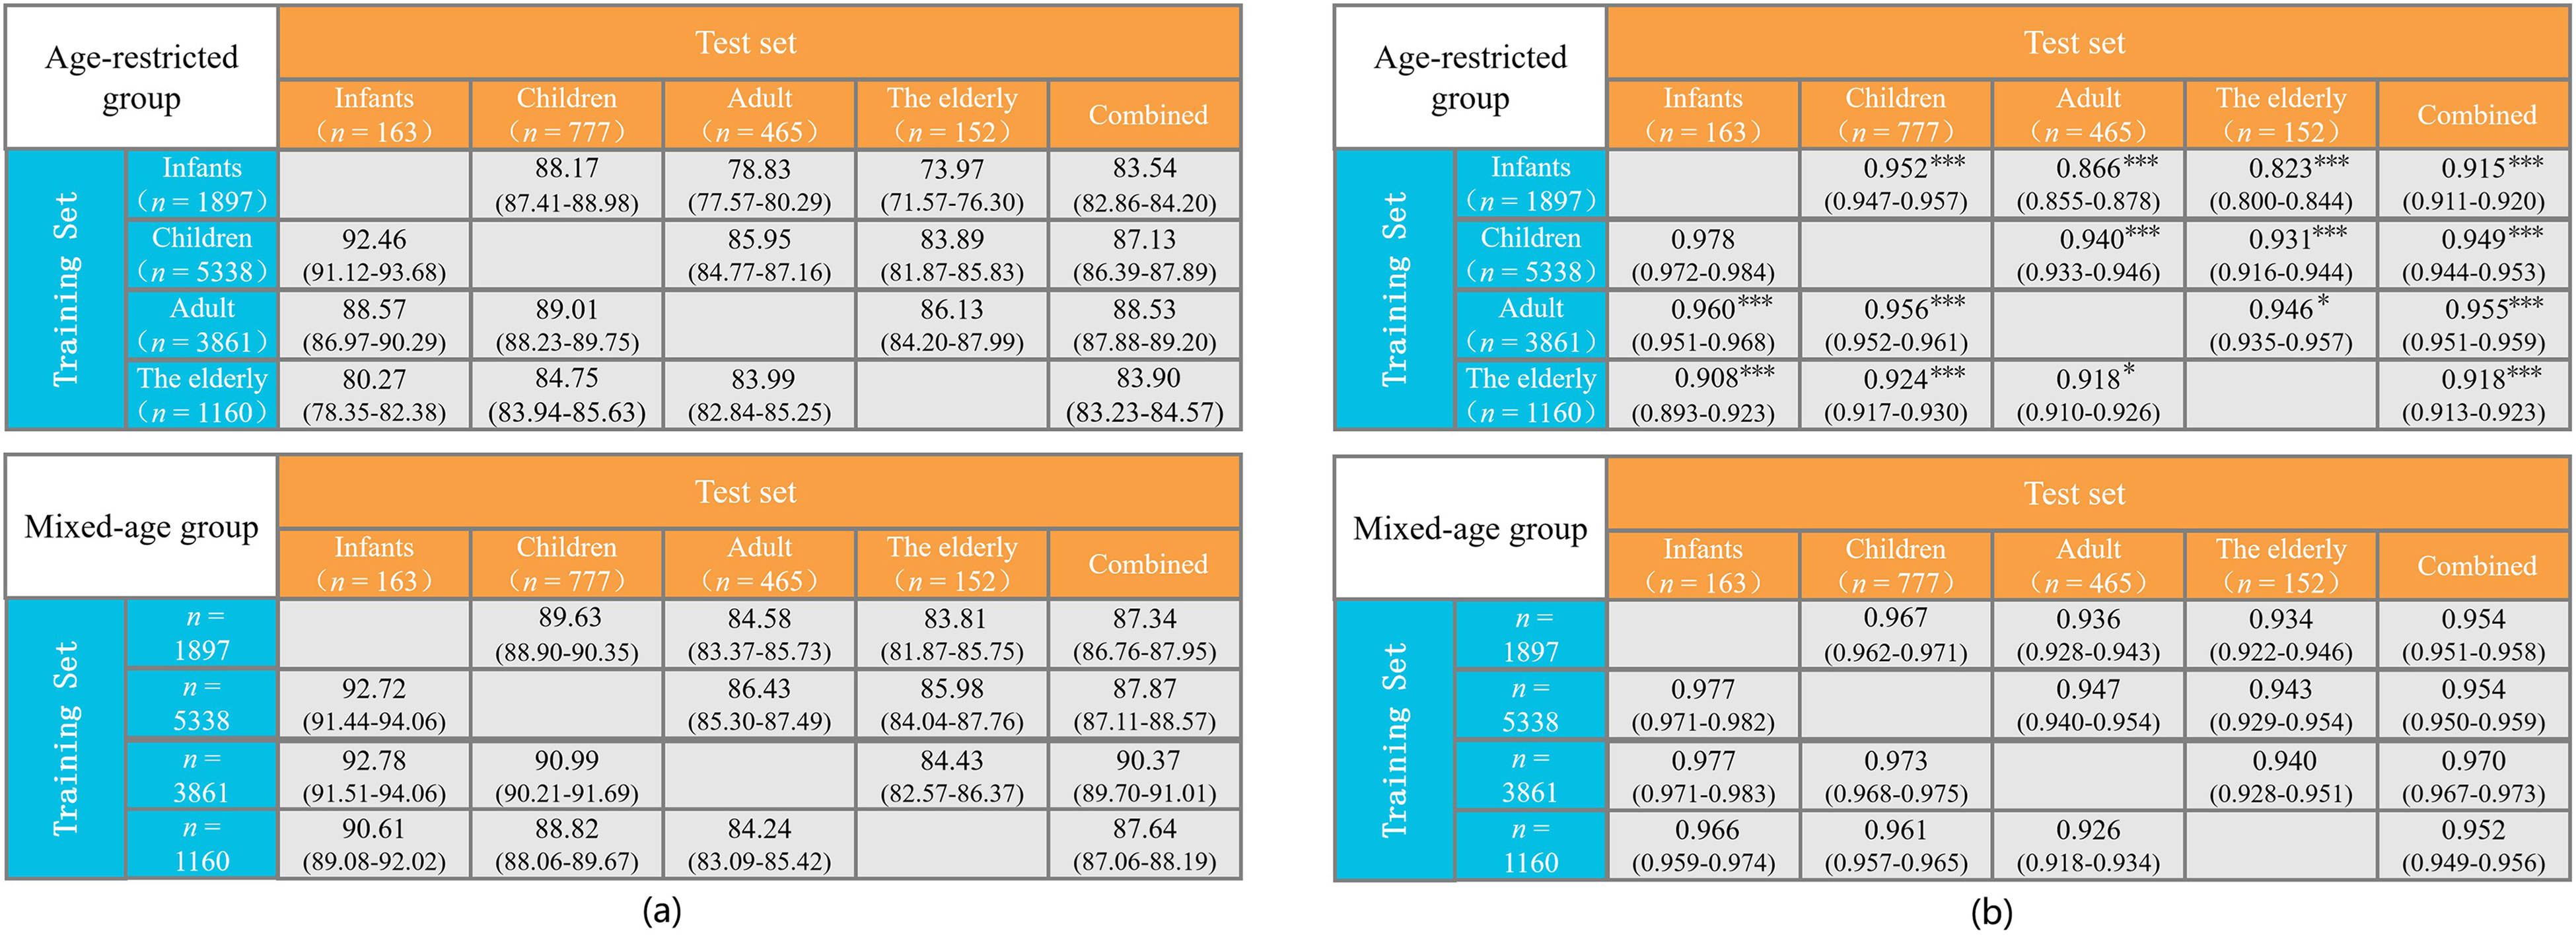
Generalization performance of PatchTST trained on age-restricted groups compared to mixed-age groups of equal size. The upper panel illustrates the model's performance when trained on data from a single age group and validated on unseen age groups both individually and collectively. The lower panel shows the corresponding performance metrics when the model is trained on a mixed-age dataset of equivalent size. (a) Accuracy; (b) AUC. In both panels, n represents the number of subjects. Statistical significance of AUC differences was evaluated using DeLong's test: *p < .05, **p < .01, ***p < .001. Note. AUC = area under the receiver operating characteristic curve; PatchTST = patch time series transformer.
As shown in Figure 10, models trained on restricted hearing groups exhibited a decline in generalization when evaluated on unseen hearing categories. The NH-trained model achieved 84.98% accuracy and an AUC of 0.934 on HL samples—both lower than those of the matched mixed-hearing model (accuracy: 86.60%, AUC: 0.947), with the AUC difference being statistically significant (p < .001). A similar trend was observed in the reverse setting: the model trained on HL data yielded 89.08% accuracy and 0.958 AUC on NH samples, slightly below the mixed-hearing model (accuracy: 89.22%, AUC: 0.961; p < .05). Overall, the mixed-hearing models consistently outperformed those trained on hearing-status-restricted groups, suggesting that incorporating a wider range of hearing profiles—particularly those with greater waveform variability as seen in HL patients—helps the model better generalize across hearing populations.

Generalization performance of PatchTST trained on hearing-status-restricted groups versus mixed-hearing-status groups of equal size. The upper panel shows performance when trained on either individuals with NH or HL and validated on the opposite group. The lower panel presents performance when trained on a mixed-hearing-status dataset of the same size. (a) Accuracy; (b) AUC. Statistical significance of AUC differences was evaluated using DeLong’s test: *p < .05, **p < .01, ***p < .001. Note. AUC = area under the receiver operating characteristic curve; PatchTST = patch time series transformer; NH = normal hearing; HL = hearing loss
Generalization Analysis on Acquisition Parameters and Patient Demographics
Table 2 presents the performance of the PatchTST model trained on ABR raw signals alone and in combination with acquisition parameters (e.g., stimulus rate, stimulus intensity, and epochs) or patient demographic features (e.g., age, and gender), evaluated on Clinical Datasets I and II. To integrate these additional variables, the deep features extracted by PatchTST from ABR waveforms were first compressed via a pooling layer, which were then concatenated with auxiliary variables and passed to the final classifier. The pairwise DeLong's test was applied to compare the AUCs of models with and without additional variables.
Performance of PatchTST Model Trained on ABR raw Signals Alone and in Combination with Acquisition Parameters or Patient Demographic Factors, Evaluated on Clinical Datasets I and II.

Note. Results are reported as mean (95% confidence interval) for accuracy (%) and AUC. Arrows indicate performance change relative to the baseline model trained on raw ABR signals alone (↑ improved, ↓ decreased, → unchanged). Statistical significance of AUC differences was evaluated using DeLong's test: *p < .05, **p < .01, ***p < .001. ABR = auditory brainstem response; AUC = area under the receiver operating characteristic curve.
The baseline model, trained solely on raw ABR signals, achieved an accuracy of 90.23% and an AUC of 0.967 on Clinical Dataset I, and 87.87% accuracy with 0.964 AUC on the independent Clinical Dataset II. Adding individual variables such as age, epochs led to moderate performance improvements, with significant AUC gains on Clinical Dataset I (p < .001 for age, p < .01 for epochs) and, for age also on Clinical Dataset II (p < .01). Among all single-variable settings, stimulus intensity produced the greatest improvement on Clinical Dataset I—achieving 91.24% accuracy and 0.974 AUC on Clinical Dataset I (p < .001). In contrast, gender and stimulus rate did not result in consistent improvements across datasets, with gender yielding a marginal but significant AUC increase on Clinical Dataset I (p < .05), and stimulus rate showing no improvement. Feature combinations further boosted model performance. The integration of stimulus intensity and epochs yielded substantial gains in test accuracy, with the AUC on Clinical Dataset I significantly surpassing the baseline (p < .001). The best overall performance was achieved by combining age, epochs, and stimulus intensity, reaching 90.99% accuracy and 0.972 AUC on Clinical Dataset I (p < .001), and 90.48% accuracy and 0.966 AUC on Clinical Dataset II (p < .05). The performance gains—especially those observed on Clinical Dataset II—indicate that incorporating acquisition parameters and patient demographic variables effectively reduces cross-center distribution shifts, thereby enhancing the robustness and generalizability of DL-based ABR interpretation systems in clinical settings.
Discussion
While DL algorithms have proven useful in objectifying ABR detection in controlled settings (Liang et al., 2024; McKearney & MacKinnon, 2019; McKearney et al., 2022), their ability to generalize to real-world clinical data remains uncertain due to limitations such as small dataset sizes, insufficient data heterogeneity, and a lack of external validation. This study addresses these challenges by conducting the first multicenter validation of DL methods for ABR detection, utilizing a large and diverse clinical dataset comprising 13,813 participants across various age groups and degrees of hearing loss. In addition, our evaluation spans multiple datasets from different centers, each exhibiting considerable data heterogeneity due to variations in recording factors such as equipment, electrode placement, stimulus types, sampling rates, filtering ranges, and intensity levels, as well as individual characteristics like age, sex, hearing status, and differences in expert labeling (see details in Table 1). These variations across datasets pose challenges for model generalization (Eggermont et al., 1996; Hall, 2007; Zakaria et al., 2019) but also allow for a robust evaluation of the models’ generalizability in real clinical settings, as they reflect the inherent variability found in clinical practice.
The performance comparison of different DL models reveals their strengths and limitations in ABR detection. Hold-out validation on Clinical Dataset I, independent of the training process, provides an unbiased assessment of model performance. Our findings demonstrate the effectiveness of several DL models in detecting ABR (e.g., VGG, ResNet, PatchTST, DiffPatchTST), with hybrid models such as ResPatchTST and ResTransformer showing the strongest overall performance. These hybrid models combine the strengths of CNN for capturing local temporal information with Transformer architectures for modeling long-term temporal dependencies. Notably, ResPatchTST achieves the highest accuracy (91.90%), AUC (0.976), specificity (92.93%), sensitivity (90.89%), and F1-score (0.919), indicating its robustness across multiple metrics. Other models, such as ResNet, VGG, and ResTransformer, also perform competitively, maintaining accuracies above 91.43% and AUCs exceeding 0.974, with balanced F1-scores and specificity-sensitivity metrics.
Although the held-out test set was not used for model training, its similar distribution to the training set limits its capacity to fully reflect the challenges of data heterogeneity encountered in real clinical settings. Multicenter validation reveals significant performance variability across datasets, primarily driven by differences in demographics, equipment, and ABR acquisition parameters. CNN-based models achieve high accuracies on Clinical Dataset I (over 89.60%) and Southampton Dataset (90.28–95.83%), with the latter exceeding the interobserver agreement rates among audiologists (93.1–94.4%; see Table I-2 in SDC). However, their performance declines substantially on the Mendeley Dataset (80–85.26%), likely due to higher data variability, where inconsistent expert labeling is also observed, as reflected in the broader interobserver agreement range (87.37–98.95%; see Table III-2 in SDC). In contrast, Transformer-based models show superior generalization to external datasets. Among these, PatchTST maintains reasonable accuracies across all datasets without substantial drops, achieving 95.83% accuracy on the Southampton Dataset, surpassing expert labeling agreements. Notably, DiffTransformer attains 90.53% accuracy on the challenging Mendeley Dataset, exceeding or matching agreement rates in 7 out of 15 audiologist pairs (detailed in Table III-2 in SDC). This suggests that attention mechanisms in transformers may be better suited for capturing complex temporal dependencies and handling cross-center ABR signal variations. Hybrid models (e.g., ResPatchTST) consistently outperform others on Clinical Dataset I and generalize well to Clinical Dataset II, Southampton, and PhysioNet Datasets. However, their performance declines significantly on Mendeley, indicating potential limitations in handling small, highly heterogeneous datasets. This emphasizes the need for incorporating greater size and diversity in the training dataset to enhance the generalizability of hybrid models.
Another important finding on cross-center validation is that our models trained on click (broadband stimuli)-evoked ABRs demonstrated reasonable generalization to frequency-specific ABR data evoked by 1 and 4 kHz tone pips in the PhysioNet dataset, achieving accuracies of over 93.75% when using DiffTransformer, AlexNet, and Transformer models. This suggests that the models may capture universal features of ABR waveforms that are applicable across different stimulus types. While the current results are promising, further validation on datasets with diverse stimuli (e.g., tone bursts, chirps) is necessary to fully assess the models’ generalizability in frequency-specific diagnostic applications.
In addition to selecting an appropriate DL architecture for ABR detection, the model's generalization depends on the size and diversity of the training datasets. Our experiments highlight the critical role of both factors in enhancing the performance and robustness of DL models. Larger training datasets generally improve performance on unseen data, with the most significant gains observed when training on smaller datasets. However, the rate of improvement diminishes once a certain threshold is reached. These findings provide a valuable recommendation for researchers: Sufficient training data should be included to unlock the full potential of DL models for ABR detection. Additionally, training on datasets with diverse age groups and hearing statuses significantly enhances generalization, as models trained on mixed datasets outperform those trained on age- or hearing-status-restricted data. These emphasize the importance of including diverse training data that reflects the variety of conditions likely to be encountered in clinical practice. Together, these findings underscore that large and diverse training datasets are essential for developing DL models capable of handling real-world variability, offering valuable insights for building generalizable DL models for clinical applications.
Summary of ABR Detection Studies for the Purpose of Threshold Estimation.

Note. “–” indicates information not reported in that study. ABR = auditory brainstem response; ML = machine learning; DL = deep learning; DCT = discrete cosine transform; DWT = discrete wavelet transform; ANN = artificial neural network; SVM = support vector machine; AUC = area under the receiver operating characteristic curve; NB = naive Bayes; CNN-LSTM = convolutional long short-term memory; RF = random forest; BN = batch normalization.
The clinical relevance of our proposed model is further supported by its strong performance in ABR threshold estimation. As shown in Figure 6, ResPatchTST demonstrates high consistency with expert-labeled thresholds, with over 95% of predictions falling within a 10 dB error margin. Notably, ABR threshold determination in clinical practice inherently involves a degree of ambiguity—some definitions allow for thresholds to be set at intensities yielding “inconclusive responses” (McKearney & MacKinnon, 2019). In this context, the model's ability to maintain such a high level of agreement underscores its robustness at near-threshold levels and demonstrates its potential for reliable clinical deployment.
By automating this process, the models can help standardize performance among experts with varying experience levels and reduce workloads for clinicians handling high volumes of ABR recordings, thereby facilitating better estimation of hearing thresholds across diverse clinical settings. Moreover, these models hold significant potential for reducing healthcare disparities in remote and underserved areas, where access to audiological expertise may be limited or unavailable.
Limitations
This study has two primary limitations. First, the proposed DL models detect the ABR based on single waveforms, offering potential for real-time detection as discussed previously. However, this approach neglects the sequential relationships between waveforms, which are crucial for accurate ABR detection, especially at lower stimulus intensities where such contextual information becomes critical. Incorporating interwaveform correlations likely improves detection performance but would necessitate predefined testing intensities, increasing the complexity and duration of the process. Future research should aim to balance improved detection accuracy with the need for real-time processing and efficient testing workflows, exploring methods to optimize this trade-off.
Second, although several DL models have demonstrate reasonable generalization across multicenter datasets, the variability in data acquisition conditions and patient characteristics remains a significant challenge. Differences in equipment, recording protocols, and patient demographics can affect model performance, emphasizing the need for a more robust foundational model that explicitly accounts for such variability. To address this, future efforts should focus on training with more heterogeneous datasets that reflect the diverse clinical scenarios encountered in practice. This approach would enhance the models’ adaptability and reliability across a broader range of clinical settings.
Conclusions
This study represents the first multicenter validation of DL methods for automated ABR detection. By utilizing large and diverse multicenter datasets, we have demonstrated the effectiveness of various DL models, particularly Transformer-based architectures, in handling the complexities and variability of real-world clinical data. The results highlight the importance of training on large, heterogeneous datasets covering diverse ages, hearing statuses, and acquisition conditions to improve model generalization. The proposed DL models show promise for streamlining ABR detection, improving testing efficiency, and reducing interobserver variability, which may aid ABR interpretation for estimating hearing thresholds in a clinical context. Future work should focus on integrating sequential waveform relationships and further addressing dataset variability to optimize these models for broader clinical applications.
Supplemental Material
sj-docx-1-tia-10.1177_23312165251347773 - Supplemental material for Comparison of Deep Learning Models for Objective Auditory Brainstem Response Detection: A Multicenter Validation Study
Supplemental material, sj-docx-1-tia-10.1177_23312165251347773 for Comparison of Deep Learning Models for Objective Auditory Brainstem Response Detection: A Multicenter Validation Study by Yin Liu, Lingjie Xiang, Qiang Li, Kangkang Li, Yihan Yang, Tiantian Wang, Yuting Qin, Xinxing Fu, Yu Zhao and Chenqiang Gao in Trends in Hearing
Footnotes
Acknowledgments
The authors thank the Department of Otorhinolaryngology & Hearing and Speech Rehabilitation, the First Affiliated Hospital of Chongqing Medical University for providing the Clinical Dataset II.
Ethical Considerations
This study was approved by the Human Research Ethics Committee of Beijing Tongren Hospital, Capital Medical University (TRECKY2019-090).
Consent to Participate
Informed consent was waived.
Author Contribution(s)
Yin Liu and Xinxing Fu designed and performed experiments; Kangkang Li and Yihan Yang collected data; Yin Liu, Lingjie Xiang, Qiang Li, Tiantian Wang, and Yuting Qin analyzed data; Yin Liu, Lingjie Xiang, and Yu Zhao provided statistical analysis; Yin Liu wrote the paper; Xinxing Fu and Chenqiang Gao provided critical revision. All authors approved the submitted version.
Funding
The authors disclosed receipt of the following financial support for the research, authorship, and/or publication of this article: This work was supported by National Key Research and Development Program of China, National Natural Science Foundation of China, Natural Science Foundation of Chongqing, China, Science and Technology Research Program of Chongqing Municipal Education Commission (grant number 2022YFA1004100, 62301096,CSTB2023NSCQ-MSX0659, cstc2021jcyj-bshX0206, KJQN202400632).
Declaration of Conflicting Interests
The authors declared no potential conflicts of interest with respect to the research, authorship, and/or publication of this article.
Data Availability Statements
Clinical Datasets I and II are not publicly available due to privacy concerns regarding the subjects. Southampton Dataset is available at http://doi.org/10.5258/SOTON/D0168. PhysioNet Dataset is available at https://physionet.org/content/earndb/1.0.0/. Mendeley Dataset is available at https://data.mendeley.com/datasets/4yb9772dff/1.
Supplemental material
Supplemental material for this article is available online.
References
Supplementary Material
Please find the following supplemental material available below.
For Open Access articles published under a Creative Commons License, all supplemental material carries the same license as the article it is associated with.
For non-Open Access articles published, all supplemental material carries a non-exclusive license, and permission requests for re-use of supplemental material or any part of supplemental material shall be sent directly to the copyright owner as specified in the copyright notice associated with the article.