
Abstract
Understanding the initial signature of noise-induced auditory damage remains a significant priority. Animal models suggest the cochlear base is particularly vulnerable to noise, raising the possibility that early-stage noise exposure could be linked to basal cochlear dysfunction, even when thresholds at 0.25–8 kHz are normal. To investigate this in humans, we conducted a meta-analysis following a systematic review, examining the association between noise exposure and hearing in frequencies from 9 to 20 kHz as a marker for basal cochlear dysfunction. Systematic review and meta-analysis followed PRISMA guidelines and the PICOS framework. Studies on noise exposure and hearing in the 9 to 20 kHz region in adults with clinically normal audiograms were included by searching five electronic databases (e.g., PubMed). Cohorts from 30 studies, comprising approximately 2,500 participants, were systematically reviewed. Meta-analysis was conducted on 23 studies using a random-effects model for occupational and recreational noise exposure. Analysis showed a significant positive association between occupational noise and hearing thresholds, with medium effect sizes at 9 and 11.2 kHz and large effect sizes at 10, 12, 14, and 16 kHz. However, the association with recreational noise was less consistent, with significant effects only at 12, 12.5, and 16 kHz. Egger's test indicated some publication bias, specifically at 10 kHz. Findings suggest thresholds above 8 kHz may indicate early noise exposure effects, even when lower-frequency (≤8 kHz) thresholds remain normal. Longitudinal studies incorporating noise dosimetry are crucial to establish causality and further support the clinical utility of extended high-frequency testing.
Keywords
Introduction
Understanding the initial signature of noise-induced hearing loss (NIHL) that can be easily identified in humans is crucial. NIHL is one of the most prevalent and preventable causes of hearing impairment worldwide (Nelson et al., 2005). NIHL affects approximately 5% of the population (Daniel, 2007; Oishi & Schacht, 2011), and the World Health Organization estimates that 1.1 billion young individuals are at risk due to unsafe listening practices, particularly in recreational settings (WHO, 2018).
Noise exposure over prolonged periods, whether occupational or recreational, can lead to both temporary and permanent hearing threshold shifts (Carter et al., 2014; Miller, 1974; Ylikoski & Ylikoski, 1994). However, temporary threshold shifts may not necessarily predict permanent hearing damage (Themann et al., 2015). While the mechanisms of noise-induced damage are well-established through animal models and human temporal bone studies (Kujawa & Liberman, 2009; Nicotera et al., 2003), the initial site of damage in humans—whether outer hair cells or synaptic structures—remains debated (Kujawa & Liberman, 2009; Nicotera et al., 2003). Nevertheless, animal models consistently show that the basal region of the cochlea is particularly vulnerable to noise exposure, regardless of frequency content of the noise (Fettiplace & Nam, 2019; Liberman & Kiang, 1978). This suggests that noise exposure could affect hearing sensitivity at frequencies corresponding to the basal cochlear regions, such as frequencies above 8 kHz—known as extended high frequencies (EHFs)—even when clinical audiograms appear normal (Lough & Plack, 2022; Škerková et al., 2021).
Some evidence supports the possibility of using EHF hearing as an early marker for auditory damage. NIHL typically manifests as elevated hearing thresholds in a “notched” pattern at 4 kHz or occasionally at 3 or 6 kHz in the audiogram (ACOEM, 2003; McBride & Williams, 2001; Salmivalli, 1967). Interestingly, Wei et al. (2017) reported a strong association between EHF hearing threshold shift and the audiometric notch at 3, 4, or 6 kHz, suggesting that EHF threshold shifts might precede the appearance of audiometric notches. Elevated EHF hearing thresholds, even in individuals with normal audiograms, may indicate subclinical cochlear damage. Individuals with elevated EHF thresholds exhibit higher thresholds in standard frequencies (Mishra et al., 2022; Zadeh et al., 2019), reduced otoacoustic emissions in frequencies below 8 kHz (Mishra et al., 2024), broader cochlear filters at 2 kHz (Badri et al., 2011), and poorer frequency discrimination at 4 kHz (Mishra et al., 2023). These findings suggest that EHF threshold shifts might precede the appearance of audiometric notches, indicating early subclinical damage. Additionally, others have speculated that EHF hearing loss could suggest noise-induced cochlear synaptopathy in lower frequencies, although the evidence in humans remains tenuous (Bharadwaj et al., 2019; Liberman et al., 2016).
The value of testing hearing sensitivity at EHFs has gained increasing attention, particularly in the context of various auditory disorders, including tinnitus (Jafari et al., 2022) and cochlear damage (Lough & Plack, 2022). Several studies have highlighted the relevance of EHF testing in detecting subtle auditory deficits that may not be captured by conventional audiometry (0.25–8 kHz), especially in individuals with NIHL (Amir Houshang et al., 2018; Elmazoska et al., 2024). However, most reviews have focused on individuals with abnormal thresholds in the standard audiometric range, leaving a critical gap in our understanding of the effect of noise exposure on EHF thresholds in individuals with clinically normal audiograms.
This gap is particularly important because noise exposure can cause cochlear damage that may not be immediately detectable through a standard audiogram. The cochlear base, which is particularly vulnerable to high-frequency noise damage (Fettiplace & Nam, 2019; Liberman & Kiang, 1978), may exhibit early signs of hearing deficits at EHFs, even when standard audiograms remain normal. If individuals with noise exposure show elevated EHF thresholds without corresponding changes in their conventional audiogram, it would suggest that EHF audiometry offers a more sensitive and earlier indicator of cochlear damage. Such early detection could enable targeted interventions and preventive strategies before overt hearing loss or the characteristic “3–6 kHz notch” typically associated with NIHL becomes evident in the audiogram. If, however, noise-induced threshold shifts are already observable in standard audiometry, the utility of EHF testing as an early marker of NIHL becomes diminished, as the damage has already progressed to clinically detectable levels. Thus, the primary benefit of EHF audiometry lies in its ability to detect subtle cochlear changes in the early stages of noise exposure, providing a window for early intervention before conventional audiometric indicators of NIHL emerge.
The present study represents the first systematic review and meta-analysis to investigate the association between noise exposure and EHF hearing thresholds in individuals with clinically normal audiograms. A meta-analysis, following a systematic review, was conducted to examine the hypothesis that noise exposure is associated with basal cochlear damage in individuals with normal audiogram. Hearing thresholds at EHFs were used as a measure of basal cochlear functioning. Although otoacoustic emissions measured at EHFs provide an alternative physiologic measure of basal cochlear function, very few studies measured emissions at EHFs in noise-exposed sample (Bhatt et al., 2022; Bhatt & Wang, 2019; Narahari et al., 2017). Since the extent of noise-induced damage depends on both the intensity and spectral composition of noise exposure (Boger et al., 2009; Hamernik et al., 2003; Neitzel & Fligor, 2019), the analysis was stratified into occupational and recreational noise categories to systematically account for these differences. Moreover, occupational noise exposure may have a more detrimental impact on hearing than recreational noise, even when the overall energy levels are equivalent (Neitzel & Fligor, 2019). Meta-analysis is a robust statistical approach that synthesizes findings from multiple independent studies, potentially offering the highest level of scientific evidence (Berlin & Golub, 2014; Gopalakrishnan & Ganeshkumar, 2013). By pooling data across studies, meta-analysis enhances overall statistical power, allowing for more precise and comprehensive estimates of effect size (Morris & DeShon, 2002). Moreover, it allows for the assessment of study quality, ensuring that findings from high-quality studies have a greater impact on the overall conclusions. It also helps resolve inconsistencies between individual studies, providing a more reliable and objective summary of the existing evidence base (Haidich, 2010).
Materials and Methods
The study followed the Meta-analysis of Observational Studies in Epidemiology (MOOSE) guidelines (Stroup et al., 2000) and Cochrane's Handbook (Higgins & Green, 2011). The study was registered in PROSPERO (Regd No: CRD42024599212).
Search Strategy
The search followed the Preferred Reporting Guidelines for Systematic Reviews and Meta-analysis (PRISMA guidelines) (Moher et al., 2015). The Participants, Intervention(s), Comparators, Outcomes, and Study Design (PICOS) framework was used to form the research question. The research question was designed to assess the association between recreational and occupational noise exposure and EHF thresholds among individuals with normal hearing in the SF range. The comprehensive search strategy used keywords related to the study aim using appropriate Boolean operators. The keywords were: EHF hearing loss, noise-induced hearing loss, cochlear damage, cochlear synaptopathy, hidden hearing loss, occupational noise exposure, recreational noise exposure, EHF audiometry, EHF, ultra-high frequency, 9, 10, 11.2, 12, 12.5, 14, 16, and 18 kHz. The derivatives of these words were used with the usage of appropriate Boolean operators (i.e., AND, OR, and NOT). The search process was completed using five databases: Google Scholar, PubMed, Science Direct, Web of Science, and Semantic Scholar. All articles that were published between 2000 to 2024 (August) and written in English language were retrieved from the various databases and imported into Rayyan software (Ouzzani et al., 2016) for initial processing and duplicate removal. To maintain feasibility and relevance, studies prior to 2000 were excluded. Including earlier studies would have significantly increased heterogeneity due to changes in measurement tools and reporting standards over time.
Inclusion and Exclusion Criteria
The inclusion criteria were established based on the PICOS framework. Studies reported in the English language that evaluated adult participants (up to 35 years) with noise exposure history and a clinically normal audiogram (i.e., hearing thresholds ≤ 25 dB HL at octave frequencies from 0.25 to 8 kHz) were included (P). There was no intervention (I) for this meta-analysis. For comparison (C), age-matched adults with clinically normal audiograms and no noise exposure history were used. The study designs (S) were cross-sectional, longitudinal, and case-control studies.
Additionally, the study topics could include occupational or recreational noise exposure, and all studies had to evaluate thresholds at individual EHFs. Many studies included other audiological tests; however, only EHF audiometry findings were considered for the purpose of this study. All interpretations made in this review are in reference to the findings of EHF thresholds.
Exclusion criteria removed studies that evaluated samples with hearing loss (>25 dB HL) at any of the standard frequencies. Studies that included participants above 35 years of age were excluded to eliminate the potential effect of ageing on EHF thresholds (Lee et al., 2012). However, relevant data from studies with participants aged 35 and older were extracted if they provided results for individuals under 35. Systematic reviews, books, meta-analyses, letters, commentaries, case studies, case series, and the studies done in animals were not included in this review.
Articles Selection
The study selection process involved title screening, abstract screening, and full-length screening using the inclusion and exclusion criteria listed. All screening was performed by two independent reviewers. Reviewers were blinded to the manuscript author and journal. Rayyan software was used to screen titles for relevance (Ouzzani et al., 2016). The reviewers completed the title screening independently using this software. Results were compared, and disagreements between the reviewers at the title screening stage were brought to a third reviewer and discussed. Initially, there was disagreement regarding the inclusion of two articles. However, following consultation with a third reviewer, all three reviewers reached a consensus to include these articles. After finalizing with title screening, all the selected articles were exported to Endnote software (Version 21.0.1) to perform abstract screening and full-length article screening. This was completed by two independent reviewers separately. Disagreements regarding the inclusion of full-length articles were discussed among the initial two reviewers. In cases of unresolved discrepancies, a third reviewer was consulted to finalize the article selection. After the collaborative discussion, all the reviewers reached consensus on the inclusion of the selected articles.
Data Extraction
A pre-piloted form was utilized to gather data from the articles that were selected for full-length inclusion. The extracted information included the authors’ name and the year of the study, the study aims, the study design and sample, the noise type, level and inventory used, hearing thresholds at 0.25–8 kHz, EHFs tested, and the primary outcome (Table 1). All studies were categorized based on the reported type of noise exposure to facilitate separate meta-analysis for recreational and occupational noise studies. Additionally, mean hearing threshold, standard deviation, and p-values at EHFs were also extracted for running meta-analysis.
Overview of Selected Studies for the Systematic Review (N = 30).

Note. Sample size included in the table shows the counts for participants (up to 35 years) with normal hearing thresholds in the 0.25–8 kHz region included in the metanalysis.
EHF = extended high frequency; PLDs = personal listening devices; SF = standard frequency (0.25–8 kHz).
Not significant (p > .05).
Statistical outcomes not reported.
Quality Assessment
The Crowe Critical Appraisal Tool (CCAT; Crowe et al., 2012) was used to assess the quality of the selected articles. This tool has been validated for reliability and applicability to various research designs (Crowe et al., 2011, 2012). The CCAT uses eight key aspects: preliminaries, introduction, design, sampling, data collection, ethical considerations, results/findings, and discussion to systematically evaluate each article. The tool assigns a score using a 6-point rating scale ranging from 0 to 5 for each category to produce a cumulative score with a maximum potential of 40. The higher the score, the better the quality of the article. All selected articles were rigorously analyzed based on key aspects of the CCAT framework, including research design, sampling methods, and data collection procedures. Scoring for each article was finalized through collaborative analysis and discussion between two reviewers.
Statistical Analysis of Evidence
Meta-analysis was performed using the R program (Chambers, 2008) (Version 2024.04.2) for the included studies. The R package “metafor” was used to run the meta-analysis (Viechtbauer, 2010).
The I-squared (I2) test was employed to evaluate the amount of heterogeneity among included studies (Higgins & Thompson, 2002). I2 statistics of 0%, 25%, 50%, and 75% indicate no, low, medium, and high heterogeneity, respectively (Higgins & Thompson, 2002). According to the Cochrane review guidelines, a random-effects model is recommended when I2 ≥ 50% (indicating high heterogeneity), while a fixed-effects model is appropriate for other values of I2 (Higgins & Thompson, 2002). In this review, the I2 values for every study were > 50%, warranting the use of random-effects models. Forest plots were utilized to display the pooled effect size estimates by standard mean difference (SMD) and 95% confidence intervals (CIs). A p-value less than 0.05 was considered the threshold for statistical significance.
SMD quantifies the effect size for each study relative to the variability observed. EHFs used for analysis were 9, 10, 11.2, 12, 12.5, 14, 16, and 18 kHz. The two groups (i.e., noise-exposed and control) were compared at each frequency, taking the average threshold of both ears at the given frequency. The Shapiro–Wilk test was used to check the normality assumption. For the frequencies that did not follow the normality assumption, bootstrap resampling was performed using the “boot” function in R (Canty, 2002). The effect sizes were computed using 10,000 bootstrap samples and Cohen's d (Kelley, 2005). The effect size is classified as small when the SMD is 0.2, medium when the SMD is 0.5, and large when the SMD is 0.8 (Cohen, 1988).
Publication bias could be a significant concern in the meta-analysis, potentially affecting the generalization of the conclusions. It is a tendency for studies with significant or positive findings to be accepted/published more frequently than studies with null findings (Rothstein et al., 2005). This bias can distort the findings of a meta-analysis because the available data may not represent the true distribution of all conducted research. As a result, the pooled effect estimate in a meta-analysis can be exaggerated, leading to misleading conclusions. Publication bias could not be assessed separately for different noise sources due to the limited number of studies available for each frequency. Consequently, it was evaluated across all studies included in the meta-analysis. Publication bias was assessed using funnel plots for each frequency separately. Funnel plots show effect sizes against a measure of its precision, such as the standard error. In the absence of publication bias, the plot resembles a symmetrical inverted funnel. Asymmetry in the funnel plot indicates potential publication bias. The funnel plot outcome was quantified using Egger's regression test (Egger et al., 1997), which examines the relationship between the effect size of each study and its standard error. A significant p-value indicates evidence of publication bias.
Results
Systematic Review
Figure 1 shows PRISMA flow diagram illustrating the summary of the literature search and screening process. A comprehensive search across predefined databases yielded 4,425 articles, with and without abstracts. Through a sequential pre-selection process, 1,136 articles were eliminated due to duplication, followed by the exclusion of 2,165 articles based on title screening and 401 articles through abstract screening. Subsequently, 123 articles were scrutinized, excluding 93 articles that failed to meet inclusion criteria due to various reasons, such as the inclusion of median value without mean value, hearing loss at standard audiometric frequencies, lack of noise exposure details, and others. The reference lists of all included studies were screened to ensure that no relevant studies were missed. Ultimately, 30 articles were deemed suitable for inclusion in the systematic review. Author details, study aim, design, hearing thresholds at standard audiometric frequencies, sample size, EHFs tested, noise exposure inventory, and primary outcome variable were extracted from these articles.

PRISMA flow diagram illustrating the literature search and screening process. The excluded records did not satisfy the inclusion criteria based on PICOS: participants, intervention(s), comparators, outcomes, and study designs. (PRISMA: preferred reporting items for systematic reviews and meta-analyses).
Characteristics of Included Studies
CCAT scores obtained for various aspects of included studies are presented in Table 2. The study design of the selected articles included case-control (n = 19), cross-sectional (n = 9), longitudinal (n = 1), and retrospective (n = 1) designs. The quality analysis result showed total scores ranging from 70% to 92.5% across the articles, indicating that the articles included in the review were of good quality.
Summary of Quality Analysis of the Included Studies Using the Crowe Critical Appraisal Tool (N = 30).

Not all included studies directly addressed the research question posed in this review. When the articles used other tests and included various age groups for comparison, EHF thresholds in the included age group range (up to 35 years) were extracted for this review. The noise exposure was recreational and occupational across studies. Noise exposure was recreational or occupational, with use of personal listening devices (PLDs) being the most common recreational source (e.g., Ismail et al., 2020; Silvestre et al., 2016; Sulaiman et al., 2014) and industrial noise being the most common occupational sources (e.g., Ahmed et al., 2001; Mehrparvar et al., 2014; Riga et al., 2010). To quantify noise exposure, 7 of the 30 articles employed noise dosimeters, providing precise measurements (Ahmed et al., 2001; Bhatt et al., 2022; Grose et al., 2017; Mrázková et al., 2021; Parker et al., 2022; Riga et al., 2010; Somma et al., 2008). In contrast, the remaining articles utilized noise quantification questionnaires, a more subjective approach to assessing noise exposure levels.
Table 1 summarizes the outcomes of all the studies included in this review. The EHFs tested varied across the articles and included 9, 10, 11.2, 12, 12.5, 14, 16, and 18 kHz. None of the articles reported thresholds for 20 kHz. Of the 30 articles reviewed, 19 reported elevated hearing thresholds in the EHF region among noise-exposed individuals. Among these studies, 20 found no significant threshold shifts in the SF region, while five did not report statistical significance for SF thresholds (Basiouny et al., 2022; Dreyer et al., 2023; Mourad, 2020; Rocha et al., 2010; Silvestre et al., 2016). Additionally, five studies found significant threshold shifts at some SF frequencies along with EHF shifts (Table 1). However, in all five of these studies, the threshold shifts were more pronounced in the EHF region than in the SF region, and hearing thresholds remained within normal limits in the SF region (Biassoni et al., 2014; Dhrruvakumar et al., 2022; Riga et al., 2010; Somma et al., 2008; Sulaiman et al., 2014). The remaining 11 studies did not find elevated thresholds in the EHF region.
Of the 30 articles included in the systematic review, 11 studies examined occupational noise exposure, 13 studies focused on recreational noise exposure, four studies investigated cumulative noise exposure, and two studies assessed noise exposure among musicians. Due to the limited number of studies in the cumulative noise exposure and musician and categories, these were excluded from the meta-analysis. Consequently, the meta-analysis was conducted exclusively on studies that provided a clear distinction between recreational and occupational noise exposure. Ten out of 11 articles with occupational noise exposure reported higher thresholds in the EHF region for the noise-exposed group compared to the non-exposed group, while three studies did not find such an effect. Among the 13 studies on recreational noise, 7 studies showed a significant association between noise exposure and EHF threshold, while 6 reported no significant association between EHF thresholds and noise exposure. These mixed findings for both occupational and recreational noise exposure categories prompted a meta-analysis to quantify the relationship between different types of noise exposure and hearing threshold shifts in the EHF region. Due to the unavailability of standard deviation (SD) data, one occupational study was excluded (Pinsonnault-Skvarenina et al., 2022). As a result, the meta-analysis included data from 10 occupational noise studies and 13 recreational noise studies.
Strength of Evidence
The meta-analysis applied a random effects model for analyzing the effect of noise exposure for individual EHFs: 9, 10, 11.2, 12, 12.5, 14, and 16 kHz (Table 3). The 18 kHz data was excluded from the meta-analysis as there were only two studies for occupational noise category and these had contradictory finding (Ahmed et al., 2001; Macca et al., 2015). Hearing thresholds across ears, when available, were averaged. Mean, standard deviation, and p-values were extracted from each article for every EHFs tested for performing the meta-analysis. An ear-specific analysis could not be performed as there were only eight studies (two occupational and six recreational) reported thresholds separately for the right ear and left ear (Basiouny et al., 2022; Bhatt et al., 2022; Bhatt & Wang, 2019; Dreyer et al., 2023; Ismail et al., 2020; Kumar et al., 2009; Mehrparvar et al., 2014; Mourad, 2020; Sulaiman et al., 2014). Forest plots depicting the estimated effect sizes for each category (occupational and recreational noise), along with the overall effect size for individual EHFs, are presented in Figure 2.
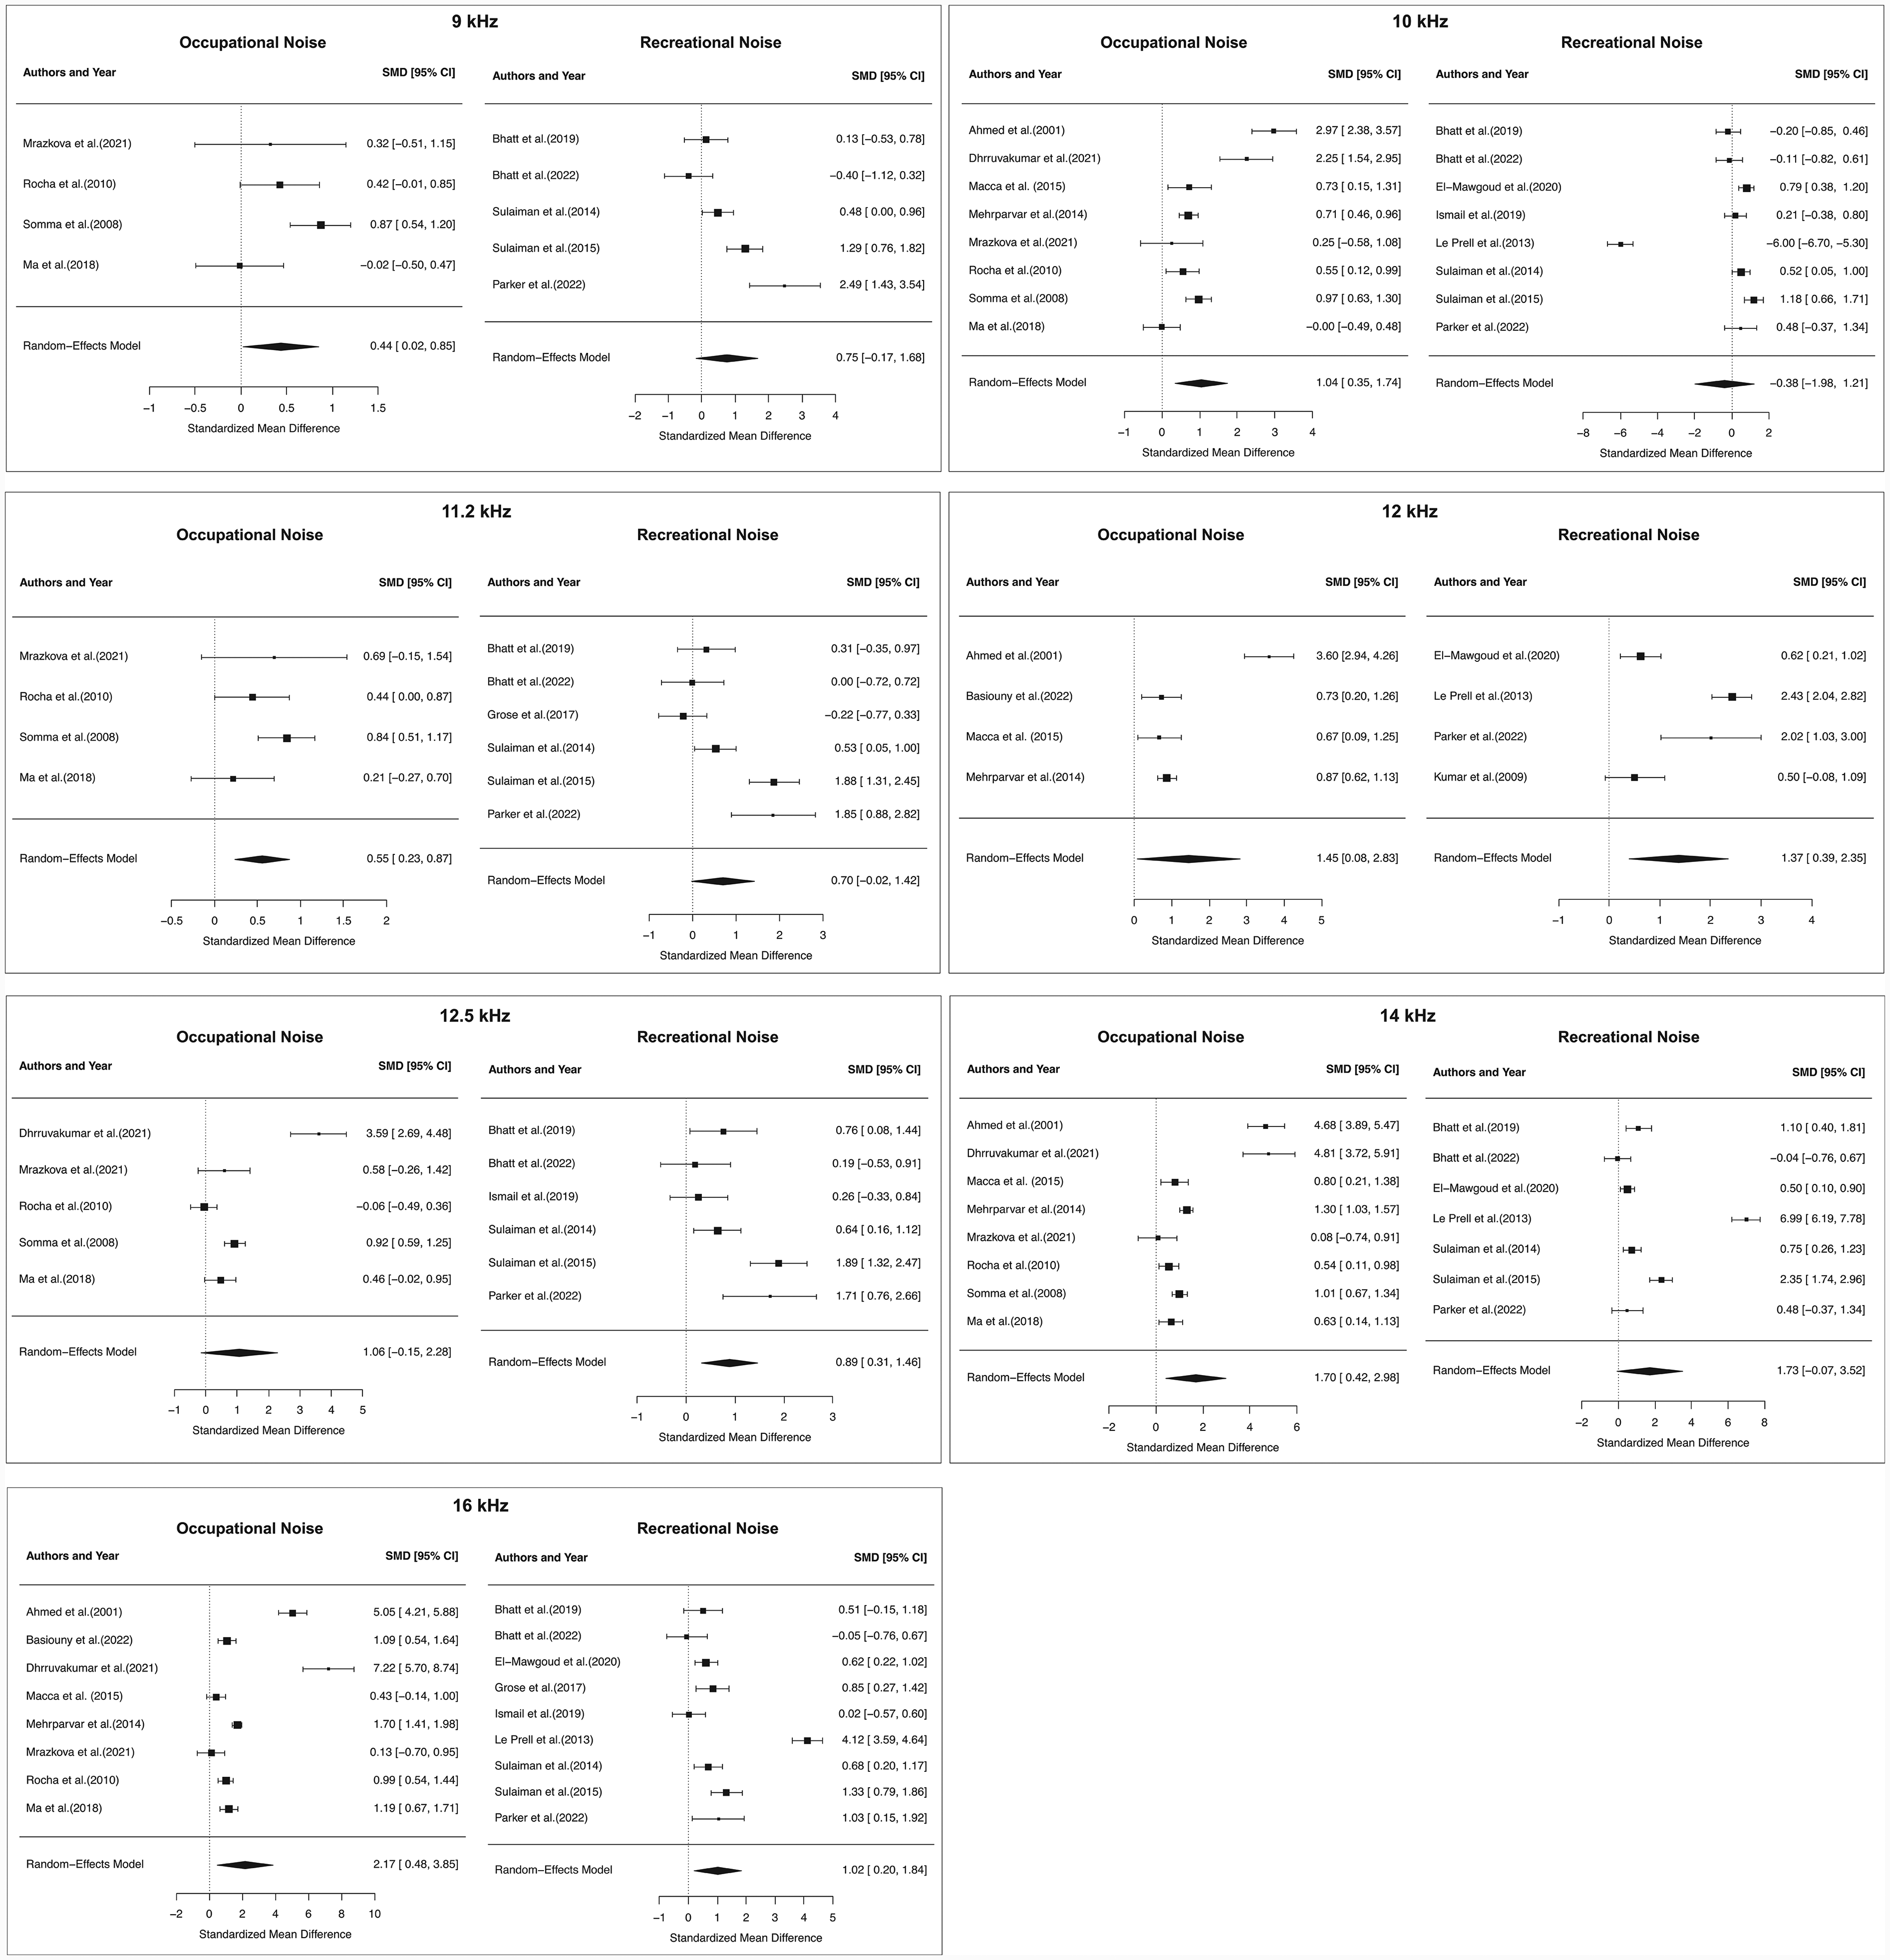
Forest plot illustrating the effect of noise exposure on extended high-frequency (EHF) thresholds across occupational and recreational noise studies separately. The standardized mean differences (SMD) with 95% confidence intervals are presented for each study. The overall pooled effect, estimated using a random-effects model (RE), is represented by a diamond, summarizing the combined effect size for both occupational and recreational noise exposure groups separately.
Meta-Analysis Outcomes for all the Frequencies (N = 23).

CI = confidence interval. Significant p-values (p < .05) are bolded.
* p < .05; ** p < .01; *** p < .001.
Occupational Noise Exposure
For 9 kHz, the meta-analysis included ten studies (k = 4) that reported thresholds. Table 3 summarizes the results of the heterogeneity test, random-effects model, normality assessment, resampling (if any), and publication bias for all analyzed EHFs. The estimated heterogeneity of the true effect sizes (τ2) across studies was 0.11. The confidence interval (CI) of τ2, representing the uncertainty in this estimate, ranged from 0.0008 to 1.82. The √τ2 represents the standard deviation of the effect size, indicating the degree of heterogeneity; higher values suggest greater heterogeneity. The I2 value was 66.45%, which shows the percentage of total variation across studies due to heterogeneity rather than chance. The I2 > 50% indicates substantial heterogeneity. Similarly, H2 was found to be 2.98, which is the ratio of the total observed variance to the variance within studies. H2 greater than 1 suggests the presence of heterogeneity. Tests for heterogeneity yielded a Cochrane's Q statistic of 9.53 (p < .05), suggesting significant heterogeneity among the studies, in alignment with the substantial I², as well as H2. The random-effects model results showed an estimated 0.44 (p = .03), suggesting a positive effect of moderate magnitude. The Shapiro-Wilk test confirmed the normality assumption (p = .88) required for the validity of the random-effects model. The publication bias is represented in Figure 3. Egger's test results indicated no significant publication bias for the 9 kHz data (p =.26). Thus, there was a significant association between noise exposure and threshold elevation at 9 kHz with a medium effect, and the effect sizes were unbiased. The results for 10 and 11.2 kHz showed a similar association with noise exposure, with larger effect sizes. However, for 10 kHz, Egger's test indicated the presence of systematic bias (p = .01).

Funnel plot (standard error vs. effect size) assessing publication bias across frequencies from 9 to 16 kHz. The plot assesses the symmetry of effect size distributions, with any asymmetry suggesting potential publication bias. Egger's test revealed significant publication bias at 10 kHz (p = .014), while no evidence of bias was found for the other frequencies.
The random-effects model for 12 kHz estimated a large positive effect (1.45, p = .03). However, the Shapiro–Wilk test indicated a violation of the normality assumption (p = .007). To address this, resampling was performed using the adjusted bootstrap percentile method. The bias value, representing the average difference between the bootstrap estimates and the original effect sizes, was 0.11. While a bias value close to zero is ideal, the wide confidence interval (0.71, 2.74) supports the significant positive effect, with the pooled effect size (Cohen's d = 1.48), confirming a large effect for 12 kHz. Similar patterns of results were observed for 14 and 16 kHz, with no evidence of publication bias. In contrast, the random-effects model estimate for 12.5 kHz was 1.06 (p = .08), indicating no statistically significant effect and no evidence of publication bias (p = .68).
Recreational Noise Exposure
A similar framework was applied to evaluate the effect of recreational noise exposure on EHF hearing thresholds. The random-effects model results indicated significant effects for 12, 12.5, and 16 kHz, while no statistically significant differences were observed for 9, 10, 11.2, and 14 kHz (Table 3). At 12 kHz (k = 4), the estimated effect size was 1.37 (p = .006), suggesting a large positive effect. Similarly, for 12.5 kHz (k = 6), the estimate was 0.88 (p = .002), and for 16 kHz (k = 9), the estimate was 1.01 (p = .01), indicating significant effects. The Shapiro–Wilk test confirmed the normality assumption for 12 kHz (p = .21) and 12.5 kHz (p = .21), validating the use of the random-effects model. However, for 10, 14, and 16 kHz, the Shapiro-Wilk test indicated a violation of normality assumption (10 kHz: p < .01, 14 kHz: p = .004; 16 kHz = 0.003), necessitating resampling using the bootstrapping method. For 16 kHz, the bias value after resampling was −0.006, indicating minimal deviation in the resampling process. The confidence interval for the bias estimate (0.56, 2.55) further supports the validity of the random-effects model results, confirming a significant effect with a large effect size (Cohen's d = 1.02). Similar analyses for 10 and 14 kHz confirmed the lack of significant effects, which were not due to violations of normality, but rather reflect the true absence of an effect (Table 3).
Discussion
Principal Findings
This systematic review with meta-analysis revealed a link between noise exposure and elevated hearing thresholds in certain EHFs in 10 out of the 11 occupational noise exposure studies and in seven out of the 13 recreational noise exposure studies reviewed. The meta-analysis was conducted separately based on the noise exposure category, specifically occupational and recreational noise. The findings showed a significant association between occupational noise exposure and elevated hearing thresholds at 9, 10, 11.2, 12, 14, and 16 kHz. The effect sizes varied, with medium effects observed at 9 and 11.2 kHz, while large effects were found at 10, 12, 14, and 16 kHz, providing robust evidence supporting this association. However, the threshold shift at 12.5 kHz did not reach statistical significance, potentially due to considerable variability in findings across studies. For recreational noise exposure, the association between noise exposure and elevated hearing thresholds was less pronounced, with significant effects observed only at 12, 12.5, and 16 kHz. These results suggest that noise exposure is associated with elevated thresholds at certain EHFs (e.g., 16 kHz) for both occupational and recreational noise exposures, even when hearing loss in the standard audiogram remains clinically undetectable.
Occupational and Recreational Noise Exposure
The observed differences among occupational and recreational noise exposure may be attributed to variations in noise intensity, spectral composition, and exposure patterns. Participants in occupational noise studies are typically subjected to high-intensity noise for extended durations and on a continuous basis, whereas individuals in recreational noise studies encounter more intermittent and variable exposure patterns. Occupational environments often involve prolonged exposure to broad-spectrum noise at hazardous levels, which may contribute to more pronounced shifts in hearing thresholds (Jo & Baek, 2024; Neitzel & Fligor, 2019; Sheppard et al., 2020). In contrast, recreational noise exposure, while could be potentially intense, tends to be shorter in duration and influenced by individual listening behaviors, resulting in greater variability in hearing outcomes (Ergun et al., 2024; Neitzel & Fligor, 2019; Prendergast et al., 2017b). Additionally, it is rather difficult to quantify recreational noise exposure. Although several inventories, such Noise Exposure Structured Interview (Guest et al., 2018) and Noise Exposure Questionnaire (Johnson et al., 2017) are developed, the accuracy of these remain questionable due to recall bias (Jiang et al., 2016). Further, the distinction between recreational noise and daily routine noise is also blurred. Nevertheless, the present study revealed a significant association between noise exposure, regardless of the type, and hearing thresholds at EHFs, even when the clinical audiogram is normal.
Subclinical Damage
The association between noise exposure and elevated EHF hearing thresholds in adults with normal audiograms highlights subclinical auditory damage. This suggests that noise-induced damage may occur at EHFs before hearing loss at standard audiometric frequencies becomes clinically detectable, emphasizing EHFs as a sensitive indicator of early, preclinical auditory impairment. For example, Riga et al. (2010) reported that noise-exposed individuals had elevated EHF thresholds at 10, 11.2, 12.5, 14, 16, and 18 kHz, with these elevations appearing within 10 years of employment, whereas standard frequency thresholds began to decline only after 20 years. Further supporting the idea of subclinical damage, experimental studies have demonstrated auditory deficits in noise-exposed individuals despite normal audiograms (Kumar et al., 2012; Okamoto et al., 2011; Stone & Moore, 2014). Okamoto et al. (2011) observed broadened population-level frequency tuning, measured via magnetoencephalography, in long-term users of personal stereo players relative to nonusers despite no difference in standard hearing thresholds. Kumar et al. (2012) reported that individuals exposed to occupational noise, even with clinically normal hearing thresholds in the 0.25–8 kHz frequency range, exhibited poorer temporal processing and speech recognition abilities. Likewise, Stone and Moore (2014) found higher (poorer) amplitude modulation detection thresholds for the high-noise than for the low-noise sub-group in young male adults with normal audiograms.
In humans, the basal cochlear turn, which processes EHF sounds, is particularly vulnerable to damage (Fettiplace & Nam, 2019; Wang et al., 2002). For instance, the level of antioxidant glutathione is lower in the basal cochlear turn, increasing towards the apex (Sha et al., 2001), making it more prone to oxidative stress and damage. This may be one reason basal turn hair cells are more vulnerable to most forms of damage (Wong & Ryan, 2015). The susceptibility of the EHF region to noise exposure, along with evidence from this meta-analysis, indicates that early cochlear damage can occur even when thresholds in the conventional audiometric frequencies (0.25–8 kHz) remain normal. This highlights the need for early detection tools that can identify subclinical damage before it progresses to lower frequencies and becomes more severe.
Implications
NIHL is a significant concern in both occupational and recreational settings. However, early detection of noise-induced damage or determining individual susceptibility remains challenging (Chen et al., 2022; Henderson et al., 1993; Sliwinska-Kowalska et al., 2006). A characteristic notch in the air conduction threshold at 3–6 kHz is commonly considered as a clinical hallmark of NIHL (McBride & Williams, 2001; Rabinowitz et al., 2007; Salmivalli, 1967). A previous meta-analysis found no differential effect of noise exposure on standard frequencies versus EHFs (Houshang et al., 2018). However, the present study specifically examined the evidence in individuals with normal audiograms and found that EHFs are potentially more vulnerable to noise-induced damage, a factor often overlooked in clinical practice. The findings support formulating an attractive hypothesis that the ‘audiometric notch,’ the classic sign of NIHL, may follow EHF loss. It is also plausible that, in some groups, EHF hearing loss may precede overt hearing loss without ever showing an audiometric notch (e.g., Lie et al., 2017). These hypotheses require confirmation through longitudinal studies.
Beyond hearing loss, noise exposure is associated with various auditory and vestibular problems, including tinnitus and balance disorders (Golz et al., 2001; Shargorodsky et al., 2010). For example, tinnitus is significantly more prevalent among noise-exposed workers (24%) than the overall population (14%) and is substantially higher in those in the military (∼80%). Thus, elevated EHF thresholds may serve as a predictive marker for early identification of individuals at risk for developing more severe auditory issues such as NIHL and tinnitus. Interestingly, a meta-analysis found that adults with tinnitus exhibited significantly higher EHF thresholds than controls (Jafari et al., 2022).
Some Considerations
At the outset, it is important to note that the effect of noise exposure on hearing is heterogeneous, meaning it can manifest in various ways across individuals. Early indicators of noise-induced damage may not always present as selective EHF loss or the characteristic audiometric notch. Likewise, not all EHF loss is associated with noise exposure. Noise exposure may affect physiological processes before these effects are reflected in measurable hearing thresholds. This underscores the need to consider alternative, more sensitive markers of early cochlear damage, such as otoacoustic emissions or electrophysiological measures, which may identify impairments before changes in hearing thresholds, regardless of test frequency, become clinically detectable.
The studies included in the meta-analysis varied in their strengths; however, some limitations should be addressed in future research. Most studies did not report power analyses to determine sample size, potentially contributing to null effects or variability in outcomes. It is also important to acknowledge the variations in calibration and quantification of pure-tone level (e.g., HL vs. SPL) and transducers used (e.g., insert earphones vs. circumaural headphones) for threshold estimation across the studies (Ahmed et al., 2001; Bhatt & Wang, 2019; Ismail et al., 2020; Macca et al., 2015). Additionally, several studies were excluded due to insufficient statistical data, such as standard deviations and p-values for individual EHFs (Bharadwaj et al., 2022; Snapp et al., 2022; Sulaiman et al., 2013), or due to the use of median or average EHF thresholds instead of individual data (Couth et al., 2024; Shehorn et al., 2020). As different studies test or define pure-tone averages for EHF differently, combining them with pooled data would be erroneous. Furthermore, subgroup analyses based on certain demographic variables such as ethnicity/race, sex, etc., could not be conducted due to the unavailability of relevant demographic data. Such data could help examine potential variations in the relationship between noise exposure and EHF thresholds across different populations.
Despite the significant findings, there was considerable heterogeneity across the studies, as indicated by high I2 values (>75%) and elevated H2 and τ2 values (Table 3). This heterogeneity likely stems from differences in study design, noise exposure quantification, and population characteristics. A random-effects model was applied to account for this variation, though it may have influenced the computed effect size. The measurement of noise exposure varied across the studies, particularly for recreational noise exposure (Table 1). While most studies determined noise exposure levels and duration using self-reported questionnaires, few employed objective methods such as dosimetry (Ahmed et al., 2001; Bhatt et al., 2022; Somma et al., 2008). This variability in assessment methods, along with differences in noise level and exposure duration, will probably continue due to the inherent challenges of quantifying recreational noise exposure and will limit subgroup analyses to examine the specific effects of these factors.
Confounding factors, particularly age, also need to be considered. EHF hearing tends to decline with age, and selective EHF loss can be seen even in young adults (Lee et al., 2012; Mishra et al., 2022; Mishra et al., 2025; Zadeh et al., 2019). Ageing effects can confound the relationship between noise exposure and EHF thresholds, particularly in studies lacking a longitudinal design, although disentangling the effects of age and noise exposure remains a practical challenge. For example, Biassoni et al. (2014) reported that the noise-exposed group had higher thresholds at 9, 10, 11.2, 12.5, 14, and 16 kHz after three years of noise exposure. In contrast, Couth et al. (2024) reported no effect of noise exposure on average thresholds for EHFs (12 and 16 kHz). Although we attempted to minimize the influence of ageing by selecting participants up to 35 years of age, the effect could not be entirely eliminated, as age-related EHF sensitivity decline can begin in late teen years (Lee et al., 2012; Mishra et al., 2022).
Summary
The present systematic review and meta-analysis provides evidence of potential damage to basal cochlear functions in humans due to noise exposure, as indicated by poorer hearing thresholds above 8 kHz in the noise-exposed group, despite no abnormalities in the clinical audiogram. The association was more pronounced for occupational noise exposure compared to recreational noise exposure, suggesting that prolonged and continuous noise exposure in occupational settings may have a greater impact. However, longitudinal studies are needed to establish causation and to elucidate the progression of noise-induced damage across different frequencies, along with its implications for clinical practice.
Footnotes
Author Contributions
Sajana Aryal was involved in concept development, study design, analysis of the results, interpretation, and writing the manuscript; Monica Trevino was involved in concept development and study design and writing the manuscript; Hanspani Rodrigo was involved in data analysis and interpretation; Srikanta Mishra was involved in concept development, study design, interpretation of result, writing the manuscript. All authors read and approved the final manuscript.
Funding
The authors received no financial support for the research, authorship, and/or publication of this article.
Declaration of Conflicting Interests
The authors declared no potential conflicts of interest with respect to the research, authorship, and/or publication of this article.
Data Availability
The datasets analyzed during the current study are publicly available and can be obtained from the corresponding author upon reasonable request.