
Abstract
The ability to tell where sound sources are in space is ecologically important for spatial awareness and communication in multisource environments. While hearing aids and cochlear implants (CIs) can support spatial hearing for some users, this ability is not routinely assessed clinically. The present study compared sound source localization for a 200-ms speech-shaped noise presented using real sources at 18° intervals from −54° to +54° azimuth and virtual sources that were simulated using amplitude panning with sources at −54° and +54°. Participants were 34 adult CI or electric-acoustic stimulation users, including individuals with single-sided deafness or aided acoustic hearing. The pattern of localization errors by participant was broadly similar for real and virtual sources, with some modest differences. For example, the root mean square (RMS) error for these two conditions was correlated at r = .89 (p < .001), with a mean RMS elevation of 3.9° for virtual sources. These results suggest that sound source localization with two-speaker amplitude panning may provide clinically useful information when testing with real sources is infeasible.
Keywords
Introduction
Spatial hearing is ecologically important for environmental awareness and communication, and impaired spatial hearing is a key factor in the disability associated with hearing loss (Kramer et al., 1995). For patients with moderate to profound sensorineural hearing loss, cochlear implants (CIs) can improve spatial hearing, with benefits observed for bilateral CI users and unilateral CI recipients with contralateral acoustic hearing (Buss et al., 2018; Potts et al., 2009; Seeber et al., 2004). Despite good outcomes for many CI users, there are large individual differences in the spatial hearing acuity, and this aspect of performance is not assessed in routine clinical practice (e.g., Park et al., 2022). Lack of objective outcome measures for spatial hearing is particularly problematic given its role in patients’ decisions to seek cochlear implantation in the first place. For example, Deep et al. (2021) reported that difficulty localizing sound sources in space was among the top three reasons that adults with single-sided deafness reported for pursing cochlear implantation, along with tinnitus and speech-in-noise recognition.
Questionnaire data can be used to broadly characterize subjective aspects of spatial hearing, but objective measures of sound source localization typically require expertise and specialized equipment that is not available in most clinics. One clinically feasible solution to this problem would be to test patients’ spatial hearing abilities using stimuli recorded in a multispeaker environment with a head and torso simulator (e.g., Moua et al., 2019); this approach could be used to deliver highly controlled stimuli to patients using direct audio input, but it would not capture patient-specific effects related to free-field listening (e.g., microphone placement or directionality) and could be challenging to implement for some populations, such as unilateral CI users with normal or near normal hearing on the contralateral side. Other possible solutions entail free-field stimulus presentation with custom hardware developed for clinical use, often including multiple loudspeakers arranged in an arc or a circle (e.g., R-Space, Revitronix; Plotz & Schmidt, 2017; Wasmann et al., 2020; Zurek et al., 2024). While clinically feasible, the cost and the space needed to accommodate these solutions can be prohibitive.
An alternative approach for evaluating spatial hearing in a clinical setting makes use of vector-base amplitude panning (VBAP; Pulkki, 1997) to create virtual sources intermediate between loudspeakers. Two recent studies have used this approach to estimate the smallest detectable change in spatial position on the horizontal plane—the minimum audible angle (MAA). Fernandez et al. (2022) used two loudspeakers separated by 90° to simulate sounds between −45° and +45° in front of the listener. Compared to published data obtained using traditional methods, estimates of the MAA obtained using VBAP were within the range of expected values for bilateral CI users and only slightly elevated for normal-hearing (NH) listeners. Similar results were obtained by Meng et al. (2021) for NH listeners. Tavora-Vieira et al. (2015) used VBAP for loudspeakers at ±60° to test CI users’ ability to localize a 4-kHz narrowband noise; results were not compared to localization of real sources, but they were generally consistent with published data from this population. More recently, Fernandez et al. (2025) evaluated sound source localization for bilateral hearing aid users and NH controls tested in a speaker arc, using VBAP to simulate sources intermediate between loudspeakers separated by 30°. Stimuli were bursts of speech-shaped noise. That study found that the root mean square (RMS) error was 1–2° poorer for virtual sources than for real sources on average, and that data obtained with virtual sources did a relatively good job of characterizing individual difference in localization ability. These preliminary reports are consistent with the idea that two-speaker VBAP might support clinical assessment of spatial hearing in CI users. This approach is particularly attractive because it could make use of equipment that is already widely available in clinical settings.
Localization for listeners with NH relies predominantly on interaural time differences (ITDs) at low frequencies and interaural level differences (ILDs) at high frequencies (Blauert, 1997; Macpherson & Middlebrooks, 2002). Traditional CI users rely predominantly on ILDs (Aronoff et al., 2010; Seeber & Fastl, 2008), but listeners with residual acoustic hearing bilaterally may also benefit from access to ITDs (Loiselle et al., 2016). Amplitude panning simulates sound sources by manipulating the amplitude of sound presented simultaneously from two or more loudspeakers; for loudspeakers separated on the azimuth, this creates both ILDs at high frequencies and ITDs at low frequencies. The naturalness of cues reaching the listener decreases with increasing separation between loudspeakers; differences between the sound propagation paths to each ear for virtual sources result in constructive (or destructive) interference when those paths differ by an integer multiple of the stimulus wavelength (or half the stimulus wavelength), and differences in loudspeaker position relative to the head of the listener affect spectral content, due to differences in head-related transfer functions for real and simulated sources (Tollin & Yin, 2003). Whereas discrepancies between cues provided by real sources and VBAP simulation can affect perception of location (Pulkki & Karjalainen, 2001), sensitivity to these discrepancies tend to be reduced in listeners with hearing loss (Ellis & Souza, 2020). Reduced sensitivity to spatial cues and relatively poor spectral resolution relative to NH listeners make CI users a good population to begin with when evaluating VBAP as a possible method for characterizing localization clinically with two loudspeakers.
The present report provides preliminary data to evaluate whether sound source localization abilities characterized using two-speaker VBAP accurately capture individual differences among adult CI users. Results are compared to those obtained behaviorally with real sound sources. The present study focused on sound source localization, rather than another spatial task (e.g., the MAA), due to the importance of localization for personal safety and selective attention to sources of interest. If successful, characterizing localization using virtual sound sources would provide an objective measure of spatial hearing and could give clinicians valuable information to guide intervention, leveraging the large and growing basic research literature on spatial hearing in CI users to improve patient outcomes.
Experiment
Method
Participants were 34 adult CI or electric-acoustic stimulation (EAS) users, 39–83 years of age (mean 65 years). They self-reported race as White (n = 31), Black (n = 2), or other (n = 1); none reported ethnicity as Hispanic/Latino. All were participating in one or more longitudinal studies of MED-EL device recipients that include auditory localization for real sound sources (described below), and all participants had performed that task in one or more prior test sessions. For collection of the data reported below, participants were tested using familiar maps and device settings (e.g., amplitude compression settings), with the same microphone directionality settings in the two conditions (real and virtual sources). Participants included bilateral CI users, unilateral CI users with normal or near-normal hearing in the contralateral ear, and unilateral CI users who wear a hearing aid (HA) in the contralateral ear (bimodal users). Some participants had functional acoustic hearing in the implanted ear and listened with an ipsilateral EAS device. Ears with moderate or greater hearing loss were fitted with a device (CI, HA, or EAS); the sole exception was participant P33, who used EAS in the left ear and had unaided profound hearing loss in the right ear. The acoustic output of HA and EAS devices was verified to NAL-NL1 prescriptive targets (Byrne et al., 2001) using test box measurements with the Verifit 2 (Audioscan). All devices had ear-level microphones (i.e., no off-the-ear or in-the-ear microphones). Figure 1 shows unaided acoustic thresholds for ears with a CI, HA, EAS, or no device. Acoustic thresholds were not collected for 17 of the 30 ears with CIs, based on prior data indicating profound hearing loss. Table 1 shows each participant's age, listening configuration, duration of CI or EAS use, CI or EAS directionality setting, and low-frequency pure-tone average (LFPTA; mean in dB HL for 125, 250, and 500 Hz). The LFPTA was chosen as a summary measure of acoustic hearing given the importance of low frequencies for sound source localization in listeners with NH (Wightman & Kistler, 1992). Supplemental Table S1 provides additional information about each participant's device or devices. For reference, localization data were also collected from a cohort of 10 adults, 22 to 28 years of age (mean 25 years), all with NH defined as thresholds ≤ 20 dB HL 250–8000 Hz bilaterally.

Unaided acoustic pure-tone thresholds in dB HL as a function of frequency, shown for each device condition: CI, EAS, HA, or none. In each panel, blue squares show results for left ears, and red circles show results for right ears. The title above each panel indicates the number of ears represented. Duplicate thresholds at a particular frequency and level are indicated by darker symbol shading. Thresholds were not measured on the test day for 17 ears with CIs due to previous evidence of profound hearing loss.
Participant and Device Information.

CI = cochlear implant; EAS = electric-acoustic stimulation; LFPTA = low-frequency pure-tone average.
Listening configuration is categorized as CI, EAS, or HA for ears fitted with a device. For ears with no device, hearing sensitivity is indicated in parentheses as either normal hearing (NH), slight hearing loss (slight) and profound hearing loss (profound).
*CI directionality categories include Omni, natural, or adaptive.
Omni: Omnidirectional for all frequencies and levels.
Natural: Omnidirectional for low-frequencies and fixed directionality for high-frequencies.
Adaptive: Polar plot changes in response to noise positioned behind or to the side of the listener; omnidirectionality is used for low and moderate level inputs (e.g., < 60 dBA). For P33, the adaptive options included directional polar plots only.
Testing took place in a 10’ × 10’ double-walled sound booth that was outfitted with a 180° arc of 11 loudspeakers, uniformly spaced at 18° intervals. This arc has a diameter of approximately 2 m and height of approximately 1 m, such that loudspeakers are 1 m away at ear level for a seated adult. The RT60 at the position of the participant was 100–150 ms for octave-wide bands 1–8 kHz. Signs above each loudspeaker indicated the associated loudspeaker number. For localization of real sources, stimuli were presented at each of the 11 loudspeakers, following the protocol for the other clinical research taking place in the lab. While the 18° separation between loudspeakers precludes assessment of sensitivity to smaller changes in position, previous data indicate that these methods are accurate enough to characterize the salient differences in spatial hearing abilities among CI users (e.g., Dillon et al., 2017). Virtual sources corresponded to the seven loudspeaker locations from −54° to +54°, although sound only played from loudspeakers at the edges of this range (–54° and +54°). Stimuli in these conditions were generated using the VBAP toolbox in MATLAB (Politis, 2022), which is based on procedures developed by Pulkki (1997). The angular separation of ±54° was selected for virtual sources based on similarity to the configuration of loudspeakers mounted in neighboring corners of a clinic booth.
For testing with both real and virtual sources, participants sat in the middle of the arc, 1 m from all loudspeakers and facing the loudspeaker at 0°, as illustrated in Figure 2. The stimulus was a 200-ms speech-shaped noise presented at 52, 62, or 72 dB SPL. Each run included four stimulus presentations at each level from each location, resulting in 132 trials (11 locations) for real sources and 84 trials (seven locations) for virtual sources. Trials were blocked by condition (real or virtual sources), with conditions completed in random order. Within each condition, the order of levels and locations was randomized. Participants were instructed to verbally report the loudspeaker number that most closely corresponded with the perceived source location from the full 180° arc of loudspeakers. The experimenter recorded those verbal responses in the data log. Instructions were identical for the two conditions, and participants were blinded to stimulus condition (real vs. virtual). No feedback was given regarding accuracy of responses.
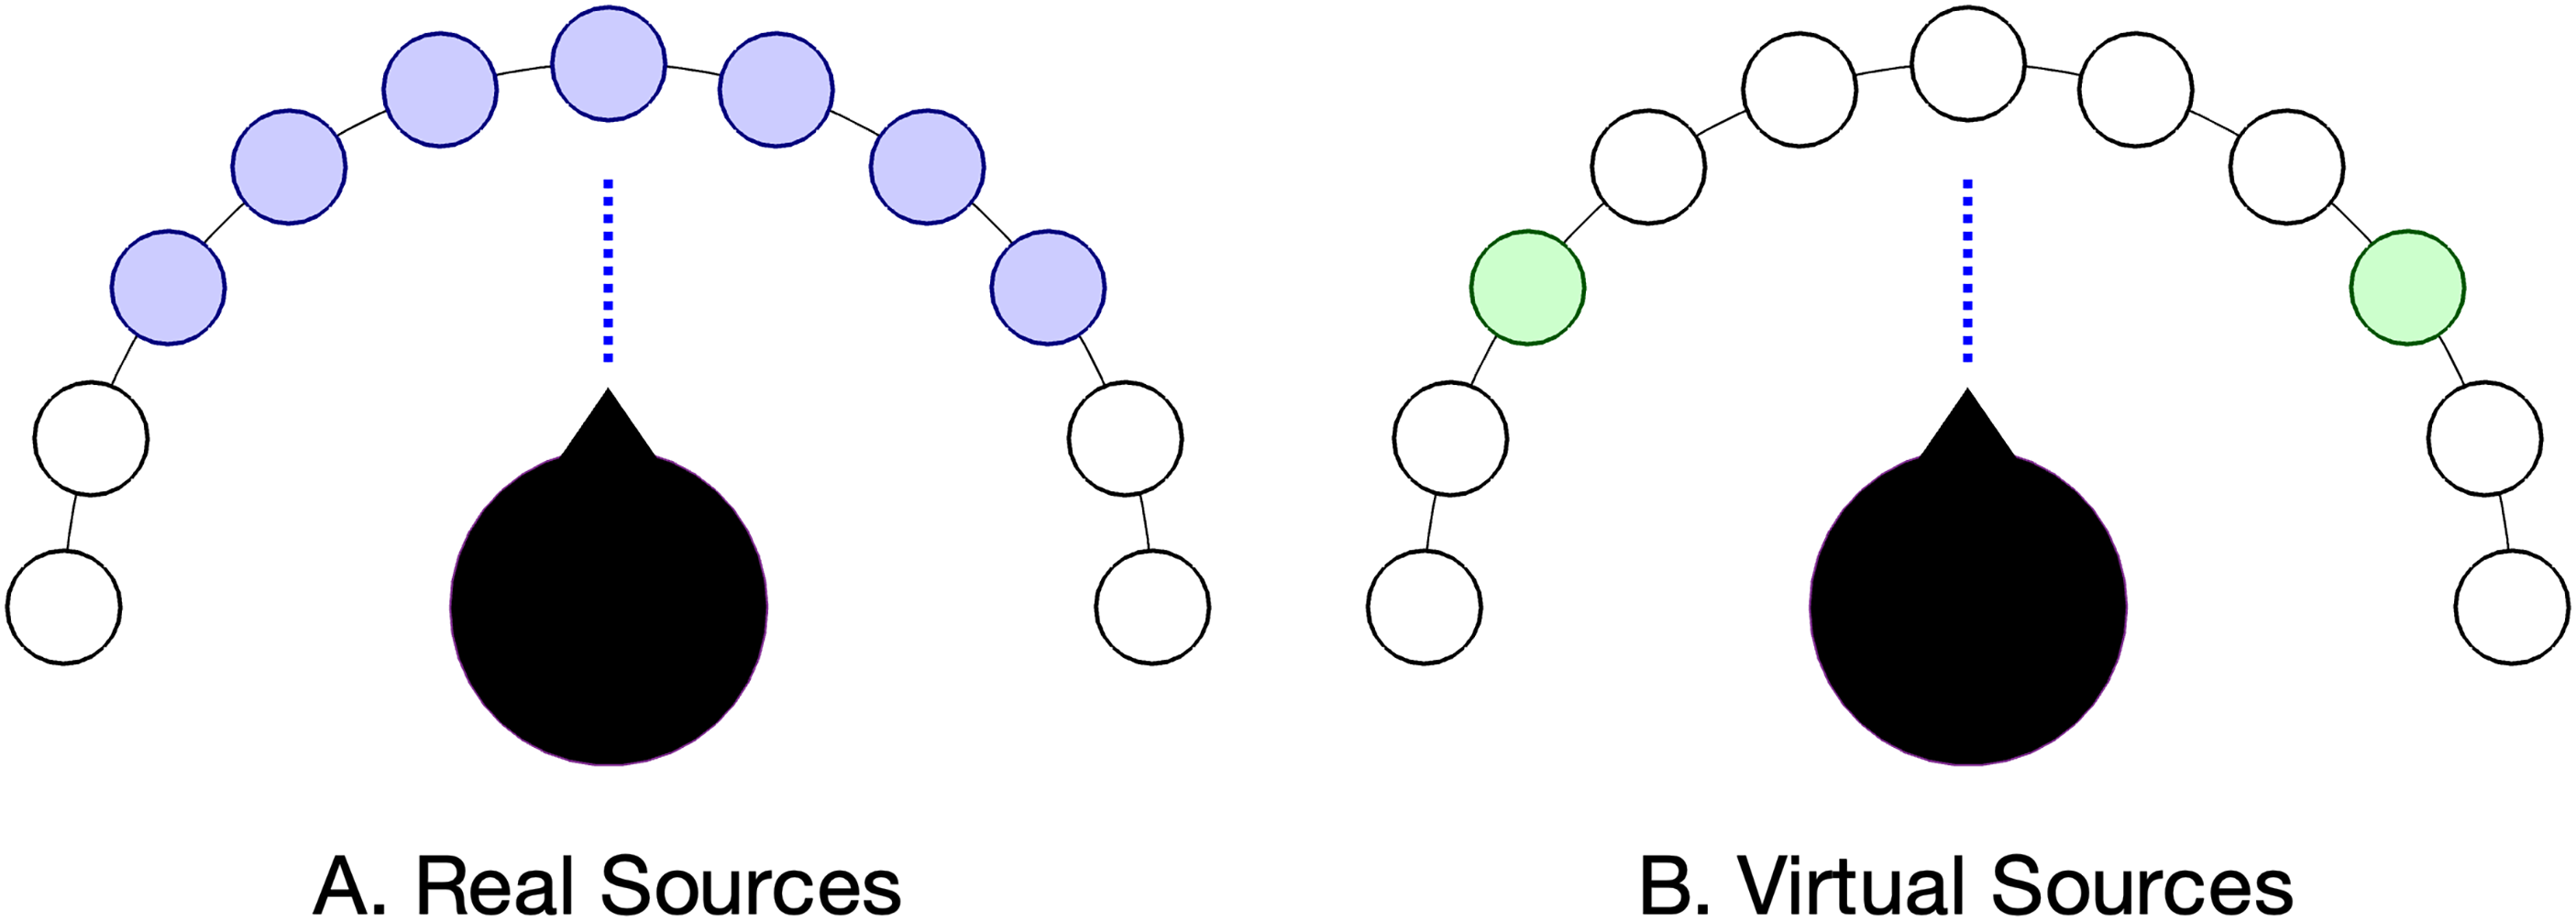
Illustration of loudspeaker and head position during testing. Purple filled circles in panel A indicate seven active loudspeakers, at 18° intervals from −54° to +54°. Green filled circles in panel B shows two active loudspeakers, at −54° and +54°. Open circles indicate loudspeakers that are also visible to the participant, and the vertical line indicates head orientation.
Testing took place during a scheduled data collection visit associated with an ongoing clinical trial. Participants provided informed consent to undertake both studies, and testing protocols were approved by the local Institutional Review Board. Participants took approximately 5 min to complete the virtual source localization task.
Results
Figure 3 shows all CI and EAS users’ responses plotted as a function of source location, from −54° to 54°. i Trials for real sources < –54° or > + 54° were omitted from this figure and from further analysis here. Symbol size reflects the number of trials associated with each pair of source and response, and color indicates condition (purple for real, green for virtual). Participant ID and listening condition are indicated above each pair of panels. Participants appear in order of the RMS error for the real source condition, with better performers at the top of the figure. One thing to notice about these data is the general similarity of responses for real and virtual sources. Participants who were able to accurately localize real sources were similarly accurate at reporting the intended locations of virtual sources, and those who were unable to accurately localize real sources were similarly poor at reporting the intended locations of virtual sources. Asymmetry and the individual patterns of localization errors were also similar for real and virtual sources.

Localization responses for CI and EAS users plotted as a function of source location (both in degrees) for real sources (purple) and virtual sources (green). Circle size reflects the number of trials for each pair of source and response. Gray grid lines indicate the region associated with real and simulated sources (±54°), and responses outside of this box indicate more lateral perceived locations. Text above each pair of panels indicates participant ID and listening configuration for the left and right side; for ears with no device, the acoustic LFPTA is categorized as either normal hearing (NH), slight loss (slight), or profound loss (profound).
Previous work on auditory localization has used a wide range of metrics to characterize localization response patterns, with little consensus regarding the best metric (Anderson et al., 2022; Bruns et al., 2024). For that reason, localization was characterized using a family of different measures. RMS error, a common metric in the CI literature, characterizes accuracy of participant responses. The Localization Sensitivity Index (LSI; Zheng et al., 2015) characterizes discriminability of sound from pairs of locations; for the seven possible locations tested, this results in 21 values of LSI per condition. ii The mean LSI across all pairs of locations is a summary measure characterizing LS. The other three measures considered here are the intercept, slope, and r2 associated with a line fit to responses as a function of source (real) or intended source (virtual) location. The intercept is sometimes described as response bias, the slope characterizes eccentricity of responses, and r2 characterizes the degree to which perceived location is linearly related to source location, irrespective of bias. These five measures characterizing localization tend to be correlated (e.g., Bruns et al., 2024), but each highlights a slightly different aspect of the results.
For real sources, there were marked individual differences in localization ability. For CI and EAS users the RMS error was 15.3° to 56.3° (M = 28.4, SD = 10.7), LS was 0 to 3.6 (M = 2.7, SD = 0.8), intercept was −16.7° to 21.4° (M = 3.8, SD = 9.2), slope was 0.2 to 1.7 (M = 1.1, SD = 0.4), and r2 was 0.03 to 0.94 (M = 0.71, SD = 0.02). It is not immediately clear what accounts for this variability. A priori, we might have expected better performance for participants who were younger and had more acoustic hearing. However, there was little evidence of an age effect, either in terms of RMS error (r = .10, p = .478) or LS (r = −0.19, p = .141). The better-ear LFPTA was used to evaluate effects of contralateral acoustic hearing in the 21 participants with a CI in one ear, including those with and without a contralateral HA. In this group, higher values of the LFPTA (poorer low-frequency thresholds) contralateral to the CI were associated with significantly higher RMS error (r = .41, p = .034), lower values of LS (r = −.48, p = .015), and lower values of r2 (r = −.39, p = .039). These results indicate better localization for participants with more acoustic hearing, with the caveat that all correlations were evaluated one-tailed, without adjustment for multiple tests, and these associations accounted for only about 16% of the variance across participants. A very similar pattern of results was observed when characterizing acoustic hearing using a four-frequency pure-tone average (mean of 500, 1000, 2000, and 4000 Hz).
Figure 4 shows the association between each of the five summary metrics for characterizing localization of real and virtual sources. Data for NH controls are included in the figure for reference but are excluded from the statistics that follow. Results are similar for real and virtual sources for all measures, with correlations ranging from r = .74 to r = .93. Paired-sample t-tests evaluated whether there were systematic differences between metrics for real and virtual sources. Compared to real sources, localization with virtual sources was associated with higher RMS error (M = 3.9°; t33 = −4.17, p < .001), lower LS (M = −0.14; t33 = 2.76, p = .010), higher intercept (M = 5.6°; t33 = −3.65, p < .001), and lower r2 (M = −0.04; t33 = 2.43, p = .021). The trend for shallower slope for virtual than for real sources failed to reach significance (M = −0.05; t33 = 1.71, p = .097). There was some evidence that response bias favored the side with better acoustic hearing sensitivity. For the 20 participants with thresholds for both ears, the difference in LFPTAs between ears (left–right) was positively correlated with the intercept for virtual sources (r = .44, p = .026 one-tailed) iii ; this association did not reach significance for real sources (r = .30, p = .097 one-tailed).
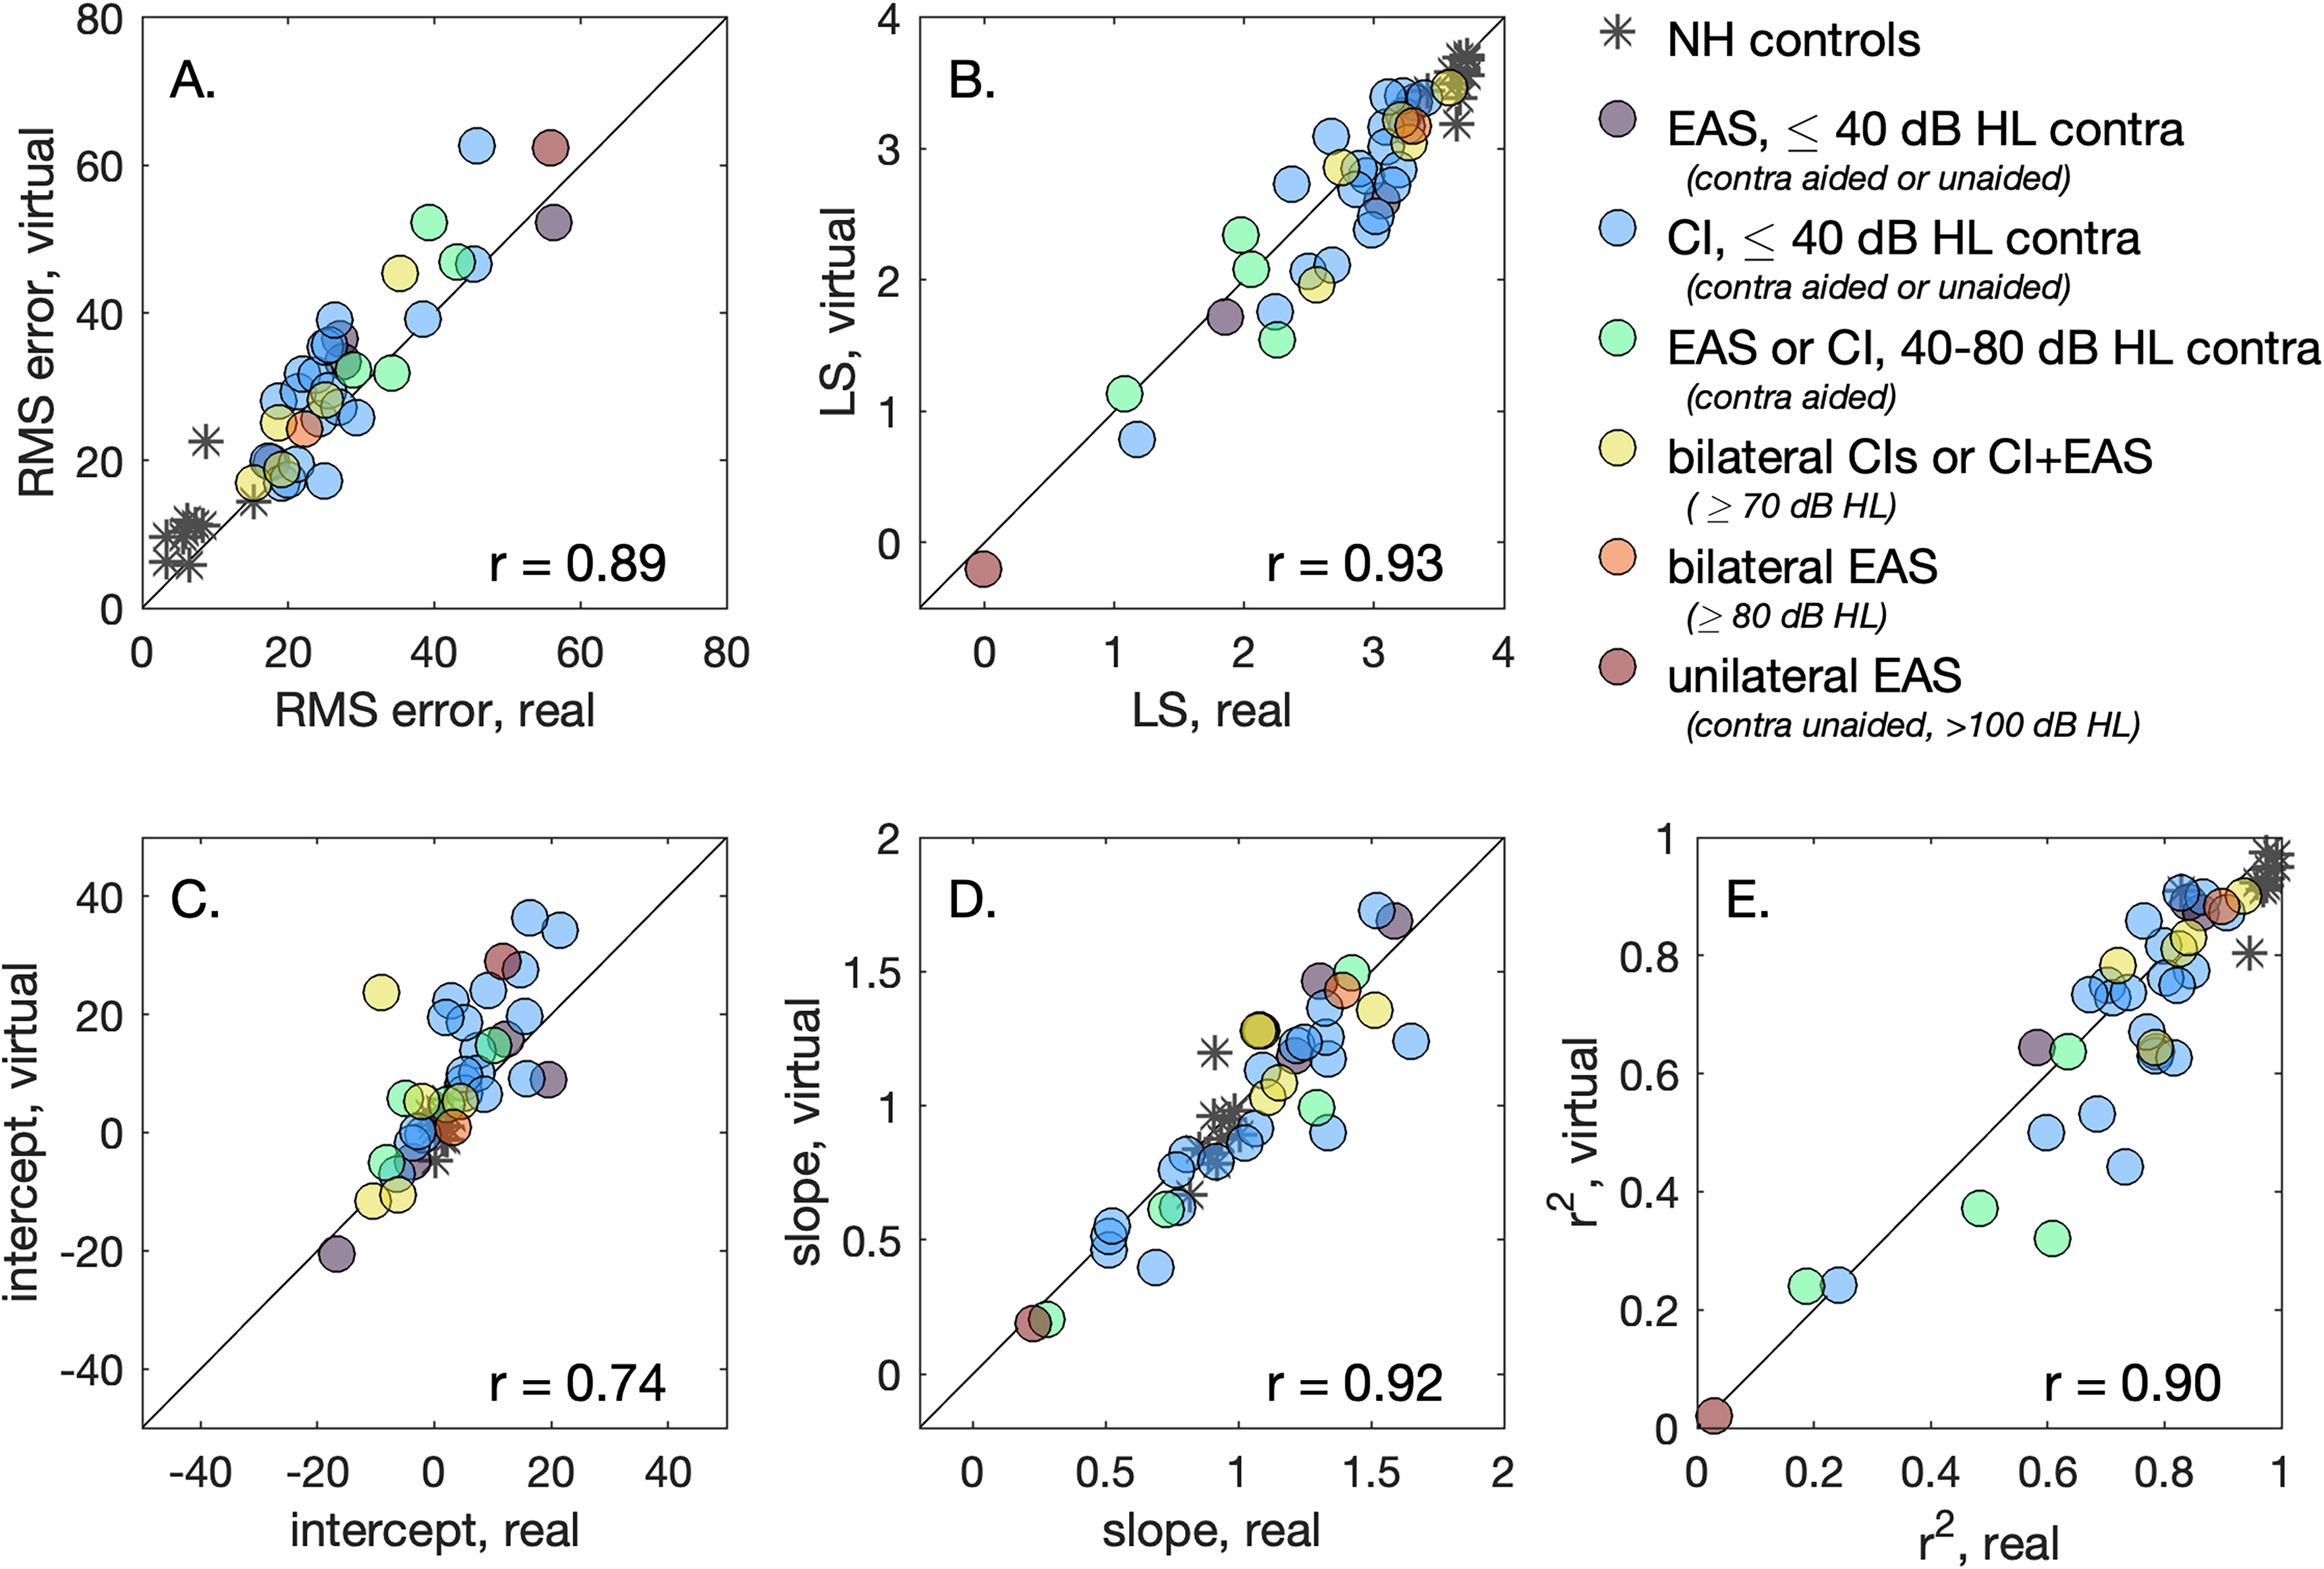
The association between summary localization metrics for real and virtual sources. Marker color reflects participants’ devices and acoustic hearing, as indicated in the legend; data for NH controls are indicated with asterisks. The diagonal line indicates perfect correspondence between values for real and virtual sources, and the observed correlation is indicted at the bottom right of each panel. Panels show results for RMS error (A), localization sensitivity (B), and the intercept (C), slope (D) or r2 (E) of a line fit to participant responses as a function of source (real) or intended source (virtual) location.
There is some evidence that the trends observed for CI and EAS users’ data are also evident in the data of NH controls. For example, the RMS error for NH participants was significantly smaller for real sources than for virtual sources (t = 2.32, p = .016 one-tailed), with mean values of 7.1° and 11.3°, respectively. Supplemental Table S2 provides data for all participants, CI users and NH controls, including each of the five metrics for real and virtual sources.
Discussion
Standard clinical practice of audiology does not currently include objective measures of spatial hearing for CI users, despite its importance for successful outcomes and the sizeable basic science literature on this topic. Research into novel and clinically feasible spatial hearing assessment therefore has high translational significance. Characterizing spatial hearing clinically could identify CI and EAS users who might benefit from remapping or additional intervention (e.g., a HA or change of microphone directionality setting), guide selection of processor type (e.g., BTE vs. off-ear), or provide an evidence base for counseling new CI candidates with respect to likely outcomes. While VBAP has been used extensively in virtual reality applications with closely spaced loudspeakers, its application to the clinical assessment of sound localization using more widely spaced loudspeakers has not been fully explored and could be particularly impactful because it relies on hardware that is already widely available.
The present study evaluated sound localization between −54° and +54° for real and virtual sound sources for adult CI users, including bilateral CI users, unilateral CI users with contralateral acoustic hearing, and EAS users. Performance was characterized using five summary metrics for characterizing localization, and in each case performance for real and virtual sources was strongly correlated, but there were also significant differences. Specifically, virtual sources were associated with higher RMS error, lower LS, greater side bias (intercept), and poorer linear prediction of response based on source location (r2). The lowest correlation between scores for real and virtual sources was observed for side bias, as characterized by the intercept of a line fitted to localization responses as a function of source location or simulated source location. Greater bias for virtual than for real sources may reflect the trend for greater localization bias under conditions of greater stimulus uncertainty (Garcia et al., 2017).
A primary question based on these data is whether the information provided by localization data obtained using virtual sources is accurate enough to guide diagnosis, treatment, or counseling for adult CI users and candidates. This question would require additional data to answer definitively, but some aspects of the data would suggest that the answer is “yes.” In the present dataset, the range of individual differences in RMS error for real sources among CI and EAS users (41°, from 15.3° to 56.3°) was an order of magnitude larger than the mean difference between RMS error estimated with real vs virtual sources (3.9°). This suggests that localization evaluated using virtual sources can broadly characterize individual differences in RMS error. However, clinically meaningful improvements in performance following changes in mapping parameters can be on the order of 4–8° reduction in RMS error from a mean level of 24° (Potts et al., 2019), suggesting that comparing results obtained using different methods (real and virtual sources) could be problematic.
Several other aspects of the procedures used in this study would need to be evaluated and adapted before translation to the clinic. Although sound source localization tends to be an intuitive task, prior experience localizing real sources in the context of ongoing research studies could have affected participants’ performance in the virtual source conditions. The test environment contained visible loudspeakers intermediate between the endpoints at −54° and +54°, which could have affected task performance; visual cues can affect perceived location, particularly when auditory cues are ambiguous (e.g., Montagne & Zhou, 2016). Testing in a standard clinic booth with only two loudspeakers would require additional consideration of visual indicators of possible response locations. Placement of loudspeakers also requires further consideration. For a typical sound booth with loudspeakers mounted in neighboring corners, the angular separation between speakers relative to the listener depends on both the listener's position and the booth dimensions. The present dataset provides preliminary data on using VBAP to characterize localization for loudspeakers at −54° and +54°, but additional data would be required to understand the possible consequences of increases or decreases in loudspeaker separation.
Another topic for additional study is how the choice of stimuli might affect results. Whereas the present study used bursts of speech-shaped noise, a more temporally dynamic stimulus, like a speech sample, could be associated with more salient envelope ITDs, which CI users are known to make use of (e.g., Kerber & Seeber, 2013). It is also possible that the ability to observe benefits of existing and future CI signal coding strategies for providing access to temporal fine structure ITDs (e.g., Laback et al., 2015) could depend on the stimuli and methods for creating virtual sources. VBAP tends to preserve low-frequency ITDs and high-frequency ILDs, with errors related to constructive and destructive interference. While there are more sophisticated approaches for creating virtual sources that avoid these errors, these techniques rely on accurate information about physical characteristics of the room and the listener, or they require more than two loudspeakers to create robust phantom sources (Akeroyd et al., 2007; Wang et al., 2010).
While the importance of localization in CI outcomes is widely recognized, there is currently no consensus on how to measure localization in CI users (Mertens et al., 2022). The present dataset showed that individual differences in localization ability for a noise stimulus presented at real and virtual locations was broadly similar for this sample of CI users. These results suggest that sound source localization with two-speaker amplitude panning may provide clinically useful information when testing with real sources is infeasible.
Supplemental Material
sj-docx-1-tia-10.1177_23312165251340864 - Supplemental material for Estimating Cochlear Implant Users’ Sound Localization Abilities With Two Loudspeakers
Supplemental material, sj-docx-1-tia-10.1177_23312165251340864 for Estimating Cochlear Implant Users’ Sound Localization Abilities With Two Loudspeakers by Emily Buss, Margaret E. Richter, Amanda D. Sloop and Margaret T. Dillon in Trends in Hearing
Supplemental Material
sj-docx-2-tia-10.1177_23312165251340864 - Supplemental material for Estimating Cochlear Implant Users’ Sound Localization Abilities With Two Loudspeakers
Supplemental material, sj-docx-2-tia-10.1177_23312165251340864 for Estimating Cochlear Implant Users’ Sound Localization Abilities With Two Loudspeakers by Emily Buss, Margaret E. Richter, Amanda D. Sloop and Margaret T. Dillon in Trends in Hearing
Supplemental Material
sj-docx-3-tia-10.1177_23312165251340864 - Supplemental material for Estimating Cochlear Implant Users’ Sound Localization Abilities With Two Loudspeakers
Supplemental material, sj-docx-3-tia-10.1177_23312165251340864 for Estimating Cochlear Implant Users’ Sound Localization Abilities With Two Loudspeakers by Emily Buss, Margaret E. Richter, Amanda D. Sloop and Margaret T. Dillon in Trends in Hearing
Footnotes
Ethical Considerations and Informed Consent
Ethical Considerations Study procedures were approved by UNC's Biomedical IRB Board. Informed Consent All subjects provided written consent.
Funding
The author(s) disclosed receipt of the following financial support for the research, authorship, and/or publication of this article: This work was funded in part by MED-EL Corporation.
Declaration of Conflicting Interests
The author(s) declared the following potential conflicts of interest with respect to the research, authorship, and/or publication of this article: All four authors are supported by a research grant awarded to the University of North Carolina by MED-EL Corporation.
Data Availability Statement
Data are available upon reasonable request.
Supplemental Material
Supplemental material for this article is available online.
Notes
References
Supplementary Material
Please find the following supplemental material available below.
For Open Access articles published under a Creative Commons License, all supplemental material carries the same license as the article it is associated with.
For non-Open Access articles published, all supplemental material carries a non-exclusive license, and permission requests for re-use of supplemental material or any part of supplemental material shall be sent directly to the copyright owner as specified in the copyright notice associated with the article.