
Abstract
This study used functional near-infrared spectroscopy (fNIRS) to measure aspects of the speech discrimination ability of sleeping infants. We examined the morphology of the fNIRS response to three different speech contrasts, namely “Tea/Ba,” “Bee/Ba,” and “Ga/Ba.” Sixteen infants aged between 3 and 13 months old were included in this study and their fNIRS data were recorded during natural sleep. The stimuli were presented using a nonsilence baseline paradigm, where repeated standard stimuli were presented between the novel stimuli blocks without any silence periods. The morphology of fNIRS responses varied between speech contrasts. The data were fit with a model in which the responses were the sum of two independent and concurrent response mechanisms that were derived from previously published fNIRS detection responses. These independent components were an oxyhemoglobin (HbO)-positive early-latency response and an HbO-negative late latency response, hypothesized to be related to an auditory canonical response and a brain arousal response, respectively. The goodness of fit of the model with the data was high with median goodness of fit of 81%. The data showed that both response components had later latency when the left ear was the test ear (p < .05) compared to the right ear and that the negative component, due to brain arousal, was smallest for the most subtle contrast, “Ga/Ba” (p = .003).
Introduction
Speech discrimination refers to the ability to differentiate between different speech sounds. This ability is critical for the development of spoken language in infants. An objective measure of speech sound discrimination that is clinically reliable and can be performed in very young infants in the sleep state is therefore needed for evaluating whether an aided infant with hearing loss is achieving auditory perception of sufficient quality to support their language development. The current lack of such a clinically reliable (and easy to perform) test means that decisions about whether a hearing aid is optimally programed for the infant, or whether a cochlear implant would be a superior option to a hearing aid, are often made on the basis of whether or not an already-demonstrable language delay is observed (Varadarajan et al., 2021; Vickers et al., 2016). This “wait and see” strategy inevitably leads to a delay in appropriate intervention for the proportion of infants who are too young to perform speech understanding assessments. The purpose of the current study was to evaluate the potential of functional near-infrared spectroscopy (fNIRS) to address this clinical need in young infants.
Multiple studies with groups of normally hearing infants have shown that those infants (on average) can discriminate between different acoustic properties of sounds. For example, heart rate measures have been used to show that fetuses can discriminate between their mother's voice and a stranger's voice (Kisilevsky et al., 2003) and that infants can discriminate speech sounds (Lee et al., 2023). Two electrophysiological methods are commonly used in research studies to measure speech sound discrimination (Martin et al., 2008). The acoustic change complex (ACC) is a cortical response to a change in a continuous stimulus, where onset responses to both the stimulus and to the change in the stimulus can be seen. Mis-match negativity (MMN) is a small difference (negativity) between the cortical responses to the same sound when presented as an oddball or standard stimulus in an oddball paradigm. ACC has been used in many studies in normal hearing infants (Chen & Small, 2015; Uhler et al., 2018) and clinical populations (Han & Dimitrijevic, 2020; Kumar et al., 2020a, 2020b, 2020c, 2020d). Similarly, MMN and its more recent variants (e.g., Cabrera & Gervain, 2020; Cone et al., 2022; Draganova et al., 2007; Uhler et al., 2018; Zhao et al., 2021) have been performed in both sleeping and awake infants.
Behavioral observation techniques have also been used to show that awake infants, on average, can discriminate speech sounds and detect frequency and amplitude modulations (Houston et al., 2007), although the detection of amplitude modulation may continue to mature till teenagerhood (Walker et al., 2019).
The reasons that the above techniques have not been adopted into clinical practice are varied. All three of the abovementioned techniques require specialist equipment and clinician expertise. Behavioral techniques also require an infant to be awake and to be in a good response state. Furthermore, the success of the test depends on nonhearing factors such as motor and cognitive development, attention span and external factors. Most studies report that ACC can be robustly obtained provided that the participant is awake and has robust cortical evoked responses. However, these two provisos present a challenge for using the technique in infants who are very young or have auditory neuropathy. Uhler et al. (2018), for example, demonstrated that the ACC response could not show discrimination between /a/ and /i/ vowels in sleeping infants, either at group or individual level. Finally, it is a challenge for all of these techniques to be accurate enough for clinical decision-making in individual infants.
The fNIRS technique has the potential to overcome several of the above issues, in that it measures a cortical hemodynamic response that is not adversely influenced by the sleep state of the infant (Taga et al., 2018), or by the neural dis-synchrony associated with some forms of auditory neuropathy. The ability to perform an easy nonbehavioral test in the sleep state is critical if the aim is to optimally fast track early intervention for infants newly diagnosed with a hearing impairment.
fNIRS has been successfully used to measure speech discrimination responses in awake and sleeping infants (Lloyd-Fox et al., 2019; Mao et al., 2021; Nakano et al., 2009). Those cited studies employed a habituation/dishabituation paradigm, which involves multiple presentations of standard speech stimuli blocks to habituate the brain responses, followed by the presentation of novel speech stimuli blocks to dishabituate the brain responses. While this paradigm is suitable for studying group-level responses, it is time-consuming and not ideal for measuring responses in individual infants—testing that requires multiple repetitions to increase the test confidence. In this study, we adopted a nonsilence baseline paradigm, in which a repeated standard speech stimulus is used as the baseline instead of silence and the change in response from baseline evoked by novel stimulus blocks indicates discrimination of the standard and novel speech stimuli. This paradigm is similar in principle to the ACC paradigm used in cortical evoked response measurements (e.g., Chen & Small, 2015). In a previous fNIRS study by Arimitsu et al. (2018), a similar paradigm was used to investigate the differences in the hemodynamic response patterns between term and preterm infants in response to stimuli containing phonemic and prosodic contrasts. The authors reported a high proportion of atypical hemodynamic response patterns, referred to as inverted responses and found a higher occurrence rate of 25–45% of this response pattern in preterm (<38 weeks gestation) infants compared to 5–30% rate in term (>38 weeks gestation) infants.
The expected canonical hemodynamic response pattern evoked by auditory stimuli in adults (Luke et al., 2021; Shader et al., 2021; Weder et al., 2018) is characterized by an increase in oxyhemoglobin (HbO) during the stimulus and a return to baseline afterwards. In infants, differing hemodynamic response patterns to auditory stimuli have been reported, including the canonical response shape (Katus et al., 2023; Mao et al., 2021), inverted responses or “U” shapes (Cabrera & Gervain, 2020; Zhang et al., 2022). These variations have been attributed to differences in experiment design and stimulus complexities (e.g., Issard & Gervain, 2018). However, in our previous paper, Lee et al. (2024) proposed that the reported variation in fNIRS response morphology could be explained by the presence of two independent components that occur concurrently: one positive HbO response of standard canonical shape and one longer-latency negative response. The latter component rapidly habituated over the duration of the experiment and could be clearly observed when longer measurement epochs (around 30 s) were used. Lee et al. (2024) proposed that the negative HbO component was associated with a brain arousal response evoked by the auditory stimulus.
This study aimed to investigate the morphology of the fNIRS discrimination response evoked by novel speech stimuli presented using a nonsilence baseline paradigm and to evaluate whether the variability in response morphology could be explained by similar interactions of the same two independent response components that were seen in the previously published detection responses (Lee et al., 2024). We also aimed to examine differences in the fNIRS response to speech contrasts with varying degree of acoustic difference. The findings of this study will contribute to the development of an accurate model of the fNIRS response for discriminating auditory stimuli using the nonsilence baseline paradigm and identify potential features that differentiate the response to different speech contrasts.
Materials and Methods
Participants
Sixteen infants (eight males/eight females) with no known hearing loss participated in the study. The age of the infants ranged from 3 to 13 months (mean 7.4 months). All infants had passed newborn hearing screening or diagnostic audiological investigations. They also passed otoscopic examination and tympanometry testing (probe tone 226 Hz or 1 kHz as appropriate for age) on the test day. All parents reported no concerns about their child's overall health and had given their consent. An additional nine infants were excluded because five infants did not sleep in the lab, two infants failed the tympanometry test and in two infants the fNIRS cap had shifted by the end of the experiment. This study complied with the Declaration of Helsinki and was approved by the Royal Children's Hospital human ethics committee (project number 71941).
Stimuli
The speech tokens used in this study were natural recordings of consonant-vowel syllables “Ba,” “Tea,” “Bee,” and “Ga.” The “Ba” speech token was used as the standard stimulus and “Tea,” “Bee,” and “Ga” speech tokens were used as novel stimuli. The process of recording and calibrating the stimuli was reported in our previous study (Lee et al., 2024). Each speech token was trimmed to 0.45 s and average F0 equalized using Praat software (Boersma, 2001). For every speech token, a set of nine token variations was generated by shifting the F0 ± 1 Hz and jittering the intensity by ±2 dB. Each novel 5.4-s stimulus block was formed by concatenating and alternating six novel and six standard speech tokens, selected randomly from their respective variations, starting with the novel stimulus. All stimuli were presented monaurally at 65 dB SPL (±2 dB) using an ER3A insert earphone, with the test ear being left and right ear in an equal number of infants (n = 8). Only one ear was tested as the test session had to be completed within the infant's sleep cycle. Stimuli were adjusted (before jitter applied) to have equal RMS intensity to a 1 kHz tone of 65 dB SPL, measured in a 2 cc coupler.
The three speech contrasts differed in the degrees of acoustic contrast. The speech contrast “Tea/Ba” differed in vowel spectral peaks, consonant place of articulation and voicing cues. “Bee/Ba” differed in vowels only and “Ga/Ba” differed in consonant place of articulation only. “Tea/Ba” has the most discriminable cues and was expected to be the easiest speech contrast to discriminate. On the other hand, “Ga/Ba” has the least discriminable cue and was expected to be the hardest speech contrast to discriminate.
fNIRS Data Acquisition
A 64-channel continuous-wave NIRScout device (NIRx Medical Technologies, LCC) coupled with flat LED optodes was used to acquire infant fNIRS data. This fNIRS system emits two lights at wavelengths of 760 nm and 850 nm. We used eight sources and eight detectors, with a total of 18 channels formed for each wavelength of light. The channels were arranged in a montage designed to cover the auditory and prefrontal areas in each hemisphere. Figure 1 illustrates the optode montage and sensitivity profile of the optode arrangement and the four regions of interest (ROIs): left and right temporal and prefrontal regions. This study did not use short channels due to the practical limitation of placing a source-detector pair only 0.2 cm apart, which is considered the effective short channel length in infants to isolate the surface vasculature signals while preserving the response signals (Brigadoi & Cooper, 2015). The sensitivity profile of our fNIRS measurement in Figure 1 was illustrated using the AtlasViewer toolbox (Aasted et al., 2015).
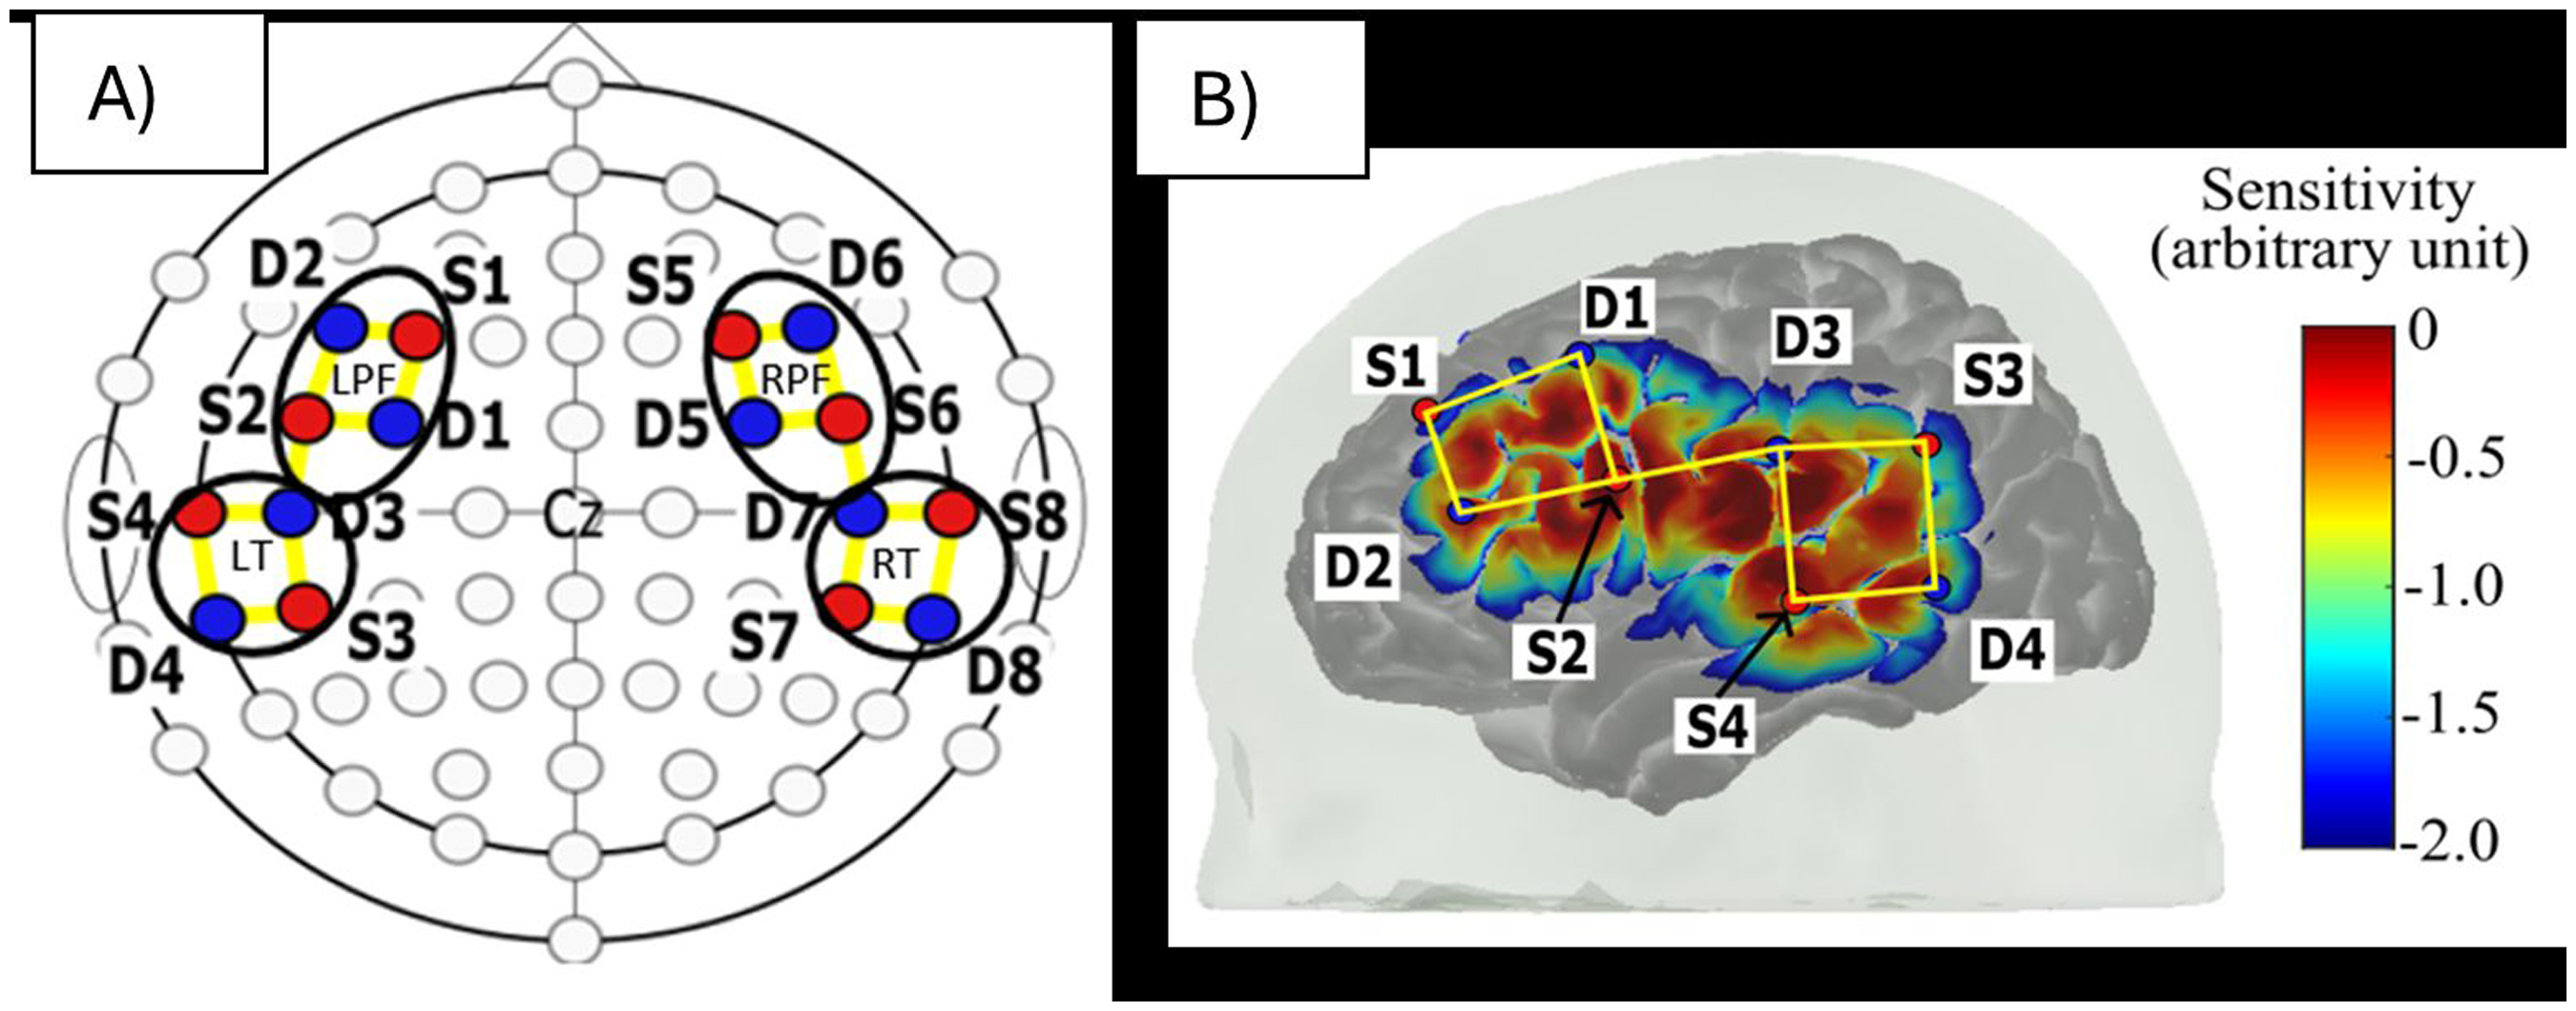
Optode montage. (A) The hemispheric-symmetrical arrangement of optodes used in an International 10-10 System. The sources are positioned over F3/4, FC5/6, CP5/6, and T7/8, whereas the detectors are positioned over FC3/4, F5/6, C5/6 and TP7/8. Red circle = source, blue circle = detector and yellow line = channels. The black circles enclose the four defined regions of interest: left and right temporal and prefrontal regions. (B) The sensitivity profile of our fNIRS measurements on the left hemisphere of the brain.
Procedures
Stimuli were presented using the presentation protocol shown in Figure 2. The presentation started with 5 min of repeated “Ba” baseline to habituate the brain responses to this standard stimulus. The novel stimulus block was presented immediately following the baseline with no silent interval. The novel stimulus blocks for each of the three novel contrast stimuli were presented in groups of three sequential trials, but with the order of contrasts randomized for each group. A total of 20 trials were presented for each of the three contrasts. Novel blocks were separated by a repeating “Ba” baseline with duration randomized between 22.0 and 32.0 s. This protocol required approximately 37 min to complete. All participants were tested during natural sleep, held by a parent who was seated in a comfortable chair in a dimly-lit room.
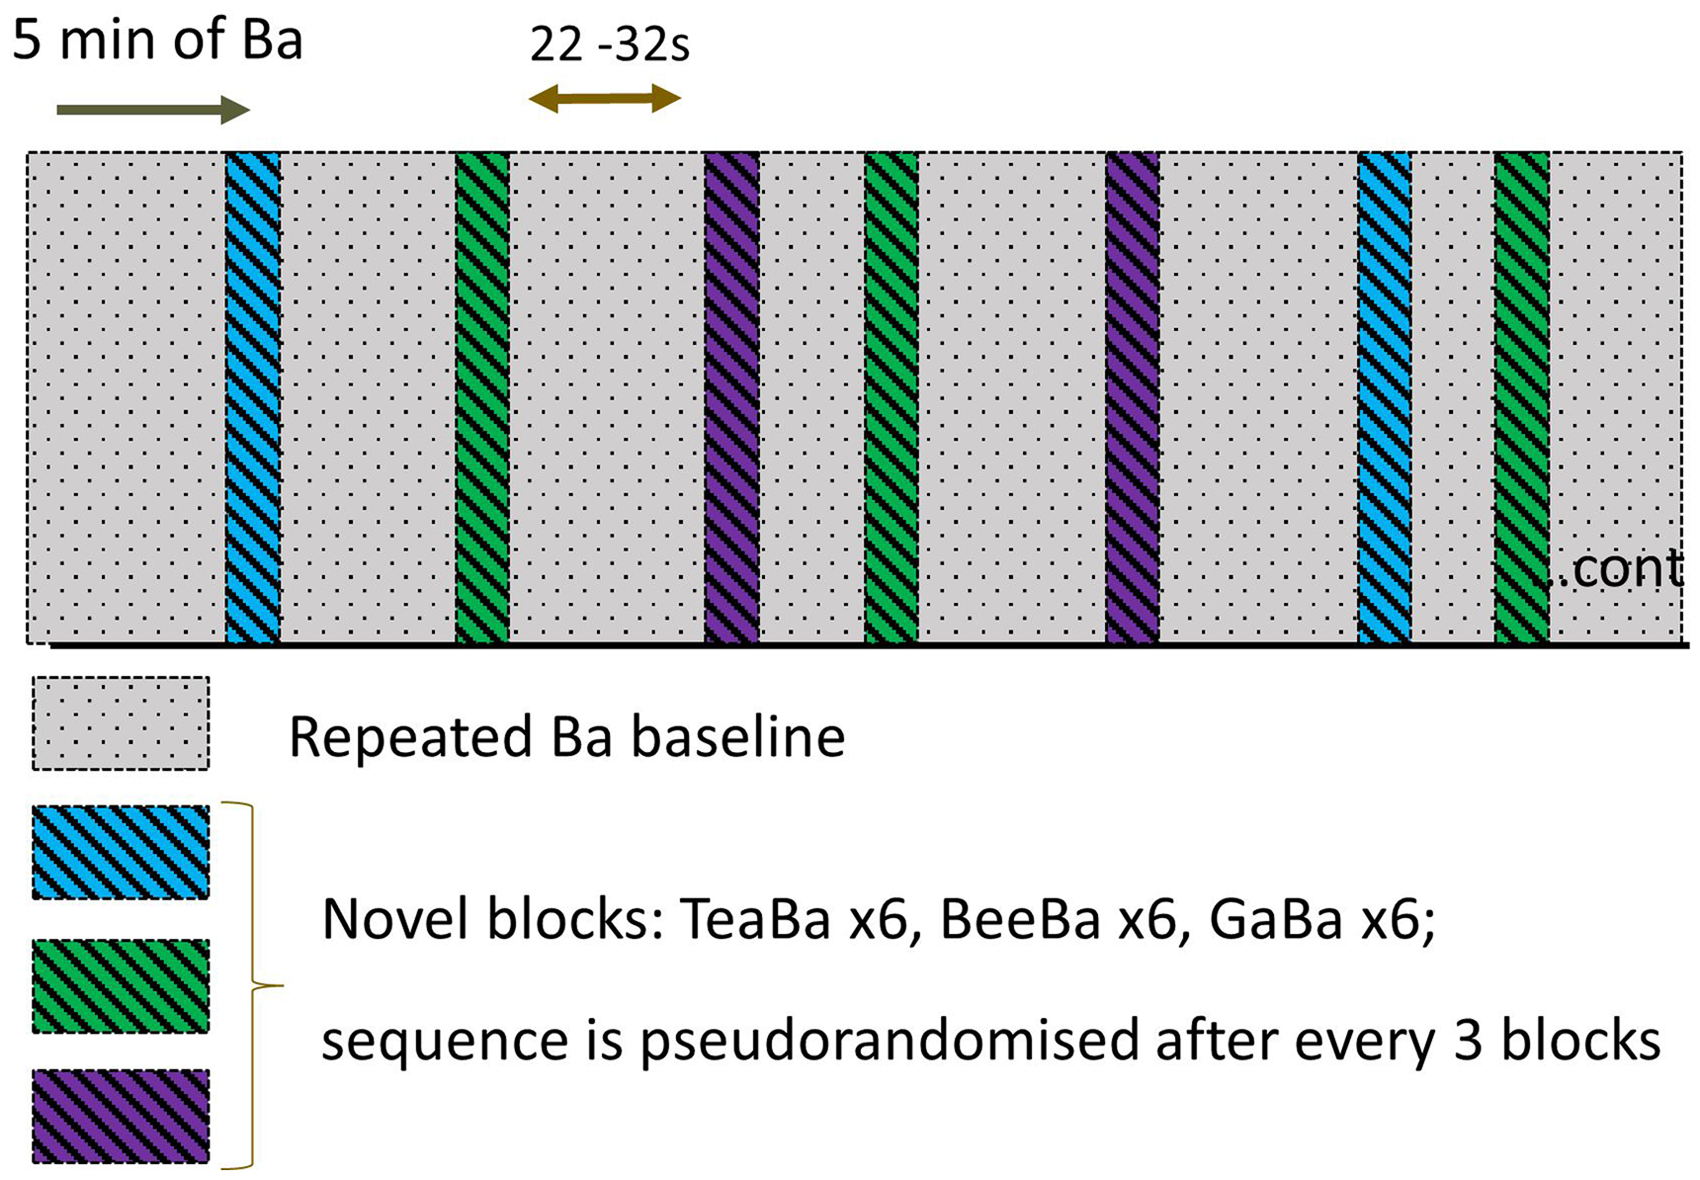
Schematic of the stimulus protocol. The procedure started with 5 min of nonsilence baseline (repeating “Ba” stimulus), followed by novel stimulus blocks where the contrast speech sound was alternated with “Ba.” The nonsilence baseline continued between novel blocks. A total of 20 trials of each of the three contrasts were presented.
Data Preprocessing
fNIRS data were preprocessed using the Brain AnalyzIR toolbox (Santosa et al., 2018). The raw light intensity data were first converted to optical density. The signal quality per channel was evaluated using the Scalp Coupling Index function (Pollonini et al., 2014), which calculates the correlation of signals between two channels from the same source–detector pair but with different light wavelengths. A low correlation coefficient, defined as below 0.75 in this study, suggested poor contact between the optodes and the scalp. A total of 5.6% of channels were found to have a threshold below 0.75 and were discarded.
Motion artifacts and physiological noises were corrected using the Temporal Derivative Distribution Repair function (Fishburn et al., 2019) and by filtering the data using a bandpass Butterworth filter with cutoff frequencies at 0.01 and 0.25 Hz. The processed optical density data were then converted to oxy- and deoxy-hemoglobin (HbO and HbR, respectively) using the modified Beer–Lambert law with a partial pathlength factor of 0.1. The data were epoched between −3.0 and 27.4 s relative to the stimulus onset and baseline corrected by subtracting the average of hemodynamic concentration change between −3.0 and 0 s from stimulus onset. An additional 2.68% of epochs were rejected because these epochs either had extreme values exceeding
Model Fitting
For each speech contrast, ROI and test ear, a grand average waveform was derived by first averaging the response epochs over the trials and then over subjects. To test our hypothesis that the discrimination responses consisted of two concurrent response components, a model was fit to each grand average HbO response waveform in which the response was assumed to be a sum of two response components. The templates of the two response components are shown in Figure 3 and they were derived by Lee et al. (2024) using Independent Component Analysis on detection response data using data from all fNIRS channels and all trials (averaged across subjects). The model used these templates to derive the best fit to the discrimination data in this experiment for each ROI, test ear and speech contrast. In the model, both the amplitude and latency of the template components were allowed to vary within limitations. The amplitudes were limited by the maximum range of the fNIRS response amplitudes across all conditions in the same test ear and the latency values were limited to that of the template ±5 s for each component. The early-latency component was constrained to have a positive amplitude, and the late-latency component was constrained to have a negative amplitude.

The two HbO response components (arbitrary amplitude) derived via independent component analysis from detection data of Lee et al. (2024). These templates were used in the current study with limited ranges of amplitude and latency as fitting parameters.
Results
Figure 4 shows the grand average HbO (red) and HbR (blue) fNIRS responses for each speech contrast in the four ROIs and for the two test ears. The HbR responses were anticorrelated with the HbO responses, as expected and consistent with the data being largely unaffected by nonbrain activity. The morphology was, in general, very similar to the detection responses seen in Lee et al. (2024), consisting of either or both early positive peaks and later negative troughs. It is notable that the “Ba/Ga” contrast evoked very little negative arousal response compared to the other contrasts and the positive component for that contrast had a later latency than for other contrasts, suggesting that the subtlety of contrast might be reflected in the degree of arousal and the latency of the positive-going auditory HbO response.

HbO (solid red lines) and HbR (solid blue lines) waveforms, averaged across epochs, channels in each ROI and across subjects. The left and right columns are results from infants with left and right ear stimulation, respectively and rows are results for the three different speech contrasts. The dashed red lines are model fits to the HbO data. LPF, RPF signify left and right prefrontal ROIs respectively, and LT, RT signify left and right temporal ROIs respectively.
The best model fit to the HbO data (red dashed lines) and the goodness of fit of the model to the data are shown in Figure 4. Out of the 24 conditions (contrast/ROI/test ear) the median R2 was 0.81 and only one condition (contrast “Ga/Ba”/ right temporal ROI/right test ear) had an R2 less than 0.5, suggesting that the model was a good representation of the discrimination response morphology and thus that the same two components can be seen in both detection and discrimination data in sleeping infants.
Four 3-way ANOVAs were conducted with factors ROI, contrast and test ear on the four fitting parameters to explore whether the amplitude or latency of the two response components were affected by these factors. To evaluate further any found significant effects of ROI or contrast, post-hoc tests were conducted with the Holm–Sidak method, which compensated for multiple comparisons using an overall significance value of 0.05. The data passed tests of normality and equal variance in all cases before ANOVA was conducted. Appendix A shows the full statistical results of the four ANOVAs in Tables A1–4.
For the amplitude of the early-latency positive component, there was no significant effect of test ear or ROI, but a significant effect of contrast (p = .024). Post-hoc tests showed that “Bee/Ba” evoked a smaller amplitude than “Ga/Ba” (p = .028). The latency of this positive component was significantly affected by both contrast (p = .016) and test ear (p = .034), with the left test ear having a later latency than the right test ear. Post-hoc tests on contrast showed that the latency of the “Ga/Ba” response was later than that evoked by “Tea/Ba” (p = .03) and “Bee/Ba” (p = .03). To investigate the effect of test ear on latency further, a one-tailed paired t-test was conducted with factor test ear, paired across the factors contrast and ROI. This test showed that the left test ear response was later than the right ear response (p = .025) by a mean of 1.3 s.
For the amplitude of the late-latency negative response, the three-way ANOVA revealed a significant effect of contrast only (p = .003), with the amplitude evoked by “Ga/Ba” being significantly smaller than that evoked by “Bee/Ba” (p = .006) and “Tea/Ba” (p = .008). The latency of this negative HbO response was only affected by the test ear factor (p = .005), with the left ear response lagging the right ear response by a mean of 3.8 s.
Discussion
The nonsilence baseline protocol used in this study evoked discrimination responses to pairs of speech sounds in sleeping infants that had a very similar morphology to those evoked by detection of speech sounds in a silent baseline (Lee et al., 2024). In both cases, the morphology (and variations in morphology) could be explained by a model in which the HbO responses were a sum of two concurrent components: an early latency positive-going canonical response component, consistent with activation of the auditory pathways; and a later-latency negative-going response component that we propose is due to the activation of the arousal networks in the brain. The morphology of the negative going HbO response is very similar to that measured by Näsi et al. (2012) when combining fNIRS measures with EEG to detect spontaneous arousal events during sleep.
Further support of the proposal for two concurrent response mechanisms is provided in these data by the different ways they are affected by speech contrast and test ear. The early-latency positive response is smallest for the “Bee/Ba” contrast, whereas the later-latency negative response is much smaller for the most subtle contrast (“Ga/Ba”) compared to both other contrasts. If the negative response component is indeed caused by arousal mechanisms, it is plausible that different degrees of speech contrast may evoke different amplitudes of this response, leading to potential methods to evaluate how salient speech contrasts are for individual infants with hearing impairment. The latency of the positive component was also significantly affected by the subtlety of the contrast, with “Ga/Ba” evoking the latest positive response component.
Given the above effects of degree of contrast on latency of the positive component and the amplitude of the negative component, it was somewhat surprising that the amplitude of the early positive response was smallest for the “Bee/Ba” contrast. In common with an earlier paper by our group (Mao et al., 2021) which used a different stimulus presentation paradigm and different contrasts, we did not find that the amplitude of the early positive response varied systematically with contrast subtlety. Since the two ICA components significantly overlapped in time, it is possible that the ICA components in Figure 3 did not fully separate the components in the first 5 s after stimulus onset, leading to some uncertainty in the magnitude of the early positive component.
One intriguing and consistent result was the effect of test ear on latency. For both components the response evoked by stimulating the left ear was delayed compared to the response when stimulating the right ear. It should be noted here that the left and right test-ear groups were different infants, therefore it is possible that the effect was due to infant characteristics rather than test ears per se. The age range was not significantly different in left and right test ear groups (means of 33.6 vs. 29.9 weeks, respectively; t-test p = .650), however the left test-ear group had significantly more male members than the right test-ear group (9 vs. 3; Fisher exact test p = .02). A previous study (Alexopoulos et al., 2022) examined the effect of sex on neonatal fNIRS responses to speech stimuli and found that, although there were sex differences in the amplitudes in certain regions of interest, there was not a significant sex effect on latency, except for the male responses being more variable in latency. Therefore, we propose that it is unlikely that the effect of test ear on latency in this experiment is due to sex or age differences in the two test-ear groups. Instead, we hypothesize that the latency effect may be related to the lateralization of brain function for language.
In this experiment, all the stimuli were natural speech tokens and the brain responses were evoked by a change of speech sounds. Therefore, the responses are due to activity of mechanisms that support receptive language processing. It is well known that, in general, the left hemisphere in the human brain is the dominant hemisphere for language processing (Friederici, 2011; Vigneau et al., 2006). Due to modern imaging techniques, we know that left lateralization of language processing is typically already present in neonates (e.g., Vannasing et al., 2016). Although both left or right ear stimulation activate the left hemisphere, the contralateral neural pathway (from the right ear) is more direct (shorter) and stronger than the ipsilateral pathway to the left hemisphere. This difference in ipsilateral and contralateral pathways may contribute to the left ear stimulation producing responses with a later latency than the right ear stimulation.
This study was performed with normally hearing infants, on the assumption that they could all distinguish between the different speech syllables perceptually, as demonstrated behaviorally by Houston et al. (2007). Hearing loss, however, imposes challenges for discrimination even when an individual is adequately aided (e.g., Pekkarinen et al., 1990). In applying this fNIRS test to infants with hearing loss, it would be anticipated that a smaller proportion of them would show a response to a contrast. If the interpretation of effects of contrast difficulty in this study is correct, we would also anticipate overall morphology differences based on longer latencies of the positive component and smaller amplitude of the negative component compared to the same stimulus pairs in normally hearing infants. These effects, together with greater variability between hearing impaired individuals, would have an effect on the amplitude and overall morphology of any group-level response.
Current fNIRS response analysis frameworks such as the generalized linear model require a response model to estimate the brain activity (Barker et al., 2013). The morphology of the fNIRS speech discrimination response for sleeping infants illustrated in this study enables future studies to build a more accurate response model to measure speech discrimination ability. Potentially, this model could be used to improve the reliability of discrimination tests using fNIRS at an individual level. Two examples of individual infant responses from this data set are shown in Appendix B. It can be seen that the responses of subject C054 fit the two-response model with R2 > 0.5 for every contrast and ROI, whereas C073's response to the “Ga/Ba” contrast was poor compared to their response to the other two contrasts. Future analysis frameworks also need to consider the dynamic change of fNIRS responses over time as habituation effects may affect positive and negative components differently (Lee et al., 2024), leading to overall morphology changes across an experiment.
Conclusions
We have demonstrated that aspects of speech discrimination can be measured using the nonsilence baseline paradigm described here. The different speech contrasts evoked responses with different morphologies, which were consistent with the sum of two concurrent response components. Both components were affected by the speech contrast, with the most subtle, “Ga/Ba,” having a positive component with later latency than the other contrasts and having a negative component of much smaller amplitude than the other contrasts. Further research is needed in larger groups of infants with both normal and impaired hearing to confirm these results and to investigate how these findings might be applied in individual infants to provide clinically-relevant information. In this study, we showed a clear latency difference between responses to left and right ear stimulation, which supports the existence of lateralization of the language processing mechanisms in these young infants.
Supplemental Material
sj-docx-1-acr-10.1177_23312165241311721 - Supplemental material for Measuring Speech Discrimination Ability in Sleeping Infants Using fNIRS—A Proof of Principle
Supplemental material, sj-docx-1-acr-10.1177_23312165241311721 for Measuring Speech Discrimination Ability in Sleeping Infants Using fNIRS—A Proof of Principle by Onn Wah Lee, Demi Gao, Tommy Peng, Julia Wunderlich, Darren Mao, Gautam Balasubramanian and Colette M. McKay in Trends in Hearing
Supplemental Material
sj-jpg-2-tia-10.1177_23312165241311721 - Supplemental material for Measuring Speech Discrimination Ability in Sleeping Infants Using fNIRS—A Proof of Principle
Supplemental material, sj-jpg-2-tia-10.1177_23312165241311721 for Measuring Speech Discrimination Ability in Sleeping Infants Using fNIRS—A Proof of Principle by Onn Wah Lee, Demi Gao, Tommy Peng, Julia Wunderlich, Darren Mao, Gautam Balasubramanian and Colette M. McKay in Trends in Hearing
Supplemental Material
sj-jpg-3-tia-10.1177_23312165241311721 - Supplemental material for Measuring Speech Discrimination Ability in Sleeping Infants Using fNIRS—A Proof of Principle
Supplemental material, sj-jpg-3-tia-10.1177_23312165241311721 for Measuring Speech Discrimination Ability in Sleeping Infants Using fNIRS—A Proof of Principle by Onn Wah Lee, Demi Gao, Tommy Peng, Julia Wunderlich, Darren Mao, Gautam Balasubramanian and Colette M. McKay in Trends in Hearing
Supplemental Material
sj-docx-4-acr-10.1177_23312165241311721 - Supplemental material for Measuring Speech Discrimination Ability in Sleeping Infants Using fNIRS—A Proof of Principle
Supplemental material, sj-docx-4-acr-10.1177_23312165241311721 for Measuring Speech Discrimination Ability in Sleeping Infants Using fNIRS—A Proof of Principle by Onn Wah Lee, Demi Gao, Tommy Peng, Julia Wunderlich, Darren Mao, Gautam Balasubramanian and Colette M. McKay in Trends in Hearing
Supplemental Material
sj-docx-5-acr-10.1177_23312165241311721 - Supplemental material for Measuring Speech Discrimination Ability in Sleeping Infants Using fNIRS—A Proof of Principle
Supplemental material, sj-docx-5-acr-10.1177_23312165241311721 for Measuring Speech Discrimination Ability in Sleeping Infants Using fNIRS—A Proof of Principle by Onn Wah Lee, Demi Gao, Tommy Peng, Julia Wunderlich, Darren Mao, Gautam Balasubramanian and Colette M. McKay in Trends in Hearing
Supplemental Material
sj-docx-6-acr-10.1177_23312165241311721 - Supplemental material for Measuring Speech Discrimination Ability in Sleeping Infants Using fNIRS—A Proof of Principle
Supplemental material, sj-docx-6-acr-10.1177_23312165241311721 for Measuring Speech Discrimination Ability in Sleeping Infants Using fNIRS—A Proof of Principle by Onn Wah Lee, Demi Gao, Tommy Peng, Julia Wunderlich, Darren Mao, Gautam Balasubramanian and Colette M. McKay in Trends in Hearing
Supplemental Material
sj-docx-7-acr-10.1177_23312165241311721 - Supplemental material for Measuring Speech Discrimination Ability in Sleeping Infants Using fNIRS—A Proof of Principle
Supplemental material, sj-docx-7-acr-10.1177_23312165241311721 for Measuring Speech Discrimination Ability in Sleeping Infants Using fNIRS—A Proof of Principle by Onn Wah Lee, Demi Gao, Tommy Peng, Julia Wunderlich, Darren Mao, Gautam Balasubramanian and Colette M. McKay in Trends in Hearing
Footnotes
Acknowledgments
The authors would like to thank the Victorian Infant Hearing Screening Program (VIHSP) for its support in participant recruitment.
Data Sharing
The raw anonymized fNIRS signals associated with this research are available by applying to the corresponding author.
Declaration of Conflicting Interests
The authors declared the following potential conflicts of interest with respect to the research, authorship, and/or publication of this article: A patent application has been submitted related to the contents of this paper (IP Australia 2022901011). The authors may obtain financial benefit from future use of that patent in a commercial device.
Funding
The authors disclosed receipt of the following financial support for the research, authorship, and/or publication of this article: This work was supported by the Medical Research Future Fund, Garnett Passe and Rodney Williams Memorial Foundation, MTPConnect, Victorian Government Medical Research Acceleration Fund, National Health and Medical Research Council (Grant Nos. MRF2018621, BMTH 03, and 1154233).
Supplemental Material
Supplemental material for this article is available online.
References
Supplementary Material
Please find the following supplemental material available below.
For Open Access articles published under a Creative Commons License, all supplemental material carries the same license as the article it is associated with.
For non-Open Access articles published, all supplemental material carries a non-exclusive license, and permission requests for re-use of supplemental material or any part of supplemental material shall be sent directly to the copyright owner as specified in the copyright notice associated with the article.