
Abstract
Cochlear implant (CI) users often complain about music appreciation and speech recognition in background noise, which depend on segregating sound sources into perceptual streams. The present study examined relationships between frequency and fundamental frequency (F0) discrimination with stream segregation of tonal and speech streams for CI users and peers with no known hearing loss. Frequency and F0 discrimination were measured for 1,000 Hz pure tones and 110 Hz complex tones, respectively. Stream segregation was measured for pure and complex tones using a lead/lag delay detection task. Spondee word identification was measured in competing speech with high levels of informational masking that required listeners to use F0 to segregate speech. The hypotheses were that frequency and F0 discrimination would explain a significant portion of the variance in outcomes for tonal segregation and speech reception. On average, CI users received a large benefit for stream segregation of tonal streams when either the frequency or F0 of the competing stream was shifted relative to the target stream. A linear relationship accounted for 42% of the covariance between measures of stream segregation and complex tone discrimination for CI users. In contrast, such benefits were absent when the F0 of the competing speech was shifted relative to the target speech. The large benefit observed for tonal streams is promising for music listening if it transfers to separating instruments within a song; however, the lack of benefit for speech suggests separate mechanisms, or special requirements, for speech processing.
Introduction
Cochlear implants (CIs) restore an impressive amount of hearing to people who would otherwise be profoundly deaf. Most recipients attain high levels of speech comprehension in quiet through their devices without relying on lipreading or other visual cues (Wilson & Dorman, 2008). However, music perception and speech comprehension in competing talker background noise are notably poor and widely varied compared to people with normal hearing (Gfeller et al., 2007; Looi et al., 2012; O’Neill et al., 2019). These challenging areas of audition require listening to multiple sound sources, with attention often switching from one engaging sound stream to another. For music and speech, the fundamental frequency (F0) of incoming sounds serves as an important cue allowing people to hear out instruments of a musical ensemble or voices within a crowded room (Bregman, 1990; Bronkhorst, 2015). CI users typically have poor frequency and F0 discrimination compared to their peers with normal hearing, which likely contributes to their difficulties hearing out instruments of an ensemble and to their struggles with understanding speech when other people are talking (Gfeller et al., 2007; Goldsworthy, 2015). Furthermore, some aspects of pitch perception for CI users driven by temporal-envelope cues have been found to be easily masked even by spectrally remote maskers (Mehta & Oxenham, 2018). This article summarizes a study of CI users, with a control group of people with no known hearing loss, designed to characterize the role of frequency and F0 discrimination on auditory stream segregation for tonal and speech streams.
The basic psychophysics of stream segregation has been explored in people with normal hearing for more than fifty years (Bregman, 1990; Bregman & Campbell, 1971; Miller & Heise, 1950). Early work focused on segregation and streaming build-up of simple tonal sequences, but later work continuously drew connections to mechanisms of speech processing when multiple people are talking (Bronkhorst, 2015). A primary hypothesis stemming from this foundational work is that sequential stream segregation is directly related to the degree of perceptual difference between sounds, such as pitch, timbre, and loudness (Moore & Gockel, 2012). This hypothesis has been explored in CI users, taking advantage of their wide range of perceptual abilities to characterize how basic sensitivity affects aspects of stream segregation. Early studies demonstrated that both place and rate of electrical stimulation could be used as a streaming cue, as place would translate to the spectral cue, and the rate would translate to the periodicity cue, both contributing to pitch perception (Chatterjee et al., 2006; Duran et al., 2012; Hong & Turner, 2006). The study of Hong and Turner (2006) specifically concluded that better stream segregation of pure tones was associated with better understanding of speech in noise. Recent work has shown that the relative salience of pitch accounts for the contribution of place and rate of electrical stimulation to segregation and streaming of simple stimulation patterns (Paredes-Gallardo et al., 2018a, 2018b). This evidence indicates that CI users can segregate and stream sounds based on place and rate of electrical stimulation with better separation of sounds with increasing pitch salience.
The evidence is positive: CI users have the basic mechanism of auditory stream segregation that could support the more demanding segregation tasks needed to understand speech when multiple people are talking. Unfortunately, there is little evidence that CI users use F0 cues to segregate competing talkers despite many of them having discrimination thresholds better than a semitone (Bissmeyer & Goldsworthy, 2022; Goldsworthy, 2015). Quite the contrary, several studies have shown that CI users do not receive benefit when a competing talker has a different F0 than the target talker (Cullington & Zeng, 2008; Stickney et al., 2004, 2007). In other words, CI users do not receive masking release based on differences in voice pitch. This deficiency is likely connected to the general lack of benefit derived from glimpsing when listening at relatively sparse background noise. The study of Cullington & Zeng, 2008, found that people with normal hearing receive about a 15 dB benefit when listening to speech with only one competing talker compared to more spectrally and temporally dense competition with three or four competing talkers. In contrast, CI users performed just as poorly with one, two, three, or four competing talkers, thus receiving little to no masking release when the background noise is less dense. Several other studies have also shown that CI users receive little or no benefit from glimpsing in relatively sparse background noise (Gaudrain & Carlyon, 2013; Nelson et al., 2003; Qin & Oxenham, 2003).
In summary, evidence suggests that CI users can segregate and stream tonal sequences based on place and rate of electrical stimulation, but they are unable to derive masking release based on F0 cues of spoken speech. The present study was designed to test how frequency and F0 discrimination affects stream segregation of pure and complex tone sequences as well as masking release based on F0 cues for spoken speech. For the tonal sequence stream segregation task, we used a procedure motivated by companion articles by Paredes-Gallardo and colleagues investigating the relative strength of place and rate of electrical stimulation as cues for stream formation (Paredes-Gallardo et al., 2018a, 2018b). The participants must detect a delay in the last sound of a target stream in the presence of an irregular distractor stream. This paradigm has also been used to investigate the role of spectral and temporal cues on stream segregation in normal hearing (Nie et al., 2014; Nie & Nelson, 2015). For measuring masking release for speech within competing speech, we used a new procedure with the competing speech designed with exceptionally high levels of informational masking to force listeners to use F0 cues to segregate target speech (Brungart, 2001). The primary hypotheses are that frequency and F0 discrimination partially explain the variance in outcomes of CI users for segregation of tonal and speech streams.
Methods
Overview
CI users and people with no known hearing loss older than 13 years of age took part in a listening experiment conducted remotely using a custom-made web application for auditory rehabilitation and assessment (https://www.teamhearing.org/). The listening included relative threshold measurements and loudness calibration for frequency and F0 discrimination using pure and complex tones (respectively), stream segregation for pure and complex tones, and stream segregation for spondee words (i.e., two equally stressed syllables; e.g., “baseball”) in competing speech with high levels of informational masking. Results were first analyzed to characterize group differences between CI users and peers with no known hearing loss, then analyzed to determine the extent to frequency and F0 discrimination explain differences in segregation abilities for tonal and speech streams.
Participants
Nineteen CI users (13 to 84 years old, M = 57 years, SD = 21.2 years, 12 females) and seventeen individuals with no known hearing loss (19 - 69 years old, M = 44.2 years, SD = 16.9 years, females = 10) participated. Ten CI participants used Cochlear Corporation implants (Cochlear Americas, Lone Tree, CO, USA), six used Advanced Bionics implants (Sonova, Los Angeles, CA, USA), and 3 used MED-EL implants (MED-EL, Innsbruck, Austria). Complete CI participant information is provided in Table 1. Participants gave informed consent and were paid $15/hour for their participation. The experimental protocol was approved by the University of Southern California Institutional Review Board (HS-19-00482 approved July 10th, 2019). Prior to completing the present study, participants complete general tests of pitch and speech perception using similar adaptive procedures used in the present study. These pitch and speech benchmarks require 30-min each to complete and provide some familiarization to testing procedures. This familiarization is important as we use adaptive procedures, described below, that adapt and terminate runs more rapidly than procedures typically used in the literature.
Cochlear Implant Participants. Age at Time of Testing and age at Onset of Hearing Loss is Given in Years. Duration of Profound Hearing Loss Prior to Implantation is Given in Years and Estimated from Subject Interviews/Surveys. Participants who are Classified as ‘Left / Right’ Were Tested Separately per ear. Abbreviations: Advanced Bionics (AB), Binaural Cable (BC), Mini Microphone (MM), Phone Clip (PC).

Procedures
Remote Assessment
All testing was done through TeamHearing: a web application for auditory rehabilitation and assessment (https://www.teamhearing.org/). Remote auditory assessments followed the recommendations of the Acoustical Society of America task force on remote testing (Peng et al., 2022). Research assistants corresponded with study participants prior to testing to familiarize participants with experimental procedures. Participants were instructed to test in a quiet room free from distractions and were provided with stereo circumaural headphones delivered to them for testing beforehand (Koss UR20 Over-Ear Headphones). CI users were asked to complete the task as they normally would connect for computer audio. When listening through a free field speaker, CI users were asked to disable hearing technology worn on, or to otherwise occlude, the ear contralateral to the ear tested. When streaming via Bluetooth, CI users were asked to disable Bluetooth compatible devices worn on the contralateral ear. Total testing time was three to four hours, typically separated into 2 to 4 sessions.
Relative Thresholds and Loudness Scaling
Loudness scaling and detection thresholds were measured to reference sound levels to sensation levels. Loudness scaling was measured by having participants adjust a 1 kHz pure tone to be “soft,” “medium soft,” “medium,” and “medium loud.” Detection thresholds were measured for pure tones for frequencies of 500, 1,000, and 2,000 Hz. Stimuli were 400 millisecond (ms) sinusoids with 20 ms raised-cosine attack and release ramps. Thresholds were measured using a three-interval, three-alternative, forced-choice procedure in which two of the intervals contained silence and one interval contained the tone. The starting level was set by the participant to be “soft but audible” and was then reduced by 2 dB following correct answers and increased by 6 dB after mistakes. A run continued until three mistakes were made and the final value was taken as the detection threshold. Participants were given the option to repeat the stimuli as needed. This adaptive rule converges to 75% detection accuracy (Kaernbach, 2001) (n.b., the final value of the adaptive track is used rather than an average of reversals because Monte Carlo simulations indicate better estimates of the true threshold).
Frequency and F0 Discrimination
Frequency and F0 discrimination thresholds were measured for pure and complex tones, respectively. Discrimination was measured using a two-interval, two-alternative, forced-choice procedure. Participants were provided two onscreen response buttons labeled “1” and “2”, which changed colors when the corresponding sound interval was presented. Participants were prompted: “Which sound was higher in pitch?”. Pure tone frequency discrimination was measured near 1,000 Hz, which was chosen for its central position near common vowel formant frequencies (Stevens, 1998). Complex tone F0 discrimination was measured for F0 s near 110 Hz. This F0 was chosen as representative of the typical range of male-spoken speech and mirrors the center frequency of the speech material used in the speech reception task (Litovsky, 2005).
Complex tones were constructed in the frequency domain by summing all harmonics from the fundamental to 2 kHz with a low pass filtering function. The form of the low pass filtering function was: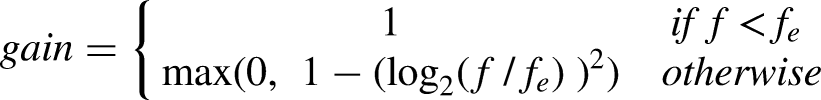
Each measurement run began with a frequency or F0 difference of 100% (an octave). This difference was adaptively reduced by a factor of
Stream Segregation for Pure and Complex Tones
Stream segregation was measured using a lead/lag delay detection task modeled after the task described by Paredes-Gallardo et al. (2018a). Participants were asked to detect a temporal irregularity in the last tone in a series of isochronously repeating tones in the presence of a competing tonal stream. The competing tones could be identical in frequency—in frequency or F0—or up to an octave higher. In this manner, the procedure measures thresholds for stream segregation between target and masker for a given frequency, or F0, separation.
Lead/lag delay detection thresholds were measured for pure and complex tones using a two-interval, two-alternative, forced-choice procedure. Participants were provided two onscreen response buttons labeled “early” and “late”, and they were prompted to answer: “Did the last note of the target stream arrive early or late?”. The target stream either consisted of 1,000 Hz pure tones or 110 Hz complex tones depending on the condition. Within a trial, competing tones matched the target type—either pure or complex—and test conditions defined the frequency (or F0) difference between target and competing streams as 0, 3, 6, or 12 semitones. Tones were 100 ms in duration and were played for the target stream with a periodicity of 400 ms for a total of 8 sequential tones (∼3 s total duration). Tones for the masker stream were played at an irregular periodicity centered at 400 ms but with random jitter of +/-100 ms (drawn from a uniform distribution) so that the masker stream did not energetically compete with the target stream (see Figure 1). Each measurement run began with either a lead or lag of 100 ms for the last tone of the target stream. Additionally, the task began with the masker absent, with the signal-to-noise ratio (SNR) adapting with correct responses. Once the target and masker had equal presentation levels, the irregular timing of the final tone of the target stream was adaptively controlled and reduced by a factor of
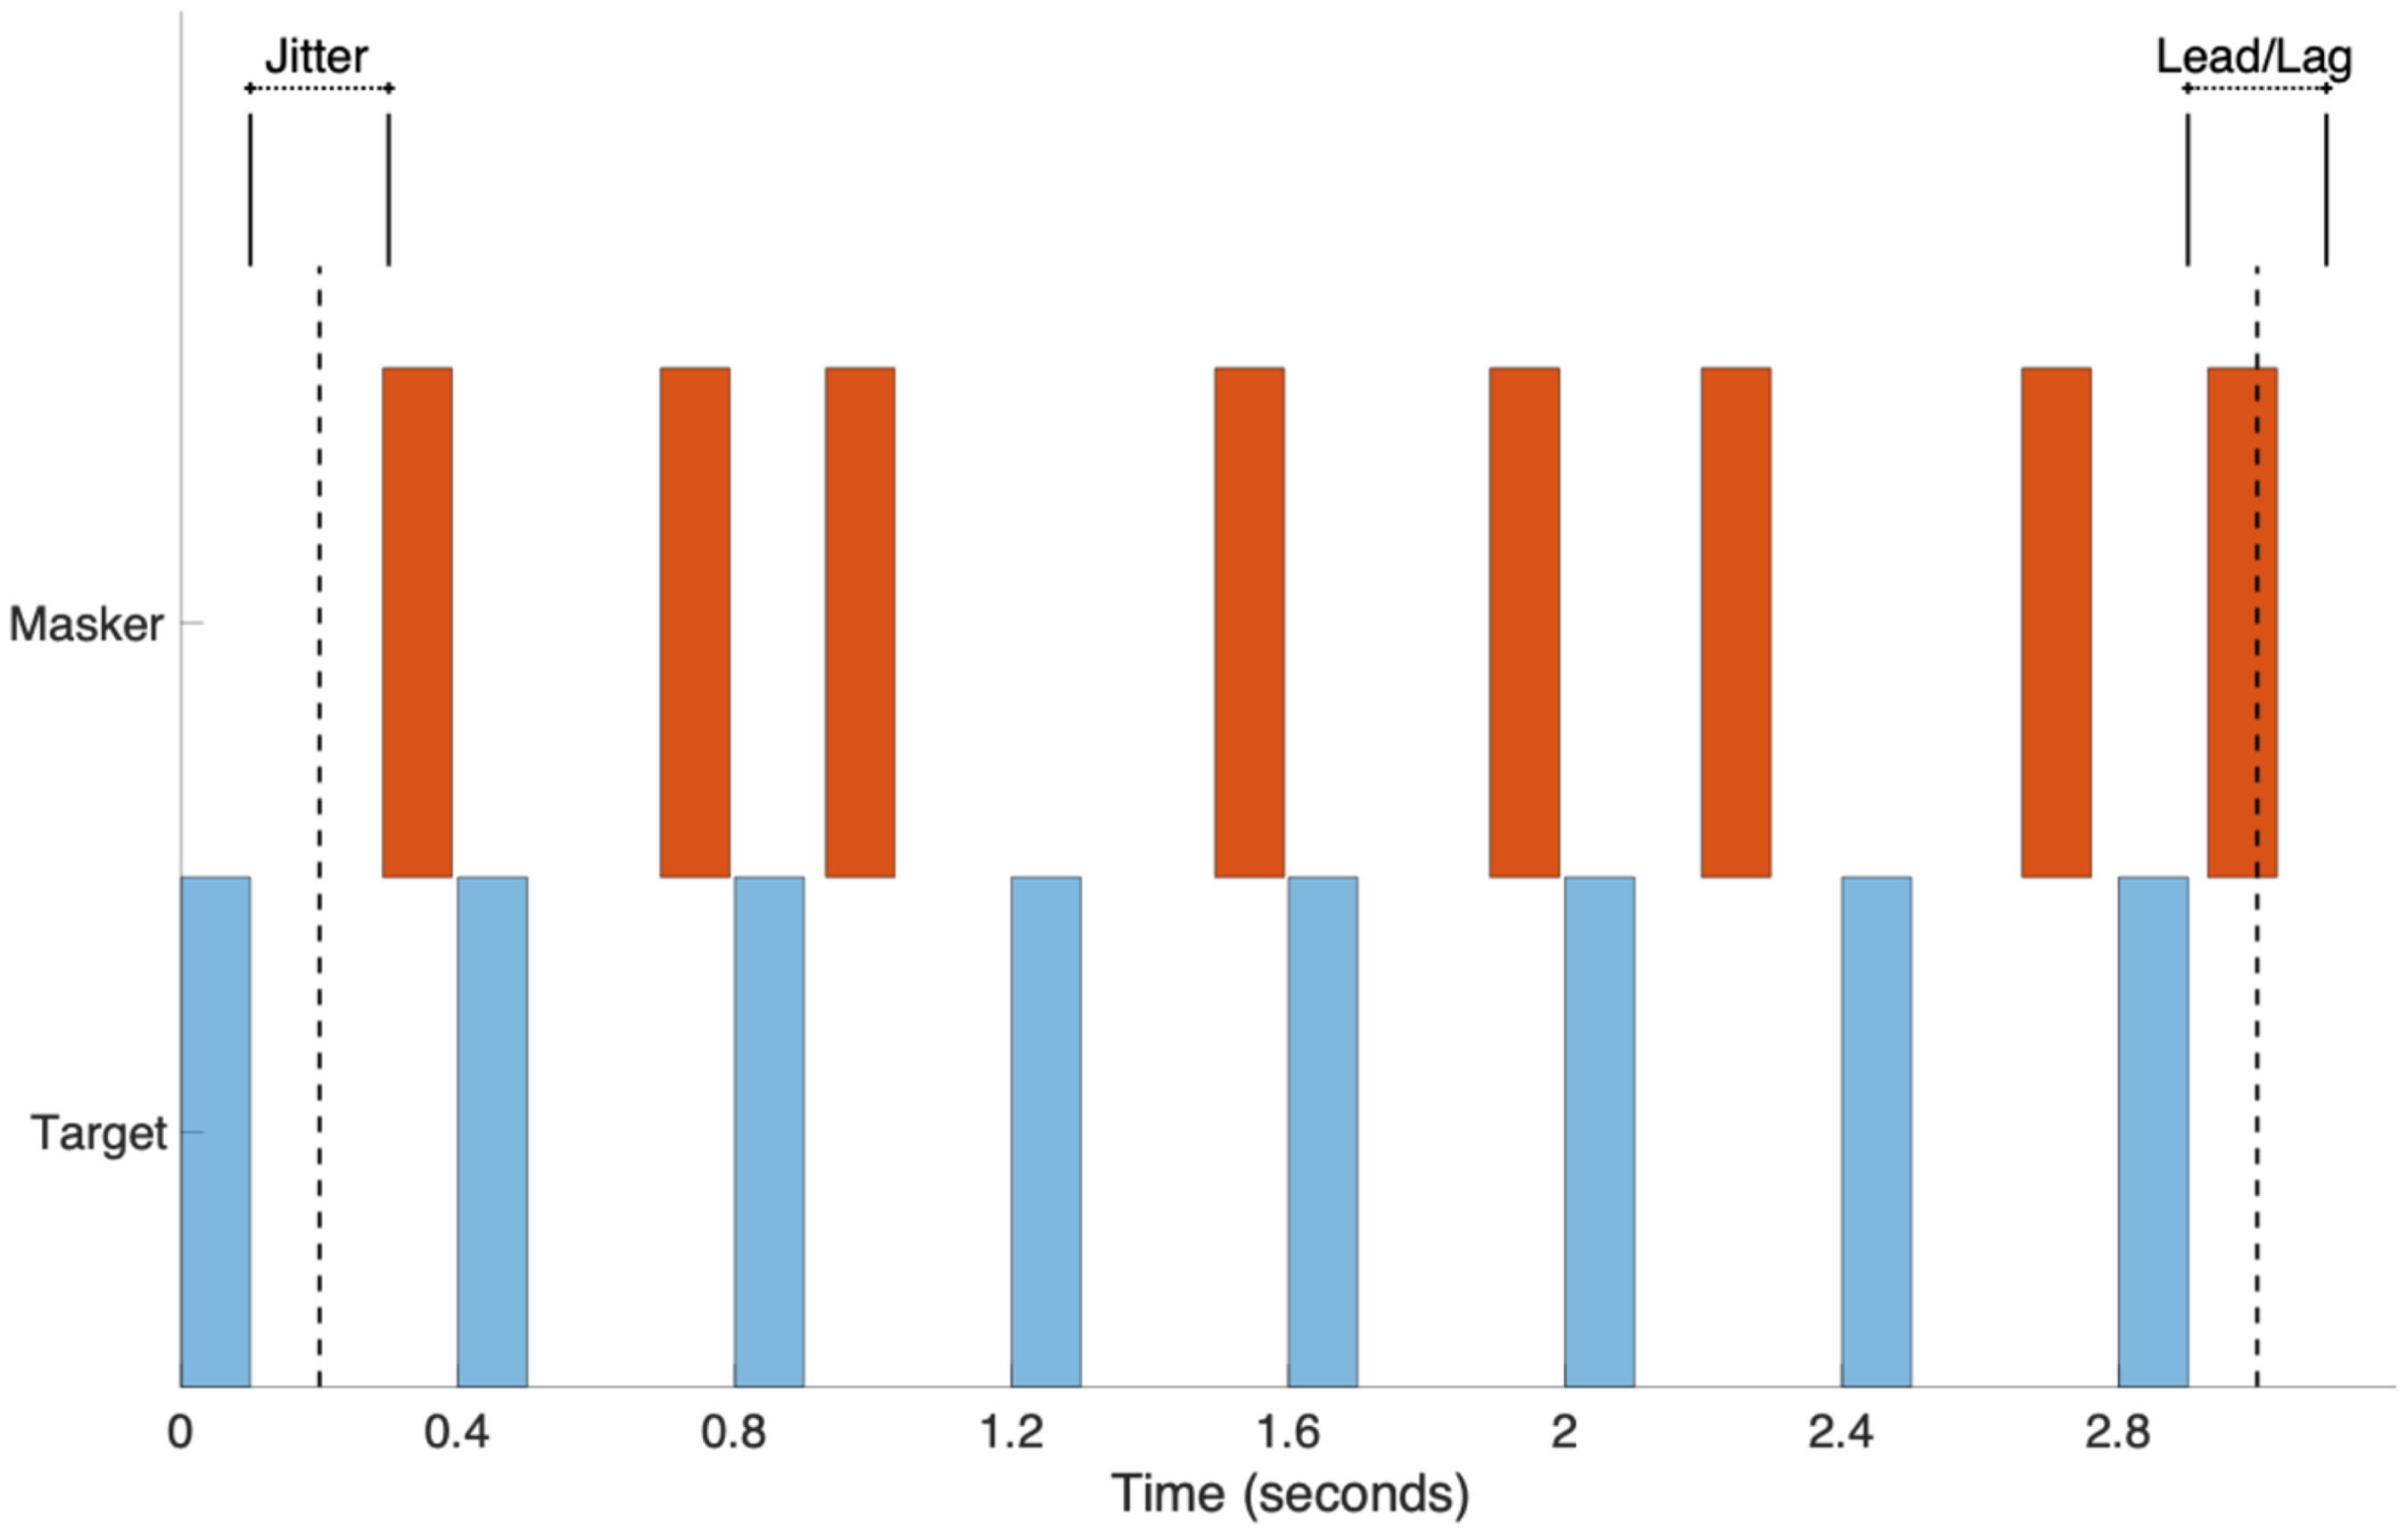
Stimulus illustration for stream segregation procedures for pure and complex tones. Start times of tones in the masker stream were randomly jitter +/-100 ms to produce an irregular spacing between tones. The lead/lag delay of the final target tone was adaptively controlled based on participant performance.
Stream Segregation for Spoken Words in Similar Competing Speech
Stream segregation for spondee words was measured in “similar” competing speech. The competing speech was similar in that it was constructed using the same words as the target speech but altered in F0 and concatenated to make masking competitors of different temporal density. Since the competing speech was composed of words from the same corpus as the target speech (the target word could be within the masker), the resulting competitor had exceptionally high informational masking, forcing the listener to attend to F0 cues for stream segregation. This procedure used spondee words as described by Litovsky (2005) because they have low cognitive and linguistic demand. Participants were asked to select from a grid of twenty possible spondee words. The target word was presented once following the previous response, and the next target word was not presented until the participant responded. Two types of competing speech were generated: one with a relatively sparse presentation of speech, the other with a relatively dense presentation (see Figure 2). For the sparse masker, words were randomly selected from the spondee-word corpus and concatenated so that the temporal spacing between the start times of the words was uniformly distributed between 0.5 and 0.6 s. The twenty-five words in the spondee corpus had an average duration of 0.67 s with a 0.11 standard deviation, so this spacing of words was approximately continuous with one word at a time with occasional gaps between the offset of one word and the onset of the next word as large as 300 ms. For the dense background, words were randomly selected and concatenated so that the spacing between starting times of words was uniformly distributed between 0.1 and 0.2 s. Further, for the dense spacing, selected words were randomly time-reversed with 50% probability. For this dense specification, multiple words overlapped and there were no temporal gaps between words. For both types of competing speech, the speech was F0 shifted by 0, 3, 6, or 12 semitones depending on the condition. Note, with no change in F0, participants effectively did not know which words were targets and which were competitors. These competing-speech samples were generated to be 20 s long and were played continuously in a loop during the speech reception procedure.

Illustration of stimulus presented in the stream segregation for spoken words in similar competing speech task. The target word in this sample is “airplane.” This figure provides an illustration of the differences in energetic masking between the sparse and dense noise conditions.
Speech reception thresholds were measured in this competing speech using an adaptive procedure. The initial signal-to-noise ratio between the target speaker and background noise was 12 dB and decreased by 2 dB following correct answers and increased by 6 dB following mistakes. The procedure continued until the participants made four mistakes and the final value was taken as the reception threshold for the measurement run. This adaptive rule converges to 75% identification accuracy for the speech reception (Kaernbach, 2001). Three measurement runs were completed and the average of these three runs was used as the summary measure.
Statistical Analysis
Data processing and statistical analyses were performed in MATLAB 2021a programming environment (MathWorks, Inc., Natick, MA, USA). Statistical analysis of frequency, F0, and delay detection thresholds were conducted after logarithmic transforming the measured thresholds. Rationale for using logarithmic transforms for similar procedures has been described in detail elsewhere (Micheyl et al., 2006). Results from each test were analyzed using a mixed analysis of variance (ANOVA) with a between-subject factor of group (CI versus those with no known hearing loss) and a within-subject factor of measurement repetition (three repetitions per test). For the measures of frequency and F0 discrimination, stimulus type (i.e., pure versus complex tones) was a within-subject factor. For measures of stream segregation, frequency separation between masker and target stream was a within-subject factor. Effect size was calculated using Cohen's d. An initial analysis of variance was conducted with repetition as a within-subject factor, but neither repetition nor any of its interactions with other factors were significant. Pearson's bivariate correlations were calculated to investigate relationships between measures with planned comparisons for the hypotheses that frequency and F0 partially explain outcome variance for segregation of tonal and speech streams. Adjusted and non-adjusted thresholds for multiple comparisons are given for consideration (Cumming, 2014; Feise, 2002; Nakagawa, 2004; Perneger, 1998).
Results
Frequency and F0 Discrimination
Figure 3 shows results for frequency and F0 discrimination for pure and complex tones, respectively, for CI users and adults with no known hearing loss. On average, CI users had poorer frequency and F0 discrimination (
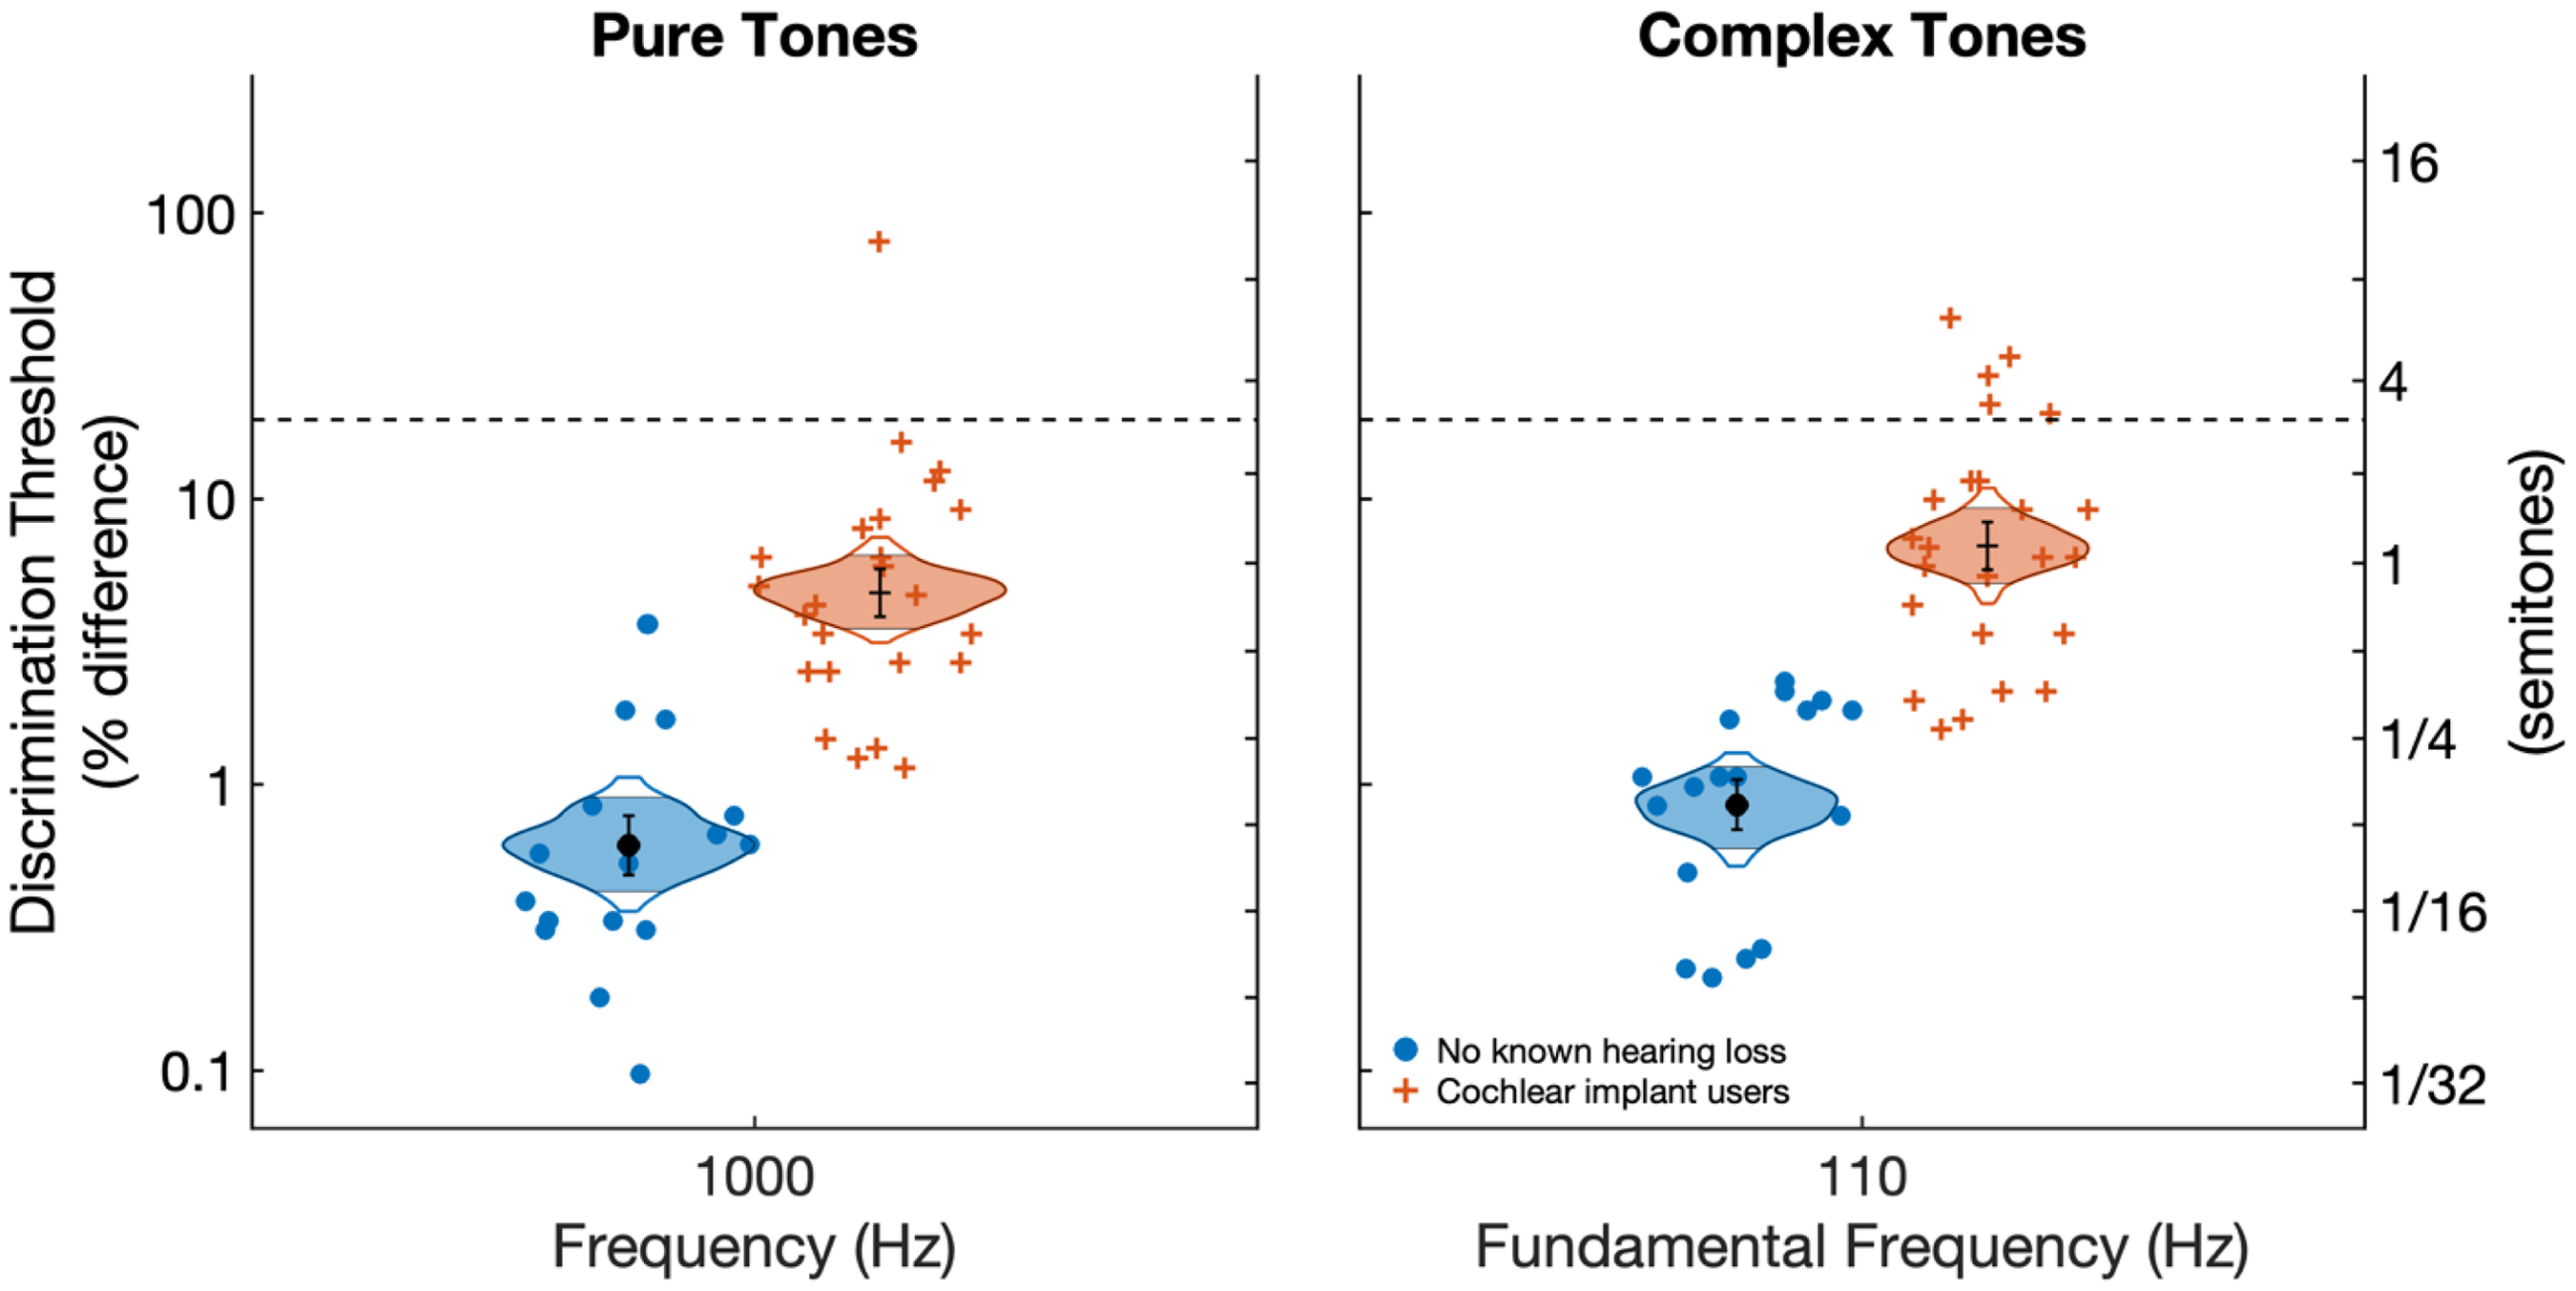
Frequency and F0 discrimination thresholds for 1,000 Hz pure tones and 110 Hz complex tones, respectively. Individual data points represent individual averages across three measurement runs. Cat's eye curves show confidence intervals of the means drawn to 99% confidence and filled to 95% confidence. Black circles and error bars indicate sample means and standard errors. Inferential statistics are based on a repeated-measures analysis of variance with participant group as a between factor and with stimulus type as a within-subject factor.
Stream Segregation for Pure and Complex Tones
Figure 4 shows results for stream segregation for pure and complex tones. Participant group was significant with elevated thresholds observed for CI users compared to those with no known hearing loss

Results from the stream segregation task depicting delay detection thresholds as a function of frequency, or F0, distance for pure and complex tones. Individual data points represent individual averages across three repetitions of each condition. Cat's eye curves show confidence intervals of the means drawn to 99% confidence and filled to 95% confidence. Black circles and error bars indicate sample means and standard errors. Inferential statistics are based on a repeated-measures analysis of variance with participant group as a between factor and with stimulus type and masker frequency separation as within-subject factors.
Stream Segregation for Spoken Words in Similar Competing Speech
Figure 5 shows speech reception thresholds measured as a function of frequency separation for sparse and dense background noise. In contrast to tonal stream segregation, there was a large difference between CI users and those with no known hearing loss. The effect of participant group was significant

Speech reception thresholds as a function of F0 distance for sparse and dense competing speech. Individual data points represent individual averages across three repetitions of condition. Cat's eye curves show confidence intervals of the means drawn to 99% confidence and filled to 95% confidence. Black circles and error bars indicate sample means and standard errors. Inferential statistics are based on a repeated-measures analysis of variance with participant group as a between factor and with stimulus type and masker frequency separation as within-subject factors.
Exploratory Analyses of Relationships Between Measures
We hypothesized prior to the study that frequency and F0 discrimination would predict outcomes for stream segregation and speech reception. To test for linear relationships between measures, we consolidated each measure into summary statistics for individual participants. For frequency and F0 discrimination, this was simply the average across the three measurement runs since there was only one condition per measure. For stream segregation and speech reception, individual thresholds were averaged across measurement runs and across the three conditions with frequency separation between target and masker stimuli (i.e., the 3, 6, and 12 semitone conditions). In addition, a masking release summary statistic was calculated as the difference between the 0-semitone condition and the average across the 3, 6, and 12 semitone conditions. Table 2 summarizes Pearson's correlation coefficients for the comparisons between all possible summary statistics with treatment of CI users and those with no known hearing loss as separate groups.
Correlations Between Measures for CI Users and for Those with No Known Hearing Loss.

Of these correlations, there are several strong correlations that were expected based on the similarity of measures. Specifically, frequency and F0 discrimination were well correlated for both CI users (
Relationship Between Frequency and F0 Discrimination with Tonal Stream Segregation
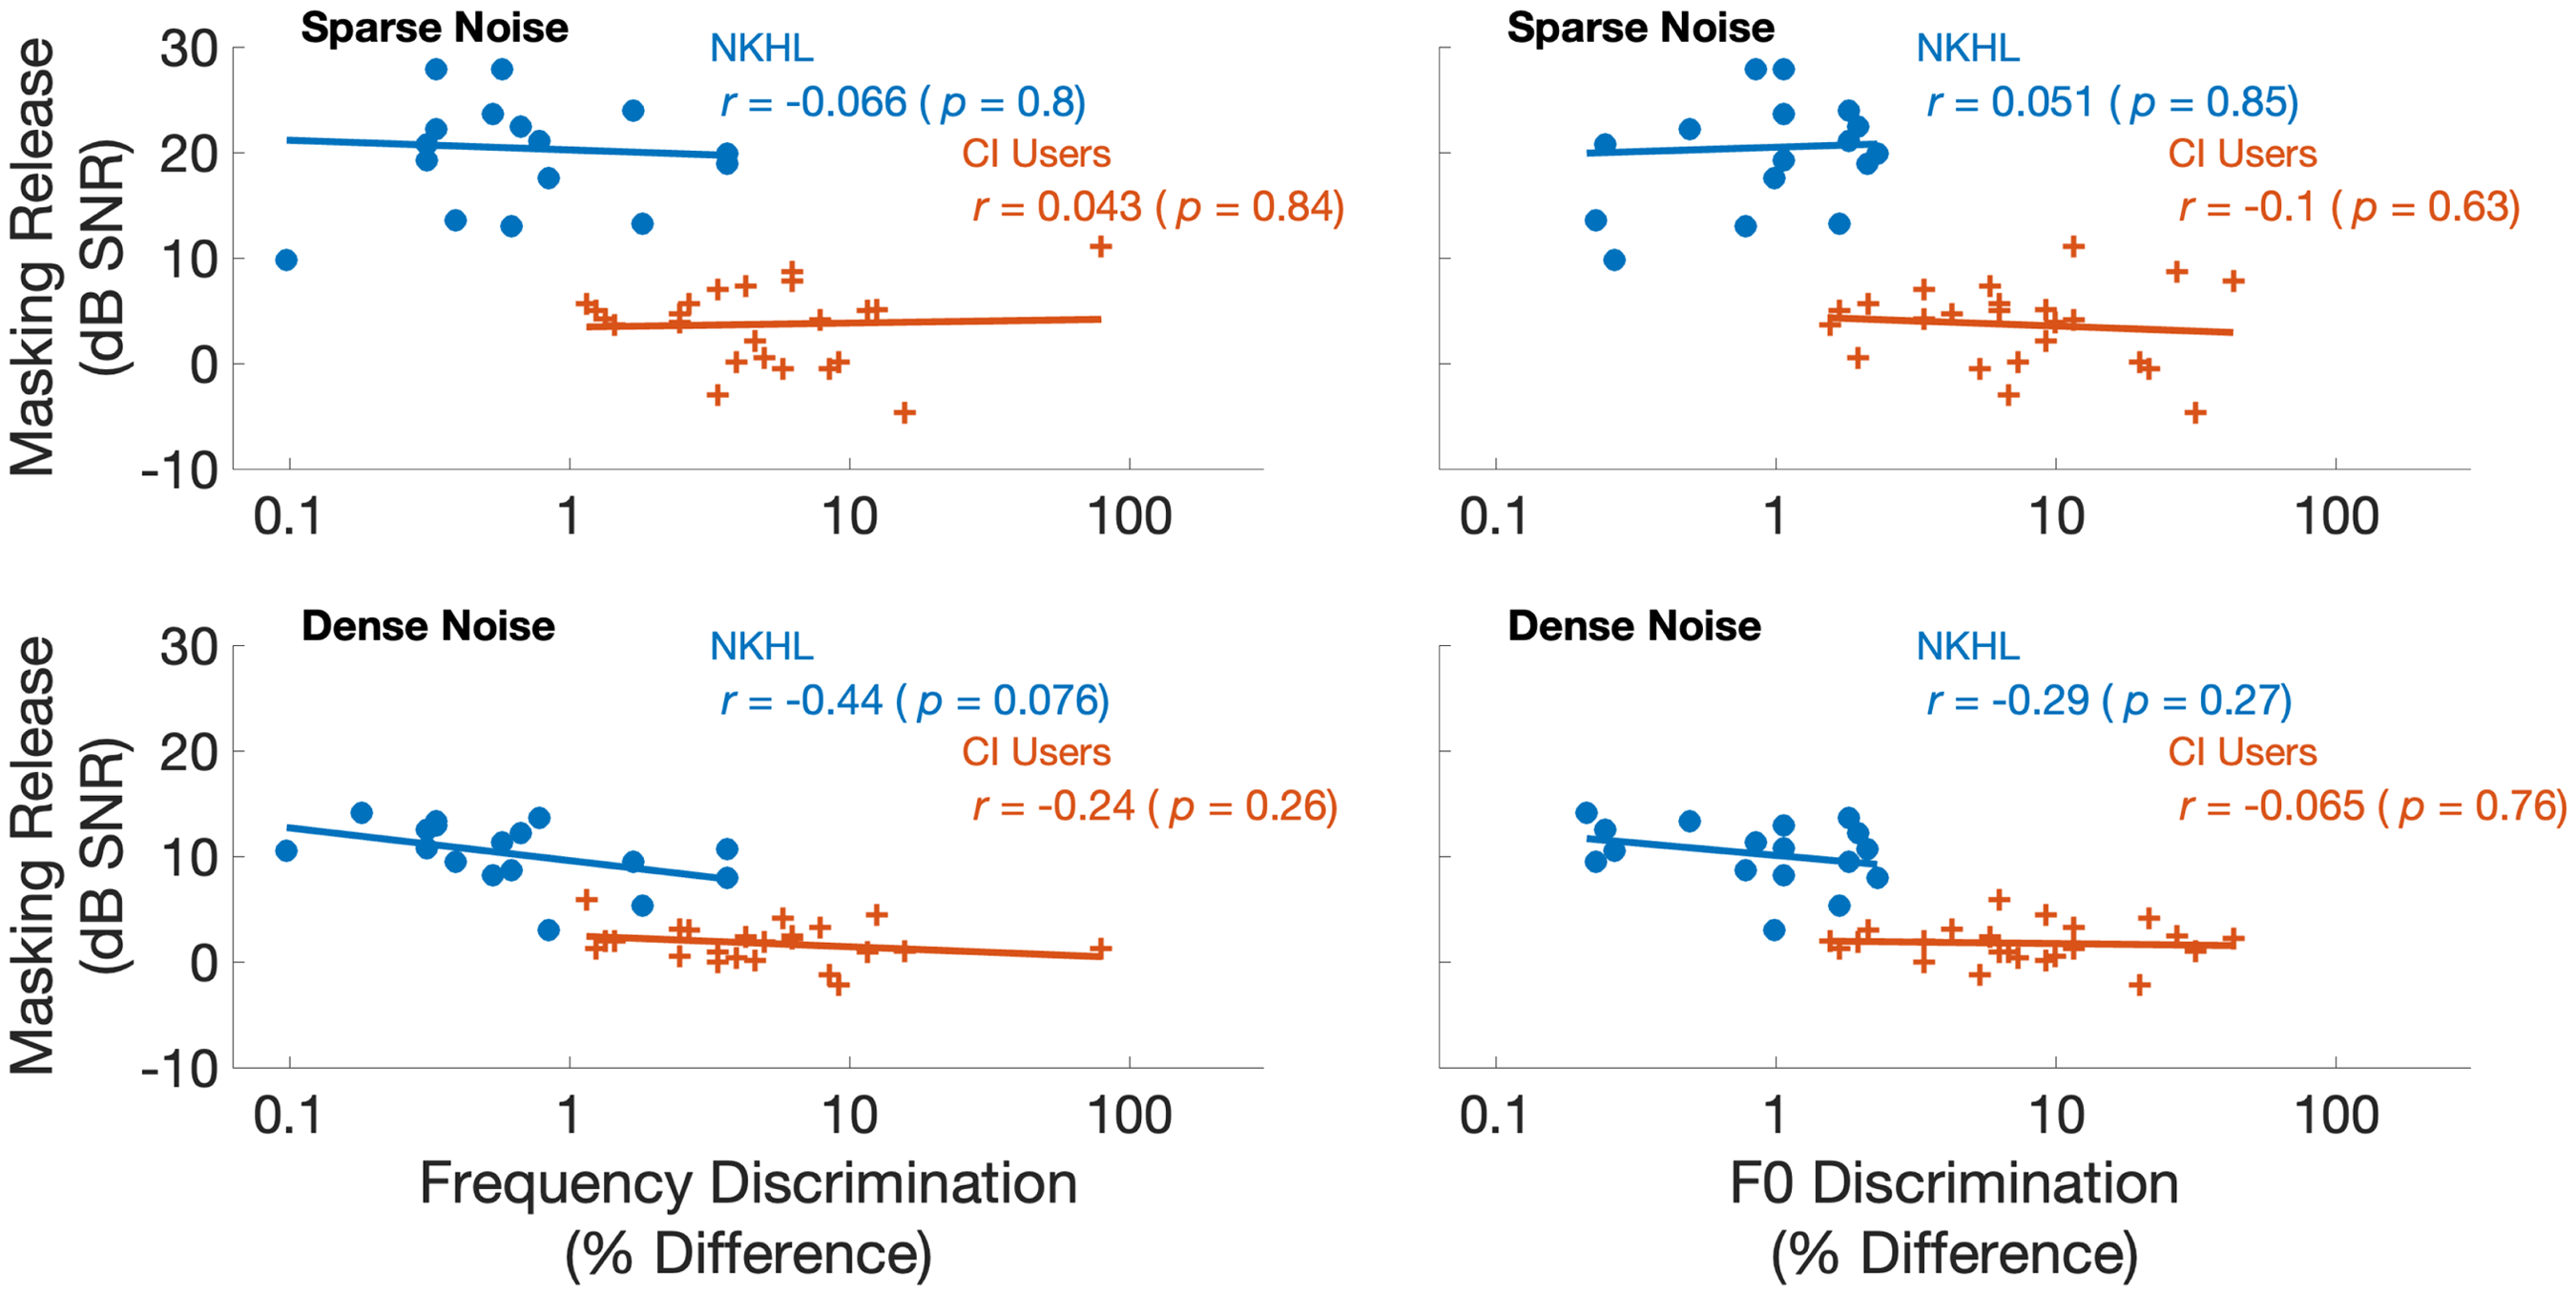
Overall, there was little evidence of an association between individual frequency or F0 discrimination and performance on stream segregation (Figure 6). The summary statistics for stream segregation was the individual average across measurement runs for the 3, 6, and 12-semitone conditions. For pure tones, a linear relationship with frequency discrimination explains 10.0% of the variance in stream segregation for both CI users (

Summary statistics of stream segregation versus frequency and F0 discrimination. The left panel shows pure tone delay detection thresholds versus frequency discrimination. The right panel shows complex tone delay detection thresholds versus F0 discrimination. Solid lines indicate fitted regression. Vertical dashed line indicates 3-semitone difference (15.9%). Statistics indicate Pearson's correlation coefficients and associated p values.
Relationships Between Frequency and F0 Discrimination with Speech Reception in Noise
There is little to no evidence that CI users with better frequency for pure tones or F0 discrimination for complex tones had better speech reception in competing speech with high levels of informational masking (Figure 7). All linear comparisons were in the expected direction with better stream segregation corresponding to better frequency or F0 discrimination, but no comparisons were significant at the 0.05 level let alone more stringent adjusted levels for multiple comparisons. For CI users, a linear relationship with frequency discrimination explained 9.6 and 7.1% (

Measures of speech reception versus frequency or F0 discrimination. Solid lines indicate fitted regression. Statistics indicate Pearson's correlation coefficients and associated p values.
Relationships Between Frequency and F0 Discrimination with Masking Release
Figure 8 shows masking release for speech reception measured in sparse and dense competing speech versus frequency and F0 discrimination. Masking release was quantified for each participant as the difference in speech reception thresholds between the 0-semitone condition and the average of the 3, 6, and 12 semitone conditions. There was no evidence of relationships between masking release with either frequency or F0 discrimination. Specifically, frequency discrimination for pure tones explained less than 1% of the variance in masking release for sparse and dense noise for CI users. Likewise, F0 discrimination explained about 1% of the variance in masking release for both sparse and dense noise conditions in CI users.
Summary statistics of masking release versus frequency and F0 discrimination. Solid lines indicate fitted regression. Statistics indicate Pearson's correlation coefficients and associated p values.
Discussion
This study examined relationships between frequency and F0 discrimination with stream segregation and speech reception in CI users and peers with no known hearing loss. Frequency and F0 discrimination was an order of magnitude worse in CI users, but they could segregate tonal streams almost as well as their peers with no known hearing loss. For CI users, a linear relationship with F0 discrimination explained 42% of the variance in stream segregation abilities. The most promising result of the present study is that CI users were able to hear out and judge tempo irregularities almost as well as their peers with no known hearing loss. CI users had slightly elevated thresholds, but the trends with different stimuli (i.e., pure and complex tones) and across conditions were similar between groups.
Prior studies have considered aspects of tonal streaming for synthetic tones as well as musical instruments. Galvin et al., 2009, examined the effect of competing instruments on melodic contour identification by CI users. That study differed from the present study in many ways, but most notably in the use of musical instruments, a more demanding segregation task (melodic contour identification versus listening for tempo irregularities), and the competing stream was perfectly synchronous with the target stream. They found that CI users were strongly affected by the competing instrument, though participants with normal hearing were unaffected. Rhythm perception in CI users is comparable to people with normal hearing (Limb et al., 2010; Looi et al., 2012; Phillips-Silver et al., 2015).
The present study provides mixed evidence for a relationship between stream segregation abilities with pitch salience. On the one hand, consistent with previous studies (Duran et al., 2012; Paredes-Gallardo et al., 2018b, 2018a), both CI users and peers with no known hearing loss, performed better with increasing frequency (or F0) differences between target and competitor streams. However, the differences between groups for tonal segregation were small despite the fact that CI users had frequency and F0 discrimination thresholds ten times worse than those with no known hearing loss. Furthermore, there was no evidence of a relationship between tonal stream segregation with either frequency or F0 discrimination for either group. A limitation of the present study was the frequency differences chosen to characterize stream segregation. We examined frequency and F0 differences of 3, 6, and 12 semitones to capture the broad range of outcomes expected for CI users. However, it is possible, if not likely, that the relationship between tonal segregation abilities and frequency discrimination would be better characterized with a narrower spacing of differences between 0 and 3 semitones. Future studies might also adaptively control frequency differences to determine threshold differences to achieve a certain level of performance on the stream segregation task. These limitations in mind, the present study found no evidence of a relationship between tonal stream segregation and individual differences in either frequency or F0 discrimination.
The present study found that CI users do not derive masking release based on F0 cues when listening to speech in the presence of competing speech. This result is consistent with previous studies that found that CI users, as well as normal-hearing participants listening to CI vocoder simulations, do not receive masking release based on F0 differences of spoken speech (Stickney et al., 2004, 2007). The present study also found a linear relationship between F0 discrimination and speech reception in competing speech, which is consistent with previous studies from our lab (Goldsworthy, 2015; Goldsworthy et al., 2013). These prior studies focused on masking release in temporally gated noise with large gaps (100 ms) in the background noise. Goldsworthy (2015) found that a linear relationship with both frequency and F0 discrimination explained a significant portion of the variance in speech reception outcomes for CI users for both consonant and vowel identification in gated noise, as well as for the masking release in gated noise. The present study was designed with that result in mind with a stronger requirement that F0 would be the primary cue available for segregating target and competitor speech; yet the present results found no evidence that CI users could consistently use these vocal pitch differences to obtain masking release.
The participants with no known hearing loss derived a large masking release from pitch shifting the competing speech, particularly so for sparse background noise. The CI users had sufficient discrimination of pitch shifts to hear these shifts, but they could not derive any masking release. The lack of masking release for CI users might be attributed to broad current spread and sensitivity of temporal envelopes to interference (Mehta & Oxenham, 2018); if so, reducing current spread and/or encoding temporal fine structure into stimulation might provide necessary cues for CI users to derive masking release when listening in background noise with competing talkers.
Footnotes
Declaration of Conflicting Interests
The authors declared no potential conflicts of interest with respect to the research, authorship, and/or publication of this article.
Funding
The authors disclosed receipt of the following financial support for the research, authorship, and/or publication of this article: This work was supported by the National Institute on Deafness and Other Communication Disorders, (grant number 1 R01 DC018044).