
Abstract
To date, pure-tone audiometry remains the gold standard for clinical auditory testing. However, pure-tone audiometry is time-consuming and only provides a discrete estimate of hearing acuity. Here, we aim to address these two main drawbacks by developing a machine learning (ML)-based approach for fully automated bone-conduction (BC) audiometry tests with forehead vibrator placement. Study 1 examines the occlusion effects when the headphones are positioned on both ears during BC forehead testing. Study 2 describes the ML-based approach for BC audiometry, with automated contralateral masking rules, compensation for occlusion effects and forehead-mastoid corrections. Next, the performance of ML-audiometry is examined in comparison to manual and conventional BC audiometry with mastoid placement. Finally, Study 3 examines the test-retest reliability of ML-audiometry. Our results show no significant performance difference between automated ML-audiometry and manual conventional audiometry. High test-retest reliability is achieved with the automated ML-audiometry. Together, our findings demonstrate the performance and reliability of the automated ML-based BC audiometry for both normal-hearing and hearing-impaired adult listeners with mild to severe hearing losses.
Introduction
Around the world, clinical hearing assessment relies on one primary measure, pure-tone audiometry, traditionally carried out manually by an expert health practitioner (Carl et al., 2023). Pure-tone audiometry consists of estimating detection thresholds of pure tones in air-conduction (AC) and bone-conduction (BC). The commonly used procedure is based on a modified version of the Hughson-Westlake procedure (EN ISO 8253–1:2010; Hughson & Westlake, 1944). In an effort to save time, automated measures of audiometry have been developed and commercialized (see review: Mahomed et al., 2013). More recently, automated approaches based on machine learning (ML) have also been proposed with improved technical specifications (see review: Wasmann et al., 2022).
In fact, in a recent study (Wallaert et al., 2024), we extend the ML approach described to automate AC pure-tone audiometry tests previously proposed (see Schlittenlacher et al., 2018; Song et al., 2015; 2017 and Barbour et al., 2019a; 2019b) through the addition of (a) fully automated contralateral masking (see also Heisey et al., 2020), (b) transient responses to constrain the audiometry test phase in order to safely test patients with severe hearing loss and/or presence of dead zones, and finally, (c) safety intensity limits during automated testing to cater for a wide range of normal-hearing and hearing-loss patients. We describe the protocol used as compared to the previously proposed ML-based approaches, and present clinical data about the performance and reliability of audiometry measures in comparison to well-established, conventional manual AC audiometry (Wallaert et al., 2024). In addition to saving key medical time for hearing professionals through test automation, the ML-based approach provides hearing threshold measures with improved technical specifications as compared to the current clinical method: (a) in intensity levels: 1-dB steps vs current clinical offer of 5-dB steps, (b) in frequency: pseudo-continuous threshold estimates versus current clinical offer of 6 to 11 discrete frequency points, and (c) in threshold measures: uncertainty estimates around thresholds vs current clinical offer of a single measure of the threshold.
Here, we aim to extend this ML-based approach to BC pure-tone audiometry tests. Bone conduction is broadly defined as the process by which sound vibrations are transmitted through the skull bone, cartilage, skin, soft tissue, and fluids, becoming a sound pressure in the cochlea, and ultimately resulting in a sound percept (Stenfelt, 2013; Stenfelt & Goode, 2005). Together, the AC and BC audiograms provide information about the quality of sound detection of the listener and allow precise classification of the hearing status, as well as the nature of the hearing loss, if present (Jerger, 1968). In fact, most diagnosis of conductive hearing loss is by comparison of AC and BC hearing thresholds, termed the air-bone gap (ABG).
While no ML-based approach to BC pure-tone audiometry has been previously proposed, several authors have developed automated BC audiometry tests. For instance, the AMTAS system (Grason-Stadler, Interacoustics) is designed to fit into the clinical care pathway and includes both automated AC and BC tests (Eikelboom et al., 2013; Margolis et al., 2007; 2010). Similarly, KUDUwave (GeoAxon) is an automated portable diagnostic audiometer using improved passive attenuation and real-time environmental noise monitoring, making AC and BC audiometry possible in unconventional settings (Swanepoel & Biagio, 2011). In order to limit experimenter manipulations between AC and BC audiometry, both methods have adopted the forehead placement for the bone transducer (i.e., the vibrator). In other words, the AC headphones and the BC vibrator are positioned at the beginning by the experimenter, and BC audiometry can be performed directly after AC audiometry without any experimenter intervention or repositioning of the transducers. Importantly, although the mastoid process is the most commonly used location for vibrator positioning in clinical practice (Gelfand, 2001), the forehead placement offers a large and flat area of contact for easier positioning as compared to mastoid positioning whereby small changes in placement may result in large amplitude changes (Dirks et al., 1968; McBride et al., 2005). Thus, even though the forehead offers about 10 dB poorer sensitivity to external vibrations as compared to the mastoid process, the forehead placement provides more repeatable results and smaller intersubject variability (Dirks, 1964; Studebaker, 1962). For comparison, appropriate mastoid-forehead corrections need to be applied as defined in standards (ANSI, 2018; Frank, 1982; Haughton & Pardoe, 1981).
In addition, with this design of forehead placement of the vibrator, contralateral masking can be directly applied to the nontest ear (NTE) using the supra-aural headphones positioned over both ears. However, one drawback of this design is that the test ear (TE) is occluded. In fact, the occlusion effect can be defined as the perceived increase in low-frequency sound presented by BC following the occlusion of the TE canal opening (Stenfelt, 2011; Stenfelt, 2013; Stenfelt & Goode, 2005; Stenfelt & Reinfelt, 2007). Occlusion effects have been extensively reported in the literature as the alteration of the perceived sound using psychoacoustic studies (Klodd & Egerton, 1977; Small & Stapells, 2003), or measurements of ear-canal pressure alterations (Howell et al., 1988; Stenfelt et al., 2003), or both (Berger & Kerivan, 1983; Huizing, 1960; Margolis & Moore, 2011; Stenfelt & Reinfelt, 2007; Wang et al., 2022). However, the occlusion effects vary as a function of the occluding device, and its exact positioning. Overall, automated BC measures with forehead placement should consider the application of both automated contralateral masking of the NTE during testing, as well as compensate for the occlusion effects of the TE.
Here, in Study 1, we measure the occlusion effects of several headphones for a group of normal-hearing subjects with thresholds <20 dB HL at all tested frequencies. Hence, Study 1 provides mean compensating values for the occlusion effects at audiometric frequencies ranging from 0.25 to 6 kHz for Study 2. In Study 2, we present a ML-based approach developed for BC audiometry, including compensation of occlusion effects and automated contralateral masking rules to isolate the response of the TE. Next, the performance of the automated ML-based BC method with forehead placement is examined in comparison to conventional, manual BC audiometry with mastoid placement. Finally, Study 3 examines the test-retest reliability of the automated ML-based BC measures. Together, our results demonstrate the performance and reliability of the automated ML-based BC audiometry when used with appropriate contralateral masking and compensation of occlusion effects.
Study 1. Occlusion Effect for Bone-Conduction Audiometry
The main goal of Study 1 is to examine the occlusion and masking effects during BC audiometry tests.
Methods
Subjects
A group of 39 normal-hearing subjects (mean age ± SD = 22.8 ± 2.5 years; 21 women) was tested. All subjects were adults (>18 years) and of French nationality. Two subjects were removed as they did not respond at interoctave frequencies. The study was approved by the French Regional Ethics Committee (Comité de Protection des Personnes Est III; SI number: 22.03364.000107). All subjects were fully informed of the goal of the study and provided written consent before their participation. AC pure-tone thresholds confirmed that all subjects had thresholds below 20 dB HL at all tested frequencies (from 0.25 to 6 kHz, see Supplementary Figure S1).
Procedure for Manual AC Pure-Tone Audiometry
Manual pure-tone audiometry test systematically begins by testing the better ear declared by the patient, and if no better ear is declared, the right ear is tested first. The manual audiometry procedure tests audiometric frequencies of 1, 1.5, 2, 3, 4, 6, 0.75, 0.5, and 0.25 kHz in the given order as recommended in different audiometry guidelines (ANSI, 2004; Société Française d’Audiologie, 2006). The intensity level varied in 5- (up) and 10-dB steps (down), also referred to as an asymmetric up-down procedure (Kaernbach, 1991). The experimenter adjusts the frequency and level directly from the audiometer until the estimated threshold is obtained. The subject's response when he/she presses the button to indicate that he/she hears appears directly on the experimenter's interface. The experimenter records the audiometric thresholds directly on the audiometer interface. The duration of the stimuli for each trial was defined by the experimenter and varied according to recommendations (ANSI, 2004; British Society of Audiology, 2018). As all subjects had normal hearing, no contralateral masking was applied during AC audiometry tests.
Procedure for Manual BC Pure-Tone Audiometry
The procedure is similar to the one described for AC pure-tone audiometry.
Vibrator Positioning
We used two vibrator placements: the forehead and the mastoid positioning. For the forehead position, the ossi-vibrator was secured using the AMBAND headband (Audiology Incorporated, Arden Hills, MN, USA; Margolis & Margolis, 2022). For the mastoid position, the ossi-vibrator was secured using the BHM headband (Austria). No force measurements were conducted for the BHM headband.
Experimental Conditions
For all subjects, BC thresholds were measured in seven different ways, illustrated in Table 1. The order of presentation of the seven tests was randomized.
BC Threshold Measures Measured under Seven Different Conditions.

Contralateral Masking for BC Audiometry
For all BC audiometry, as specified in Table 1, contralateral masking was applied by using a narrow-band noise centered on the test frequency and applied at 40 dB HL (see EN ISO 389-4:1994).
Material and Calibration
All testing took place in an audiometric booth. As the actual values of thresholds were not examined here, we used different types of conventional manual audiometers to assess the relative differences in thresholds to establish the occlusion and masking effects. Audiometers used were Interacoutics Affinity and Equinox, Otometrics Aurical, Siemens Sivantos Unity 1, 2, and 3, and Natus Otometrics Astera II. For AC audiometry and masking purposes during BC testing, stimuli were presented using different audiometric equipment: Sennheiser HDA 200, TDH 39, TDH 39 mounted on passive noise-attenuating shells (Peltor), and inserts (Etymotic ER1, Radioear IP30, GN Otometrics). For BC audiometry, stimuli were presented using different vibrators: BHM BC1 and BC2, and RadioEar B71 and B72.
Calibration was performed for all devices by specialist technicians in accordance with EN ISO and IEC norms, including IEC 60318-1:2009, using Brüel & Kjær couplers, adaptors, cones, and Artificial Mastoid Type 4930 (Copenhagen, Denmark). All equipment had a valid certification of calibration covering the testing period and that dated within the last year. All vibrators for BC audiometry were calibrated for testing at the mastoid position.
Statistical Tests
All group-level statistical tests and effect size calculations were performed using JMP Pro 14.0 on a Mac platform. The Shapiro-Wilk test of normality was performed for all datasets. Non-normally distributed data were examined using nonparametric tests. Pairwise comparisons were carried out using the Steel-Dwass Method for nonparametric comparisons. To compare more than two groups, one-way ANOVA rank tests or Kruskal-Wallis H tests were used. Normally distributed data were examined using Student t-tests and ANOVAs, as described in the Results section. For post hoc multiple comparisons analyses, alpha values were corrected by the number of comparisons examined, as described in the Results section.
Results
Variability of Occlusion and Masking Effects for BC Forehead Thresholds
Figure 1a shows the thresholds for BC pure-tone audiometry from 0.25 to 6 kHz measured with the vibrator positioned on the forehead, without any masking nor any ear occlusion (no headphones on the ears; referred to as Forehead-NoMask-NoHeadphones; thin lines show individual ears, the thick line shows overall mean; shaded area represents the standard deviation [SD]). Figure 1b shows the BC thresholds of the same group of subjects measured from the forehead position, with the headphones placed on top of the nontest ear and with masking in the nontest ear (Forehead-Mask-HeadphonesNTE). Figure 1c shows the BC thresholds measured from the forehead position, with the headphones placed on both ears and with masking in the nontest ear (Forehead-Mask-HeadphonesBE). Figure 1d shows the BC thresholds measured from the forehead position, with the headphones placed on both ears but without any masking in the nontest ear (Forehead-NoMask-HeadphonesBE). Figure 1e shows the mean of all BC thresholds measured from the forehead position for comparison purposes.

Occlusion and masking effects for BC forehead audiometry.
The mean occlusion and masking effects for BC measured with the vibrator positioned on the forehead are detailed in Tables 2 and 3, respectively. Those mean values are obtained with different audiometric equipment (see Methods section “Material and Calibration”) in order to estimate the average occlusion and masking effects in clinical practice - whereby practitioners use a range of different audiometric equipment.
Occlusion Effects in BC Forehead Thresholds.

Note. TE = test ear; NTE = nontest ear; BE = both ears.
Masking Effects in BC Forehead Thresholds.
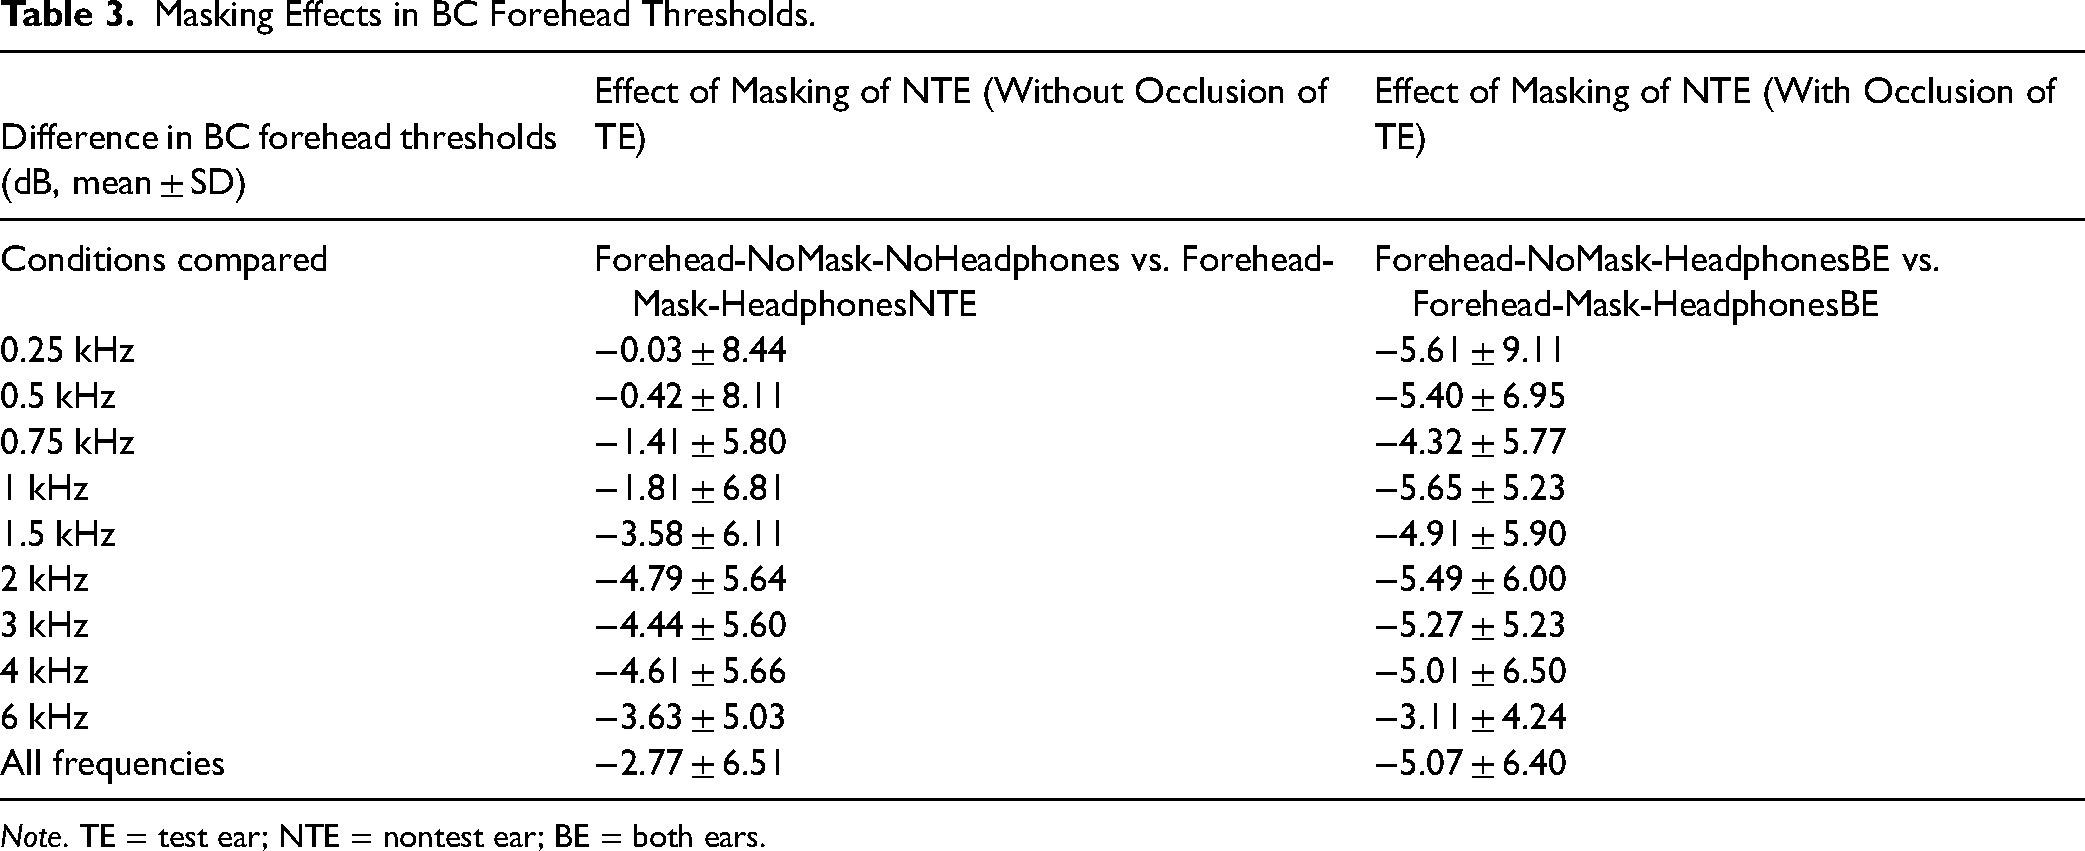
Note. TE = test ear; NTE = nontest ear; BE = both ears.
When comparing all four BC thresholds measured with the vibrator positioned on the forehead, a significant difference was found, Kruskal-Wallis H test, χ2(3) = 99.1, p < .0001, across all frequencies. In fact, a significant occlusion effect was found with masking, that is when comparing thresholds of Forehead-Mask-HeadphonesNTE with the Forehead-Mask-HeadphonesBE (nonparametric comparisons with control using the Steel method; p < .0001). Statistical comparisons for individual frequencies are shown in Supplementary Tables S1 and S2. Finally, the difference in masking effect (Table 3) is likely to arise due to the improved BC threshold with occlusion, which becomes masked in particular at low frequencies.
Variability of Occlusion and Masking Effect for BC Mastoid Thresholds
Figure 2a shows the thresholds for BC pure-tone audiometry from 0.25 to 6 kHz measured with the vibrator positioned on the mastoid process, without any masking nor any ear occlusion (no headphones on the ears; referred to as Mastoid-NoMask-NoHeadphones). Figure 2b shows the BC thresholds of the same group of subjects measured from the mastoid process, with the headphones placed on top of the nontest ear and with masking in the nontest ear (Mastoid-Mask-HeadphonesNTE). Figure 2c shows the BC thresholds measured from the mastoid position, with the headphones placed on both ears and with masking in the nontest ear (Mastoid-Mask-HeadphonesBE). Figure 2d shows the mean of all BC thresholds measured from the mastoid position for comparison purposes.

Occlusion and masking effects for BC mastoid audiometry.
The mean occlusion and masking effects for BC measured with the vibrator positioned on the mastoid are detailed in Tables 4 and 5, respectively. Those mean values are obtained with different audiometric equipment (see Methods section “Material and Calibration”).
Occlusion Effects in BC Mastoid Thresholds.

Note. TE = test ear; NTE = nontest ear; BE = both ears.
Masking Effects in BC Mastoid Thresholds.

Note. TE = test ear; NTE = nontest ear; BE = both ears.
When comparing all three BC thresholds measured with the vibrator positioned on the mastoid, a significant difference was found, Kruskal-Wallis H test, χ2(2) = 51.4, p < .0001, across all frequencies. In fact, when comparing BC thresholds from Mastoid-NoMask-NoHeadphones with the Mastoid-Mask-HeadphonesBE, a significant difference was found (nonparametric comparisons with control using Steel method; p = .0009). Statistical comparisons for individual frequencies are shown in Supplementary Tables S3 and S4.
Variability as a Function of Transducer Types
In contrast to the above Results, here, we focused on occlusion effects as a function of the type of transducer used. Hence, when the transducer was positioned on the forehead position, we compared the following conditions: (a) occlusion effect without any masking: Forehead-NoMask-NoHeadphones versus Forehead-NoMask-HeadphonesBE, and (b) occlusion effect with same masking: Forehead-Mask-HeadphonesNTE versus Forehead-Mask-HeadphonesBE. More precisely, we evaluated the occlusion effects for four different groups of occluding devices: (a) inserts, (b) HDA 200, (c) TDH 39, and finally, (d) TDH 39 with Peltor noise-attenuating shells used for masking in Study 2 (see Table 6).
Occlusion Effects Without Masking (Forehead-NoMask-NoHeadphones vs. Forehead-NoMask-HeadphonesBE).

For the occlusion effect without any masking (Forehead-NoMask-NoHeadphones vs. Forehead-NoMask-HeadphonesBE; see Table 6), no significant difference was found between the occlusion effects related to the four different groups of occluding devices, Kruskal-Wallis H test, χ2(3) = 1.98, p = .5762. For all individual frequencies, no significant differences were found (Steel Dwass comparisons; p > .05).
For the occlusion effect with the same masking (Forehead-Mask-HeadphonesNTE vs. Forehead-Mask-HeadphonesBE; see Table 7), a significant difference was found between the occlusion effects related to the four different groups of transducers, Kruskal-Wallis H test, χ2(3) = 11.97, p = .007. More precisely, at 0.25 kHz, a significant difference is present between TDH 39 with noise-attenuating shells and Sennheiser HDA 200 (Steel Dwass comparisons; p = .007). At 0.5 and 1 kHz, a significant difference is present between TDH 39 with noise-attenuating shells and Sennheiser HDA 200 (p = .018 and p = .022, respectively) and between TDH 39 with noise-attenuating shells and inserts (p = .035 and p = .021, respectively). For all other comparisons, no significant differences were found (Steel Dwass comparisons; p > .05).
Occlusion Effects with Masking (Forehead-Mask-HeadphonesNTE vs. Forehead-Mask-HeadphonesBE).

Study 2: Performance of Automated ML-Based BC Audiometry
The main goal of Study 2 is to examine the performance of an automated ML-based BC audiometry on a computer software with the application of automated contralateral masking and compensation of occlusion effects (see Study 1, Table 7).
Methods
Subjects
Subjects tested were of a wide age range (n = 49, 23 females, min–max age: 18–88 years) and were recruited from an audiology clinic in France. Only adults were tested (>18 years) and all subjects were of French nationality. No exclusion criteria based on the etiology of hearing loss were used, in order to not exclude any type of hearing loss. No subjects were excluded from the study. All subjects were fully informed about the goal of the study and provided written consent before their participation. The study was approved by the French Regional Ethics Committee (Comité de Protection des Personnes Est III; SI number: 22.03364.000107).
Lateralization Test
Prior to the audiometry test, participants were asked to indicate at which side they had best hearing. In fact, AC audiometry test systematically begins by testing the better ear declared by the patient, and if no better ear was declared, the right ear is tested first.
Next, all subjects were tested using a manual procedure in order to assess their lateralization with a Weber test. In fact, BC audiometry test systematically begins by testing the ear towards which the Weber test is lateralized.
For the Weber test, subjects were equipped with the vibrator positioned on the forehead position and stimulated with pulsed pure tones at four frequencies: 0.5, 1, 2, and 4 kHz and a 1-s-long stimulus. For each frequency, once the experimenter obtains the first positive response from the subject, the sound intensity is increased by 15 dB to establish the lateralization. To do so, subjects are asked to say which ear the sound came from. The lateralization results for each frequency are stored manually in the software interface by the experimenter. The lateralization results provide the experimenter with an indication of the hearing loss etiology (conductive vs. sensorineural) and is later used for contralateral masking purposes (see Methods section “Automated Contralateral masking for BC audiometry”).
Audiometry Tests
For all 49 subjects, AC and BC pure-tone hearing thresholds were measured for both ears using three methods:
Reference (conventional and manual) audiometer, manual ML-audiometer, and automated ML-audiometer.
The order of presentation of the three tests was randomized with the AC tests performed systematically before the BC tests. For each subject, pure-tone audiometry was measured for individual ears with either manual masking (for “Reference” and “manual ML-audiometer,” see Methods section “Manual Masking Rules”) or automated masking procedure (for “automated ML-audiometer,” see Methods section “Automated Contralateral Masking for BC Audiometry”) presented to the nontest ear. In addition, occlusion effects were compensated for when using the automated ML-audiometer (see Methods section “Compensating for Occlusion Effects for Automated BC Audiometry”).
Material and Calibration
All testing took place in an audiometric booth. The Reference audiometer used was a Natus-Otometrics Astera II diagnostic audiometer (Pleasanton, CA, USA). Sennheiser HDA 200 headphones (Wedemark, Germany) mounted on Peltor earmuffs were used for AC tests and for masking purposes during BC tests. For BC tests with the Reference audiometer, a Radioear B71 ossi-vibrator (Radioear, Denmark) positioned on the mastoid process was used with calibration for mastoid BC measures. No occlusion of the test ear was present during manual Reference BC testing as the headphones were only positioned on the nontest ear for contralateral masking. The remaining part of the headphones was positioned on the ipsilateral cheek in order to not occlude the ipsilateral test ear.
The second audiometer used was the ML-audiometer software developed by My Medical Assistant SAS (iAudiogram®, Reims, France). All stimuli were generated at a sampling frequency of 44.1 kHz and a resolution of 24 bits. The digital-to-analog conversion was performed by an audio interface (Willich, Germany) without acoustic attenuation. TDH 39 headphones (Telephonics, Huntington, NY, USA) mounted on passive noise-attenuating shells (Peltor) were used for AC tests and for masking purposes during BC tests. For ML-based BC tests, a BHM BC-2LD audiometric bone conductor (BHM, Austria) positioned securely on the forehead position using an AMBAND headband (Audiology Incorporated, Arden Hills, MN, USA ; Margolis & Margolis, 2022) was used. No occlusion of the test ear was present during manual ML-based BC testing as the headphones were only positioned on the nontest ear for contralateral masking. In contrast, the test ear was occluded during automated ML-based BC testing as both ears were covered by the headphones.
For the lateralization test performed, the Reference audiometer equipped with a Radioear B71 ossi-vibrator and the AMBAND headband was used. Calibration was performed for both audiometers by a Natus specialist technician (Pleasanton, CA, USA) in accordance with EN ISO and IEC norms, using a Brüel & Kjær coupler, adaptor, cone, and Artificial Mastoid Type 4930 (Copenhagen, Denmark). The sound pressure level was measured with a Brüel & Kjær 2250 sound level meter (Copenhagen, Denmark).
BC Manual Audiometry Procedure
See the Methods section “Procedure for Manual BC Pure-Tone Audiometry” of Study 1.
Manual Masking Rules Applied for BC Audiometry
Mastoid manual BC audiometry test was performed following a set of contra-lateral masking rules implemented in France, described extensively in Favier et al. (2018). No occlusion effect was present in the test ear (TE) as the TE was not covered with headphones. Contralateral masking was presented to the nontest ear (NTE) by positioning the headphones only on the NTE. In fact, the experimental condition referred to as “Mastoid_Mask_Headphones NTE” from Study 1 was used. This approach is commonly used in daily clinical settings in France.
AC Manual Audiometry Procedure
Manual AC audiometry was similar to the BC one, except that two additional audiometric frequencies are tested as compared to BC audiometry: 0.125 and 8 kHz. The audiometric frequencies tested were: 1, 1.5, 2, 3, 4, 6, 8, 0.75, 0.5, 0.25, and 0.125 kHz in the given order. Contralateral masking was used when necessary, in line with Favier et al. (2018).
Hearing Status of Subjects
Following the conventional manual audiometry with the Reference audiometer, a Pure-Tone Average (PTA) was computed for each ear by averaging audiometric thresholds measured at the following frequencies: 500, 1000, 2000, and 4000 Hz (in line with the French BIAP Recommendation, 1996). The PTA of each ear was next linked to a specific hearing status as shown in Table 8 in line with the French BIAP Recommendation. Subjects had PTA ranging from normal to severe hearing loss.
Age and Hearing status of Subjects Tested in Study 2.

Automated AC and BC Audiometry Procedure
For both AC and BC automated ML-based audiometry tests, eight pure pulsed tones of the same level and frequency were presented on each trial. The use of multiple pulses was chosen to promote pulse detection in patients with tinnitus that might interfere with pure-tone detection. The duration of each pulse was 250 ms, including a 20 ms sinusoidal ramp at the start and stop of each signal. The pulsed tones were terminated as soon as the subject responded. Silence intervals of 250 ms separated each pulse tone (interpulse interval). The duration between two distinct test tones (interstimulus interval) was between 2 to 5.5 s with a jitter to avoid predictability effects.
Initialization Phase
In line with Schlittenlacher et al. (2018) and Wallaert et al. (2024) for ML-based AC audiometry, an Initialization phase is performed in order to approximate the hearing thresholds of the subject for the following audiometric frequencies: 1, 1.5, 2, 3, 4, 6, 8, 0.75, 0.5, 0.25, and 0.125 kHz. For ML-based AC audiometry, the first test sound is presented at a frequency of 1 kHz and an intensity level of 60 dB HL. When the stimulus is heard, the intensity level is decreased in 20 dB steps until it is no longer audible. If it is not heard, the intensity level is increased by 20 dB until the sound is audible for all frequencies. This procedure is repeated until both a positive and a negative response are obtained. For intensity levels over 70 and 80 dB HL, the step size is reduced to 10 and 5 dB, respectively. The next test tone is 1.5 kHz, and is presented at a level −20 dB below the last intensity tested if the last tested sound was heard. If not, a level of +20 dB was used. Overall, for all 11 audiometric frequencies tested, both positive and negative responses are obtained. Hence, a minimum of 22 test stimuli is used.
For the extreme audiometric frequencies at the ends of the audiogram, the “increase” step size was reduced to 10 dB instead of 20 dB. This allowed a finer estimate of those thresholds which in turn lowers the number of test points during the subsequent Testing phase.
For ML-based BC audiometry, the first test tone is set at 1 kHz, at an intensity of 5 dB SL relative to the AC threshold. If the sound is heard, the intensity is lowered by 20 dB until the sound is no longer heard. If no sound is heard, the next audiometric frequency (i.e., 1.5 kHz) is presented at 5 dB SL relative to the AC threshold. If the last sound tested was not heard, the stimulation intensity for the next audiometric frequency tested is set at 20 dB above or at 5 dB SL relative to the AC threshold, whichever is lower.
The positive and negative responses obtained during the Initialization phase provide a first approximation of the audiometry for estimating the audiogram using a Gaussian process classifier (GP; Rasmussen & Williams, 2006). This classifier provides a Gaussian distribution of response probabilities for all intensity and frequency combinations. The frequency/intensity combination for which the average probability according to the GP classifier is closest to 0.5 is considered the current audiogram estimate. The GP incorporates prior knowledge within its covariance function (kernel) - covariance between different audiometric points. For instance, frequency-wise, a squared exponential kernel with a length scale of 0.5 octaves captures the fact that thresholds at adjacent frequencies are correlated (Bisgaard et al., 2010; Schlittenlacher et al., 2018). On the intensity side, the GP linear kernel captures the fact that the probability of a sound being heard increases with increasing intensity. This parameterization of the GP function, along with the experimentally obtained responses is used to generate a latent function, processed via a likelihood function. The GP linear kernel initially has a zero mean, which is equivalent to agreeing on a threshold level of 0 dB HL prior to any measurement.
In line with Schlittenlacher et al. (2018), the likelihood function of the GP takes the form of a Gaussian cumulative density function, with a set standard deviation of 3 dB, considered to approximate the slope of the psychometric function. The likelihood function was scaled to cover probabilities between 0.01 and 0.99. Subjects are assumed to make “errors” in their responses (misses or false alarms), for example, due to accidentally pressing or not the answer button on average in 1 out of 100 trials. Since our stimuli are relatively long (8 pulsed tones, in comparison to 3 tones used in Schlittenlacher, the error rate is expected to be lower than what has been previously observed (miss rate measured in Schlittenlacher et al., 2018 at 1.2% and false alarm rate measured at about 4.1%).
Testing Phase
In line with Schlittenlacher et al. (2018) and Wallaert et al. (2024) for ML-based AC audiometry, the Bayesian active learning mechanism uses the probabilities given by the GP function to select the next tone intensity and frequency in order to maximize the mutual information between the expected response and the GP estimate (Houlsby et al., 2011).
the second term is the expected conditional response entropy given the GP function estimate,
H is the Shannon entropy (Shannon, 1948),
D are the answers already obtained,
x* represents the frequency and signal intensity level for the next test,
y* represents the expected answer, and
ϴ represents the GP function.
Choosing the intensity/frequency pair in such a way that minimizes uncertainty (Gardner et al., 2015; Schlittenlacher et al., 2018) also allows the tested frequencies to vary widely from one another (i.e., back-to-back frequencies can be far apart), thus avoiding predictability issues - for instance, with noncooperative patients.
BC thresholds are tested only for the frequency range at which at least one positive response was obtained at an intensity of 5 dB SL relative to the AC threshold during the Initialization phase. The bandwidth tested for BC audiometry is limited, as in clinical practice, BC thresholds are assumed to not be lower (i.e., worse) than AC thresholds.
Stopping Criteria
Two stopping criterion values were implemented. The first criterion was fixed at a minimum of 50 trials and a maximum of 70 trials following the end of the Initialization phase for AC audiometry and 15 trials and a maximum of 50 trials for BC audiometry. The second criterion was based on the uncertainty of the threshold prediction which is estimated as ± 1 SD around the threshold estimated by the model. The criterion is reached when the biggest uncertainty is <6 dB.
General Safety Limits for Automated Audiometry Procedure
For AC audiometry, the maximum stimulation level was set by the limits of the transducers in line with IEC 60645:1–2017 for type 2 audiometers (60 dB HL for 0.125 kHz, 80 dB HL for 0.25 kHz, 110 dB HL for 0.5 to 4 kHz, 100 dB HL for 6 kHz, and 90 dB HL for 8 kHz). For BC audiometry, the maximum stimulation level was also set by the limits of the transducers in line with IEC 60645:1–2017 for type 2 audiometers (45 dB HL for 0.25 kHz, 60 dB HL for 0.5, 70 dB HL for 1 to 3 kHz, and 60 dB HL for 4 kHz).
Next, in order to test subjects with severe hearing loss with maximum safety in terms of high-intensity sound exposure, the variation intensity step is reduced to 5 dB during the Initialization phase when the stimulus intensity level exceeds 80 dB HL in order to guarantee that hearing-impaired subjects are not presented with excessively high sound levels. This limits auditory overstimulation and uncomfortable levels that could occur due to loudness recruitment (i.e., abnormally rapid growth of the sensation of sound force in the presence of hearing loss). Similarly, during the test phase following Initialization, whenever the stimulation intensity to be presented is above 80 dB HL, a safety limit is imposed such that the stimulation intensity cannot be higher than 5 dB with respect to the last point tested within the concerned octave.
Addition of Positive and Negative Transient Responses During Initialization Phase When Necessary
During the Initialization phase, if the subject provides no response for a subset of frequencies due to the presence of either severe hearing loss or an unresponsive cochlear region, then, for the subsequent Testing phase, the audiogram and uncertainty estimates are only assessed for that particular subset of frequencies that the subject can still hear. More precisely, in the absence of a subject's positive answer, transient positive responses are added automatically above the maximum testable intensity to limit additional test stimuli to be presented beyond this level during the Testing phase. Similarly, transient negative responses are added automatically below the measurement range (i.e., below −20 dB HL) in the absence of a subject's negative answer. These transient responses constrain the threshold search interval zones during the Testing phase. In fact, if no response is obtained on more than two consecutive audiometric frequencies following the Initialization phase, these frequencies are not tested during the Testing phase. Finally, the transient responses are not taken into account for the final audiogram calculation, and those points are highlighted as transient responses (i.e., not subject responses) in the audiogram display.
Automated Contralateral Masking for AC Audiometry
In line with Wallaert et al. (2024), the standard protocol for automated AC audiometry is to always apply contralateral masking using narrow-band noise when the test stimulus to be presented is over 35 dB HL (Munro and Agnew, 1999). The maximum masking intensity is set at 80 dB HL. Masking noise began randomly in the 1–3 s interval before the onset of the pure-tone sequence. This ensures that inadvertent response button presses at the onset of the masking noise are not considered as the subject actually hearing the test stimuli. The masker remained present for a total of 5 to 8 s The noise ramped on for 70 ms at the beginning of the intersequence interval and ramped off during the final 70 ms.
Like for manual audiometry, for each test sound, an efficacy criterion (i.e., the minimum masking intensity necessary to effectively mask the contribution of the contralateral nontest ear, Favier et al., 2018) and a no-overmasking criterion (i.e., the maximum masking intensity applicable to the contralateral or nontest ear above which the masking noise could be heard by the test ear and may impact the detection of the test stimuli, Favier et al., 2018) are calculated to determine the masking intensity needed for the nontest ear.
The efficacy criterion (Meff, in dB) for automated AC audiometry is calculated as follows:
Meff = PL − IA −Masking Min + ABG of NTE
The no-overmasking criterion (Mnov, in dB) for automated AC audiometry corresponds to:
Mnov = PL − ABG of TE + IA − Masking Max
(Key: TE = Test ear, NTE = Nontest ear, ABG = Air Bone Gap, PL = Presentation Level, IA = Interaural Attenuation)
The final Masking value is determined as follows:
If Meff > Mnov, the masking value used is Meff. If Meff = Mnov, the masking value used is Meff. If Meff < Mnov, the masking value used is the arithmetic mean of Meff and Mnov.
In this case, a warning message appears on the software interface at the end of the test stating that “the thresholds obtained may be adversely affected by contralateral masking. Ipsilateral Rainville masking is recommended” (Rainville, 1962).
The Masking Max is set at 0 dB, and refers to the maximum signal-to-noise ratio at the level of the inner test ear that ensures detection of the test stimuli despite the presence of masking noise in the nontest ear. In fact, pure-tone detection is still possible at a signal-to-noise ratio of around −5 to −10 dB in the presence of a narrow-band masker (Moore et al., 1998).
The Masking Min is set at −20 dB, and refers to the minimum signal-to-noise ratio observed at the level of the nontest (inner) ear to ensure full masking of the nontest ear.
The value of the Interaural Attenuation (IA, in dB) used to calculate masking is determined as a function of the specific on-ear transducer used to perform the audiometry test, and is also dependent on the test frequency. Interaural attenuation values available from the literature have been implemented for the specific TDH39 headphones used (Munro & Agnew, 1999).
The Air Bone Gap (ABG) of the nontest ear refers to one of the following:
When no previous audiometry results are available (as in the current study for the first ear tested per subject), a 40-dB ABG assumption is adopted. When only the AC threshold is available (as in the current study for the second ear tested per subject), ABG is defined as being equal to the estimated AC threshold at the frequency tested divided by a coefficient, depending on the suspected hearing loss etiology from the result of the Lateralization test. If there is no evidence to suggest conductive hearing loss, the ABG of the NTE is estimated from the air conduction pure-tone threshold divided by a factor [3 + [(AC Threshold of NTE/120)*2]]. When conductive hearing loss is suspected, the division coefficient is between [1 + (AC Threshold of NTE/120)].
The Air Bone Gap (ABG) of the test ear is unknown in the absence of BC thresholds. Here, we adopted the worst-case assumption for the calculation of masking, i.e., cases whereby the risk of conductive hearing loss is maximal. Clinically, this maximum audiometric ABG for any given frequency is considered to be 60 dB HL (Reger, 1944, but see also de Wolf et al., 2015; Zernotti et al., 2013). Hence, this maximum value was systematically used for the current study.
In fact, the Masking Max currently at 0 dB could be set lower (at ∼−5 or −10 dB), and the Masking Min currently at −20 dB could be set higher (at ∼−10 or −15 dB). Together, this provides an overall ∼10–20 dB range allowing for appropriate masking considering the presence of unknown parameters (see Supporting Information of Wallaert et al., 2024 for example cases of contralateral masking).
Automated Contralateral Masking for BC Audiometry
The standard protocol for automated BC audiometry is to always apply contralateral masking, irrespective of the stimulation level. The maximum masking intensity is set at 80 dB HL.
The efficacy criterion (Meff, in dB) for automated BC audiometry is calculated as follows:
Meff = PL - Masking Min + ABG of NTE
The no-overmasking criterion (Mnov, in dB) for automated BC audiometry corresponds to:
Mnov = PL + IA − Masking Max
The final masking value is determined as for automated AC audiometry (see Methods section “Automated Contralateral masking for AC Audiometry”). Similarly to automated AC tests, the Masking Max is set at 0 dB and the Masking Min is set at −20 dB.
The value of the transcranial transfer (TT) during BC audiometry is considered independent of the frequency and of the transducer used (Reinfeldt et al., 2013). Hence, the interaural attenuation (IA) value corresponds to 0 dB - which is the default value applied.
As only AC thresholds are available prior to BC thresholds, Air Bone Gap (ABG) of the nontest ear (NTE) is defined as in the Methods section “Automated Contralateral masking for AC Audiometry”; i.e., equal to AC threshold at the frequency tested divided by a coefficient, depending on the suspected hearing loss etiology from the result of the Lateralization test. If there is no evidence to suggest conductive hearing loss, the ABG of the NTE corresponds to [3 + [(AC Threshold of NTE/120)*2]]. When conductive hearing loss is suspected, the ABG corresponds to [1 + (AC Threshold of NTE/120)].
Compensating for Occlusion Effects for Automated BC Audiometry
In addition to masking, for automated BC tests, the level of bone conduction stimulation was corrected to compensate for the occlusion effect measured in Study 1 (see Table 7, last column of Study 1). For Study 2, we only used TDH39 headphones with noise-attenuating shells for masking purposes during BC tests, hence values corresponding to this specific transducer obtained from Study 1 were applied here.
Measurement of Thresholds and Calculating Air-Bone Gaps
While the two manual audiograms (Reference and manual ML-audiometry) were obtained using the same procedure, they differed with regard to the apparatus used (transducers used).
The automated ML-audiometry differed from the two manual audiograms as it assessed continuous threshold estimates in terms of frequency and provided confidence interval estimates. For comparison purposes, the thresholds of the automated ML-audiometry were discretized to the conventional audiometric frequencies. Importantly, the manual measures differed from the automated measures with regard to the threshold definition. The two manual audiometry approaches measured the subject's threshold using the asymmetric up-down procedure. In contrast, the automated ML-audiometry defined threshold as the predicted 50% audible contour (in line with Schlittenlacher et al., 2018 and Wallaert et al., 2024).
Air-bone gaps (ABG) were computed as the difference between AC and BC audiometric thresholds:
Reference ABG = AC Reference − BC Reference Manual ML-audiometry ABG = AC Manual ML-audiometry − BC Manual ML-audiometry Automated ML-audiometry ABG = AC Automated ML-audiometry − BC Automated ML-audiometry
Statistical Tests
See Methods section “Statistical Tests” of Study 1.
Results
Comparison of Manual and Automated BC Thresholds
Figure 3a shows the BC thresholds measured manually using the Reference audiometer (in black color; thin lines show individual ears, n = 98 ears; thick line shows mean of all ears; shaded area represents SD). Figure 3b shows the BC thresholds measured manually using the ML-audiometry software, and Figure 3c shows the BC thresholds measured in an automated manner using the ML-audiometry software. Figure 3d summarizes the mean BC thresholds for the different conditions tested.

Manual and automated measures of BC and AC audiometry.
The mean raw signed and absolute differences in BC thresholds for all 98 ears are shown in Table 9 (for individual frequencies, see Supplementary Tables S5 and S6). These values are similar to automated measures of BC pure-tone audiometry measured in Eikelboom et al. (2013) for 47 participants using an automated audiometry device, AMTAS. In comparison to manual conventional measures, the automated measures from Eikelboom et al. (2013) differed by 0 ± 7.7 dB, and the mean absolute differences ranged from 7.2 to 11.9 dB, with SD ranging from 6.2 to 8.8 dB.
Raw and Absolute Differences Between BC Threshold Measures (First Measure - Second one).

Performance or accuracy comparisons between the three different methods were also carried out by computing the root mean square differences (RMSD) from the raw threshold differences. The overall RMSD for all subjects tested here when comparing the automated ML-audiometer with the Reference audiometer = 7.48 dB (Table 10). When comparing the manual and automated ML-audiometer, the overall RMSD = 5.05 dB.
RMSD Comparisons in BC Audiometry Measures.

When comparing raw thresholds, the three BC threshold measures (manual Reference, and manual and automated ML-audiometer) did not differ significantly, Kruskal-Wallis H test, χ2(2) = 1.58, p = .454. Supplementary Table S7 shows post hoc p values for individual frequencies (all post hoc differences were nonsignificant, p > .05).
For all subjects, the automated BC threshold measures with the ML-audiometer took on average 5.06 ± 1.42 minutes (mean ± SD; min–max = 2.39–9.37 minutes) to obtain pseudo-continuous audiometry thresholds with 1-dB precision, as well as uncertainty estimates. The manual Reference audiometry and manual ML-audiometer took on average 3.12 ± 0.51 minutes (min-max=1.29–4.59 minutes) to obtain discrete thresholds at 9 discrete frequencies with 5-dB steps.
Comparison of Manual and Automated AC Thresholds
Figure 3e shows the AC thresholds measured manually using a Reference audiometer (in black color; thin lines show individual ears, n = 98 ears; thick line shows mean of all ears; shaded area represents SD). Figure 3f shows the AC thresholds measured manually using the ML-audiometer software, and Figure 3g shows the AC thresholds measured in an automated manner using the ML-audiometer software. Figure 3h summarizes the mean AC thresholds for the different conditions tested.
The mean raw signed and absolute differences in AC thresholds for all 98 ears are shown in Table 11. When comparing raw thresholds, the three AC threshold measures (manual Reference, and manual and automated ML-audiometer) did not differ significantly, Kruskal-Wallis H test, χ2(2) = 4.01, p = .135.
Raw and Absolute Differences Between AC Threshold Measures (First Measure—Second one).

For all subjects, the automated AC threshold measures with the ML-audiometer took on average 9.48 ± 2.27 minutes (mean ± SD; min–max = 4.20–14.54 minutes) to obtain pseudo-continuous audiometry thresholds with 1-dB precision, as well as uncertainty estimates. The manual Reference audiometry and manual ML-audiometer took on average 6.33 ± 1.26 minutes (min-max=3.30–11.45 minutes) minutes to obtain discrete thresholds at 11 discrete frequencies with 5-dB steps.
Comparison of Manual and Automated Air-Bone Gaps
Next, the air-bone gap (ABG) was measured by calculating the difference between AC and BC thresholds using each of the three methods. Figure 4a shows the ABG values measured manually using the Reference audiometer. Figure 4b shows the ABG values measured manually using the ML-audiometry software, and Figure 4c shows the ABG values measured in an automated manner using the ML-audiometry software. Figure 4d summarizes the mean ABG measures with the three methods. The mean absolute differences in ABG measures using the three methods for all 98 ears are shown in Table 12. Importantly, when comparing the three ABG measures for all subjects, no significant difference was found, Kruskal-Wallis H test, χ2(2) = −1.92, p = .098.

Manual and automated measures of air-bone gaps (ABG).
Absolute Differences in air-Bone Gaps for All Subjects.

Comparison of Manual and Automated Air-Bone Gaps of Over 5 dB HL
Next, we isolated the data for a subset of subjects with a mean ABG at 0.5, 1, 2, and 4 kHz computed manually using the Reference audiometer that was higher than 5 dB (n = 26 ears). All ears included also had a Reference ABG higher than 10 dB for at least two audiometric frequencies. The mean Reference ABG for this subset of subjects corresponds to 19.7 ± 11.3 dB (min–max ABG = 6.3–42.5 dB, see Supplementary Figure S2).
Figure 4e, 4f, and 4g shows the ABG values measured for this subset of subjects manually using the Reference audiometer, manually using the ML-audiometry software, and in an automated manner using the ML-audiometry software, respectively. Figure 4h summarizes the mean ABG measures with the three methods for this subset of subjects. The mean absolute differences in ABG measures using the three methods for this subset of subjects are shown in Table 13. When comparing the three ABG measures for this subset of subjects, no significant difference was found, Kruskal-Wallis H test, χ2(2) = 5.46, p = .065.
Absolute Differences in air-Bone Gaps for Subset of Subjects with air-Bone Gaps Superior Than 5 dB.

Study 3: Test–Retest Reliability of ML-Based BC Pure-Tone Thresholds With Forehead Positioning
The main goal of Study 3 is to examine the test-retest reliability of the automated ML-based BC audiometry.
Methods
To examine the test-retest reliability of the manual and automated ML-audiometry for BC pure-tone audiometry, we measured the BC audiograms of a different subset of subjects (n = 30 subjects, 60 tested ears; 14 men; 16 women) twice. The mean age of subjects tested was 52.07 ± 21.93 (min–max: 18–88 years) and the hearing status of the tested ears was distributed as follows: 27 NH ears and 33 HI ears (PTA > 20 dB HL).
The test-retest measures were carried out with the ML-audiometry software either in a manual fashion or in a fully automated manner. The test-retest measures were spaced by a maximum of 3 months, and no notable otological history could be identified during this period.
Results
Test–Retest Reliability of Automated ML-Based BC Audiometry
For all 60 ears tested, the mean signed difference between the two automated ML-based BC measures was −0.27 ± 5.19 dB and the mean absolute difference was 3.54 ± 3.80 dB HL (Figure 5; Table 14; see also Supplementary Table S8). No significant difference was observed between the test-retest measures, Kruskal-Wallis H test, χ2(1) = 1.28, p = .258; all post hoc differences for individual frequencies > 0.05, see Supplementary Table S9. The overall RMSD for the test-retest automated BC measures was equal to 5.19 dB (normal-hearing subjects: 3.99 dB; hearing-impaired subjects: 6.01 dB).
Test-retest BC thresholds measured with ML-audiometer.
Test-Retest Reliability of BC Thresholds from Manual and Automated ML-Audiometry.

Test–Retest Reliability of Manual ML-Based BC Audiometry
For comparison, we also examined the test–retest reliability of the manual ML-based BC measures for the same subset of subjects (n = 30) twice. The mean signed difference between the two manual ML-audiometry measures was −0.56 ± 4.11 dB and the mean absolute difference was 2.39 ± 3.38 dB HL (Figure 5; Table 14; see also Supplementary Table S8). No significant difference was observed between the test-retest measures, Kruskal-Wallis H test, χ2(1) = 1.74, p = .188; all post hoc differences for individual frequencies > 0.05, see Supplementary Table S9. The overall RMSD for the test-retest manual BC measures was equal to 4.14 dB (normal-hearing subjects: 3.86 dB; hearing-impaired subjects: 4.38 dB).
Discussion
Today, the demand for hearing care remains largely unaddressed, even in developed countries. To address this major public health issue, several authors have proposed automation of auditory functional explorations using ML approaches (review in Wasmann et al., 2022) to free up medical time for hearing specialists. We previously described and validated the performance and test-retest reliability of a ML-based method for AC pure-tone audiometry (Wallaert et al., 2024). Here, we extend this approach for automated ML-based BC audiometry that can be performed directly after AC testing with the vibrator positioned on the forehead and the headphones positioned on both ears. While the potential positive impact of the improved technical specifications of ML-based audiometry (1-dB step; pseudo-continuous threshold; uncertainty estimates) remains to be established formally, the time gain offered by such test automation is highly valuable. The manual audiometry tests for both AC and BC are on average faster as compared to the proposed ML-based audiometry. However, the fully automated ML-based approach does not require the presence and time of a hearing specialist. In summary, although test automation does not offer any time gain for the patient, it offers medical time-save for the hearing professional.
In Study 1, we examined the psychoacoustic occlusion effects thought to derive from vibrations of the wall of the external canal induced by BC stimulation, producing air pressures in the canal and enhancing the response of the inner ear (Stenfelt, 2011; Stenfelt & Goode, 2005; Tonndorf et al., 1966). In fact, the vibrator is almost systematically positioned on the mastoid process to stimulate the given test ear. However, if the open part of the test ear canal is closed, an occlusion effect is present, whereby the test ear has an increased sensitivity to BC sounds - in particular, at low frequencies (Stenfelt et al., 2003). This occlusion effect depends on the type and position of the occluding device and can produce up to 40 dB increased sensitivity (Stenfelt, 2011). For circumaural devices, the enclosed volume determines the occlusion effect, with greater volume resulting in less occlusion. In addition, the physical occlusion effect measured as a change in ear canal sound pressure is usually about 5–10 dB greater than the psychoacoustic occlusion effect measured as an improvement in BC hearing thresholds (Geal-Dor et al., 2020; Margolis & Moore, 2011; Stenfelt and Reinfelt, 2007). Since our automated BC measures in Study 2 should take into account the occlusion effects produced by TDH39 headphones with noise-attenuating shells positioned on the test ear, we first obtained the mean frequency-by-frequency compensating values for the occlusion effects (see column 6 of Table 7). Those mean values may nevertheless under- or overcompensate the occlusion effects for individual subjects as the intersubject variability is rather large (see SD in column 5 of Table 7). However, the occlusion effects found here (Table 7) are in line with Stenfelt and Reinfelt (2007), as the authors found occlusion values of about 20 dB for 0.25 kHz, 10 dB at 1 kHz, and close to 0 dB for frequencies above 2 kHz (see Figure 8 in Stenfelt & Reinfelt, 2007). In contrast, the occlusion effects with masking produced by the circumaural earphone such as Sennheiser HDA 200 can be considered negligible at all tested frequencies (see column 3 of Table 7). Finally, the small decrease in thresholds above 2 kHz (Figure 1) is likely the result of incorrect reference equivalent threshold force levels (RETFLs) that have been previously discussed (Margolis et al., 2013).
A second key point when measuring BC thresholds is to appropriately mask the nontest ear. The conventional mastoid process positioning of the vibrator may sometimes lead audiologists to the common mistake that only the ear closest to the vibrator is being tested. With the forehead positioning, it is clear that to obtain the responses of only the test ear, the nontest ear should be properly masked. For the ML-based method, we used conservative contralateral masking rules as detailed in the Methods section. In fact, by default when no previous audiometry results are available, the software assumes a 40-dB air-bone gap for the nontest ear. In the current study, AC audiometry was systematically performed before BC audiometry for each of the three methods: Reference audiometry, Manual ML-audiometry, and Automated ML-audiometry. Hence, for the Automated ML-audiometry, the air-bone gap calculations are based on the previously obtained AC thresholds. In fact, the “worst-case scenario” is assumed, i.e., the highest air-bone gap is assumed at individual frequencies. For example, in case of a suspected conductive hearing loss following the Lateralization test, the air-bone gap is estimated as the AC thresholds divided by a factor of 1 or 2 which limits the maximum air-bone gap value to 60 dB (Reger, 1944). In case of a suspected sensorineural hearing loss, the air-bone gap is estimated as the AC threshold divided by a factor of 3 to 5, which limits the maximum air-bone gap value to 24 dB. In addition, as for masking in AC audiometry, the Masking Max and Masking Min parameters provide an overall ∼10–20 dB range for appropriate masking.
In Study 2, we showed that the accuracy of automated ML-based BC audiometry with forehead placement was not statistically different as compared to conventional, well-established manual Reference audiometry with mastoid placement when applying (a) appropriate mastoid-forehead corrections (in line with ANSI 1996; see also Supplementary Table S10 for a comparison of forehead-mastoid conversion values from Study 1 with ANSI standards), (b) compensation for occlusion effects of the test ear (see Study 1, Table 7), and (c) automated contralateral masking to the nontest ear (see Study 2, Methods section “Automated Contralateral masking for AC Audiometry” and “Automated Contralateral masking for BC Audiometry”). The mean absolute difference between manual Reference and automated ML-audiometer measures was approximately 6 dB (5.95 ± 4.54 dB). The mean absolute difference between manual and automated ML-audiometer measures was less than 5 dB (3.85 ± 3.27 dB). Although the absolute difference between the manual and automated ML-audiometer was smaller than that obtained between manual Reference and automated ML-audiometer, all three measures were not significantly different from one another. This discrepancy may be due to small calibration differences or differences in the overall equipment used. Importantly, the difference in air-bone gaps traditionally used to quantify conductive hearing loss was also less than 5 dB (difference between manual and automated ML-audiometer: 4.76 ± 4.83 dB). Finally, it is also key to point out that since the automated ML approach systematically applies compensation for occlusion effects (Table 7) for all subjects tested here, the ABG of subjects with conductive components may be erroneously reduced (with larger effect at low frequencies). Future improvements in the ML approach should consider this point.
In Study 3, we demonstrated the test-retest reliability of manual and automated ML-audiometry measures and showed non-significant differences (both raw and absolute differences <5 dB). These results are slightly better than previous reports of automated test-retest BC measures (e.g., Swanepoel & Biagio, 2011; 7.1 ± 6.4 dB). In addition, the automated measures were not more reliable than the manual measures, which include human variability. However, as shown previously, the forehead placement seems to provide highly repeatable results and small intersubject variability (Studebaker, 1962). Together, our results support the use of the proposed automated ML-based BC audiometry for adult listeners with a wide range of audiometric configurations and hearing-loss types.
Although automated pure-tone audiometry using ML approaches has been repeatedly discussed in the audiology and hearing research literature recently (e.g., Barbour et al., 2019a, 2019b; Cox & de Vries, 2015; 2021; Schlittenlacher et al., 2018; Song et al., 2015, 2017), it is rarely used in daily clinical practice for hearing assessments. Indeed, validated medical devices present on the market, such as the AMTAS (Margolis et al., 2007, 2010; Margolis and Moore, 2011) seem to provide automated audiometry measures that are in good agreement with those of experienced audiologists. However, automated methods should be expanded to allow testing of patients with severe hearing-loss (as assessed here), as well as children, and other fragile patient populations with the inclusion of key quality indicators of test accuracy to further enhance their adoption by hearing professionals (Margolis et al., 2007).
Supplemental Material
sj-pdf-1-tia-10.1177_23312165241286456 - Supplemental material for Performance and Reliability Evaluation of an Automated Bone-Conduction Audiometry Using Machine Learning
Supplemental material, sj-pdf-1-tia-10.1177_23312165241286456 for Performance and Reliability Evaluation of an Automated Bone-Conduction Audiometry Using Machine Learning by Nicolas Wallaert, Antoine Perry, Hadrien Jean, Gwenaelle Creff, Benoit Godey and Nihaad Paraouty in Trends in Hearing
Footnotes
Acknowledgments
The work was supported by the French national i-Nov Grant (NW, DOS0127610/00) and Région Grand Est Deeptech-BPI France Grant (NW).
Author Contributions
NW, GC, BG and NP designed research; NW secured funding; NW, AP, and HJ developed software; NW, BG, and GC collected behavioral data; NP analyzed data; NW, BG, GC, and NP wrote the manuscript.
Data Availability Statement
Data can be shared upon email request to the last author.
Declaration of Conflicting Interests
The author(s) declared the following potential conflicts of interest with respect to the research, authorship, and/or publication of this article: NW has a patent pending on technology described in the manuscript. NW has equity ownership in My Medical Assistant SAS. AP, HJ, and NP receive salary from My Medical Assistant SAS. BG and CF declare no competing interests with respect to the research, authorship, and/or publication of this article.
Funding
The author(s) disclosed receipt of the following financial support for the research, authorship, and/or publication of this article: This work was supported by the Région Grand Est Deeptech - BPI France Grant, and French national i-Nov Grant (grant number 2023, DOS0127610/00).
References
Supplementary Material
Please find the following supplemental material available below.
For Open Access articles published under a Creative Commons License, all supplemental material carries the same license as the article it is associated with.
For non-Open Access articles published, all supplemental material carries a non-exclusive license, and permission requests for re-use of supplemental material or any part of supplemental material shall be sent directly to the copyright owner as specified in the copyright notice associated with the article.