
Abstract
Sound localization is an important ability in everyday life. This study investigates the influence of vision and presentation mode on auditory spatial bisection performance. Subjects were asked to identify the smaller perceived distance between three consecutive stimuli that were either presented via loudspeakers (free field) or via headphones after convolution with generic head-related impulse responses (binaural reproduction). Thirteen azimuthal sound incidence angles on a circular arc segment of ±24° at a radius of 3 m were included in three regions of space (front, rear, and laterally left). Twenty normally sighted (measured both sighted and blindfolded) and eight blind persons participated. Results showed no significant differences with respect to visual condition, but strong effects of sound direction and presentation mode. Psychometric functions were steepest in frontal space and indicated median spatial bisection thresholds of 11°–14°. Thresholds increased significantly in rear (11°–17°) and laterally left (20°–28°) space in free field. Individual pinna and torso cues, as available only in free field presentation, improved the performance of all participants compared to binaural reproduction. Especially in rear space, auditory spatial bisection thresholds were three to four times higher (i.e., poorer) using binaural reproduction than in free field. The results underline the importance of individual auditory spatial cues for spatial bisection, irrespective of access to vision, which indicates that vision may not be strictly necessary to calibrate allocentric spatial hearing.
Introduction
Sound localization is a key ability in everyday life for humans (Van Opstal, 2016), which provides important information about the world beyond the visual field and immediate personal space (i.e., beyond direct skin contact). Acoustic information about the localization of an object often complements localization cues provided by the sense of vision. For blind and vision-impaired individuals, localization delivered by the auditory system is therefore even more important than for persons with normal vision, which has inspired a growing body of studies investigating the influence of blindness and blindfolding on acoustic localization performance (for a review, see Voss, 2016).
In free field (FF), persons who were born blind or acquired blindness during early childhood (early blind individuals), are reported to show supra-normal performance with respect to three tasks: (1) for sound localization in the horizontal plane with incident angles close to the interaural axis (Röder et al., 1999; Voss et al., 2004), (2) for relative distance perception (Kolarik et al., 2013; Voss et al., 2004), and (3) for monaural sound localization (Lessard et al., 1998). The latter has been linked at least for some blind individuals to the more efficient usage of spectral cues provided by the pinna and torso (Doucet et al., 2005). Blindfolding sighted individuals worsens absolute sound localization in the horizontal plane (Tabry et al., 2013), indicating that care is needed when interpreting comparisons between blind and sighted individuals with respect to acute and chronic absence of vision for localization.
In contrast to these supra-normal performances, early blind individuals show poorer-than-normal performance for localization tasks in the vertical plane (Zwiers et al., 2001a, 2001b) and for spatial bisection tasks. Spatial bisection tasks are tasks that require judgments of whether one acoustic object is closer in distance to either a second or a third acoustic object (Gori et al., 2014). Spatial bisection thresholds in frontal space were found to be substantially (fourfold) increased in congenitally blind adults (Gori et al., 2014) and children (Vercillo et al., 2016) in comparison to sighted controls, with many blind individuals not being able to perform the task. This significantly poorer performance has been linked to a general inability of blind persons to build and use allocentric spatial representations (Klatzky, 1998) for sound localization. Blind people thus seem to have an enhanced auditory ordinal discrimination, but on an uncalibrated scale. In line with this argumentation are findings that the spatial bisection performance of sighted persons is poorer when tested with stimuli from the rear than from the front (Aggius-Vella et al., 2018), indicating that visual feedback available in the frontal line of sight is important to calibrate for this task. Furthermore, in line with this argumentation is that blindfolded sighted persons show the same spatial bisection performance for lateral-incident as for rear-incident stimuli (Aggius-Vella et al., 2020), neither of which allow for visual feedback.
Other than FF experiments, virtual acoustic presentations offer a separate avenue to study the usage of acoustic cues for orientation and their interaction with visual cues. Different apparent incidence directions of sounds can hereby be realized using binaural reproduction (BR), which means that the acoustic stimulus is convolved with head-related impulse responses (HRIRs; Wightman & Kistler, 1989) prior to presentation over headphones. Databases provide HRIRs recorded in specific rooms for different azimuth and elevation angles. When using “generic” HRIRs that were recorded using an artificial head (e.g., Algazi et al., 2001; Kayser et al., 2009; Wierstorf et al., 2011) subjects are listening with another “person's” pinna and torso cues, which typically leads to impaired auditory spatial perception (Møller et al., 1996). In addition, small head movements that may help in FF for localization (Goossens & Van Opstal, 1999) are excluded when using BR (without explicit tracking and rendering of head movements). Comparisons to FF presentations may then exhibit how important their own pinna and torso cues (Wenzel et al., 1993) and small head movements (Wightman & Kistler, 1999) are for the specific tasks.
BR has not yet been used as extensively to study the effect of blindness and blindfolding on localization as FF presentations: Wersényi (2012) for example compared blind and sighted individuals' localization with BR and found that blind persons were better in detecting movement in the horizontal plane. Sighted persons performed better in the elevation plane and with detecting sources in the back, mirroring some of the findings that FF studies (e.g., Zwiers et al., 2001a, 2001b) provided. Furthermore, BR was used to investigate distance perception (Kolarik et al., 2013, 2017) in blind individuals, and to link their supra-normal monaural sound localization to cortical function (Voss et al., 2011).
To the authors’ knowledge, no previous study directly compared the performance of FF presentation and BR and investigated the interaction with the participants’ vision within a spatial bisection task. The goals of the present study therefore are:
To compare auditory spatial bisection performance between FF presentation and BR for front, rear, and left sound incidence. To investigate the influence of access to visual calibration on auditory spatial bisection performance by comparing sighted to blindfolded conditions, as well as to the performance of early blind individuals.
Based on the work of Møller et al. (1996), we expect better performance in FF than with BR using non-individualized HRIRs, and that the performance reduction due to BR is larger in blind subjects, who may more strongly rely on spatial cues that are present in FF. Furthermore, based on the work of Gori et al. (2014), we expect spatial bisection ability to be better in normal-sighted subjects (i.e., with acute access to vision), most prominently for frontal sound incidence, because these subjects may benefit there from visual calibration.
Methods
Participants
Twenty-eight subjects participated in this study and were divided into two groups. The first group consisted of 20 normal-sighted people (11 male, 9 female) between 22 and 43 years of age (mean: 29 years). The second group consisted of eight blind subjects (4 male, 4 female) between 16 and 60 years of age (mean: 43 years), who can be termed “early blind” (Voss et al., 2004), because their blindness started before age eleven years. Of our subjects, five were blind from birth and three lost eyesight at age seven. At least two blind participants used echolocation in their everyday lives. More details about age, etiology of their vision loss, and classification according to the World Health Organization (WHO, 1989) are shown in Table 1. All persons were blind as defined in agreement with German Law (part A.6.a of rider section 2 VersMedVO): The best-corrected visual acuity on the better eye is a maximum of 2% or there are other severe vision disorders, for instance, a range of vision ≤5° (Grehn, 2012). This means that while residual sensitivity to light was present in some participants, it is very unlikely that these participants were able to use their vision to localize objects. This definition is in agreement with blindness as defined in the studies of Voss et al. (2011) and Kolarik et al. (2017). All participants had normal hearing, which was defined as their pure-tone air conduction thresholds were ≤30 dB hearing level (HL) for all standard audiometric frequencies between 250 and 8000 Hz. The pure-tone average (PTA4, average of hearing levels at 0.5, 1, 2, and 4 kHz) of blind persons is listed in Table 1 as well. All participants gave written informed consent before participating. Ethical approval was granted by the Ethics Committee of the University of Applied Sciences Lübeck (approval 311.012.17 from 11 September 2018).
Details About Blind Individuals.

WHO category: World Health Organization category as a classification according to the WHO (4 means blindness with light perception and 5 blindness without light perception); PTA4: the average hearing threshold for 500 Hz, 1 kHz, 2 kHz, and 4 kHz; f: female; m: male; HL: hearing level.
Apparatus and Calibration
For the FF presentation, 13 loudspeakers (Genelec 8020) were placed on a circular arc with a radius of 3 m and a height of 1.25 m using loudspeaker stands in the anechoic chamber of the University of Applied Sciences Lübeck. The separation between two adjacent loudspeakers was 4°, resulting in a total range of ±24° (see Figure 1). Loudspeakers were connected to a DA-converter (Ferrofish Pulse 16 MX) that received digital stimuli from a standard PC via an external sound card (RME Fireface UFX+). The sound card also fed Sennheiser HD 650 headphones via its headphones output. The BR conditions were measured in the same room.
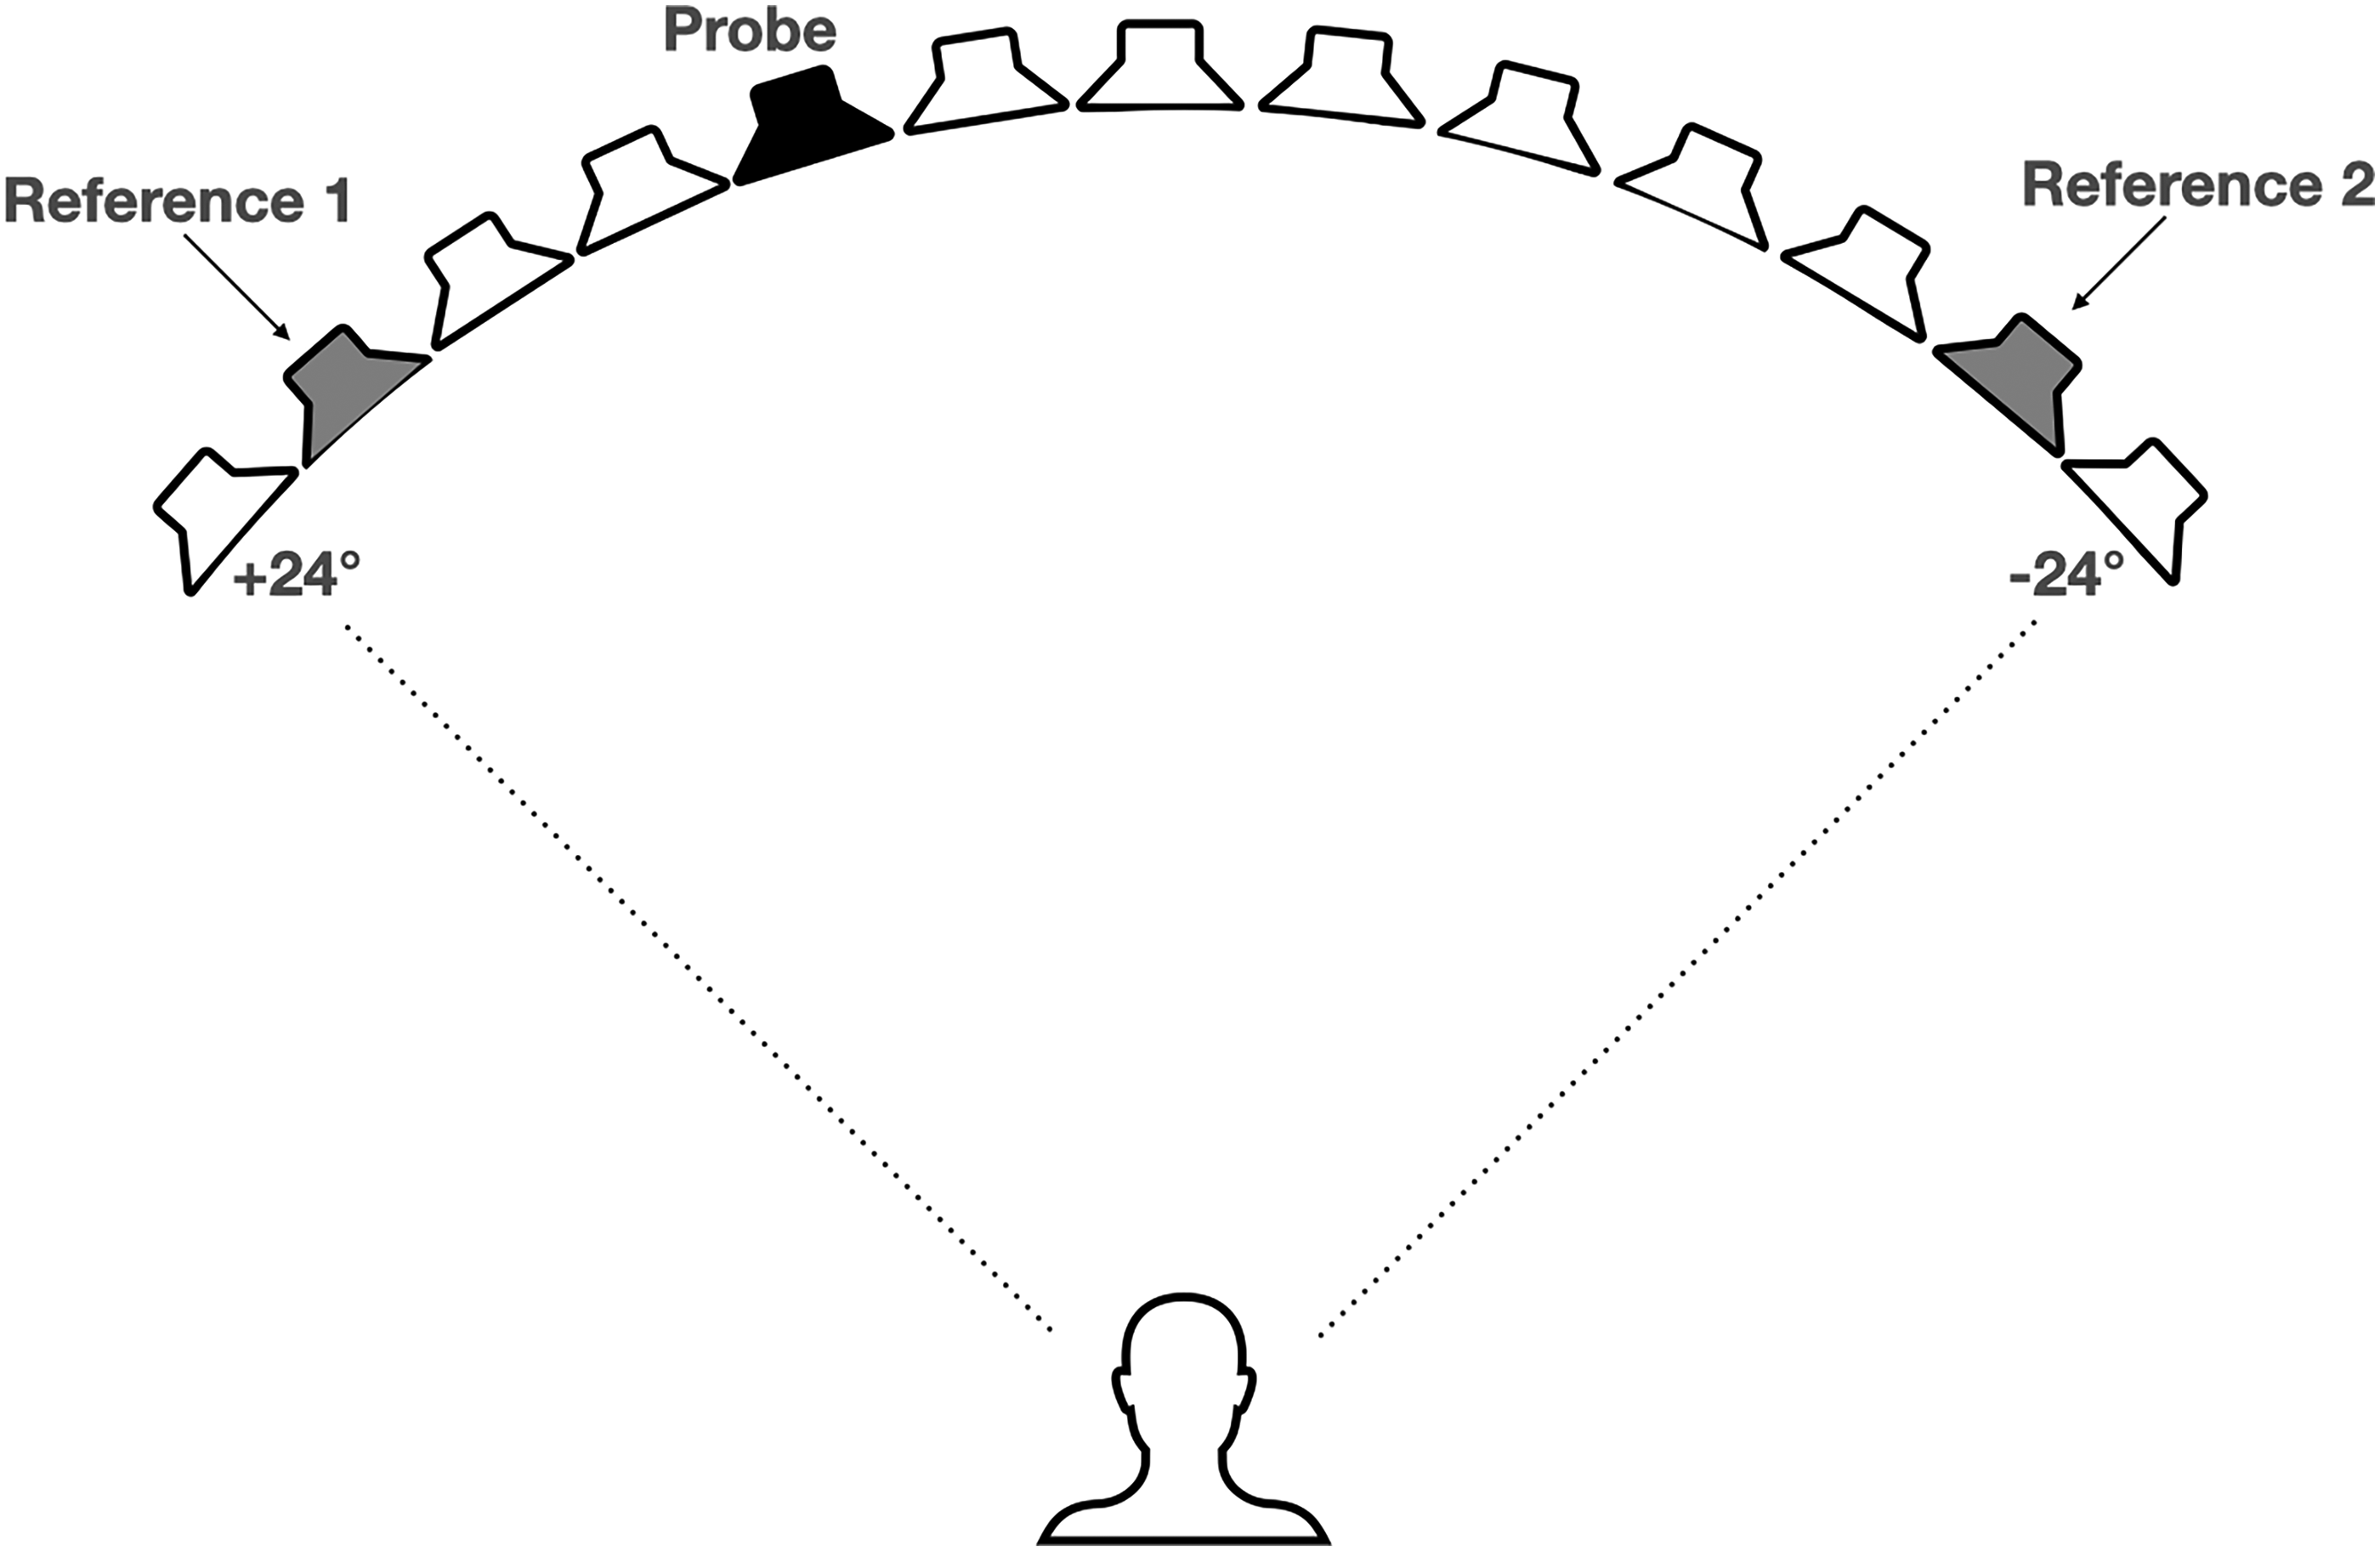
Experimental setup: 13 loudspeakers on a circular arc (radius = 3 m), three consecutive stimuli: references 1 and 2 were presented from one of the outermost loudspeakers right or left and were always 40° apart, the second stimulus was the probe stimulus from a random loudspeaker.
The setup was calibrated to an output level of 65 dB(A) with the white noise stimulus used in the experiments. For the loudspeaker calibration, each loudspeaker was calibrated separately using a sound level meter (NTI XL2) at the subjects’ head position. Each side of the headphones was calibrated using an artificial ear (Brüel & Kjær, B&K type 4153 with 1⁄2″ microphone B&K type 4192, connected to sound level meter B&K type 2250). Headphones were additionally equalized to a flat response at the eardrum by inverting their response on KEMAR as provided in Denk et al. (2018) to compensate for double ear canal transmissions introduced by convolving with eardrum-referenced HRIR (see below).
Stimulus
Bursts of 100 ms running white noise served as stimuli for the experiment, including 10 ms cosine ramps each. The frequency range of the white noise was limited between 65 Hz and 20 kHz, matched to the frequency range of the used loudspeakers. Customized MATLAB (The MathWorks) scripts were used to generate the stimuli and conduct the entire experiment. For BR, stimuli were convolved with HRIRs from Wierstorf et al. (2011) that were recorded using a KEMAR with the same distance to the loudspeakers in an anechoic room. Within the range covered by the loudspeakers (±24°) only HRIRs at loudspeaker positions (4° separation) were used. Additionally, outside of the loudspeaker range, two virtual positions at each side (+32°, +28°, −28°, and −32°) were realized for possible more lateral probe presentations using headphones.
Experimental Conditions
Within the spatial bisection task, listeners were presented with three sequential noise bursts from three different incidence directions. Listeners were asked to rate whether stimuli 1 and 2 or stimuli 2 and 3 were closer together. Each measurement run hereby consisted of 20 such trials, that is, the presentation of three consecutive stimuli. For a left-to-right direction measurement, the first stimulus named “reference 1,” always originated from either +24°, +20°, or +16° (randomly chosen). The second stimulus (probe) was presented from a loudspeaker position that was determined by the adaptive QUEST algorithm (Watson & Pelli, 1983). The third stimulus is “reference 2” which was always presented 40° apart from reference 1. Example stimuli positions are shown in Figure 1. The QUEST algorithm was used similarly as in Aggius-Vella et al. (2020) as a Bayesian algorithm for maximum-likelihood estimation of the stimulus position where the listener perceives both pairs of stimuli with equal distance, depending on whether or not the answer of the subject was correct. The algorithm was implemented using the Psychtoolbox for MATLAB (Brainard, 1997) and uses a priori knowledge about the basic psychometric function and thresholds (for more details, see Appendix: Parameters of the QUEST Algorithm).
In the experiment, two modes of presentation (FF over loudspeakers and BR using headphones), different regions of space (frontal, rear, and lateral left), as well as two different measuring directions (left–right and right–left) were measured. These measurements were conducted with sighted subjects both in a sighted and a blindfolded condition, that is, wearing an opaque mask, and with blind subjects. For both types of presentation, the subject sat on a chair 3 m apart from the loudspeaker setup in the center of the loudspeaker arc. For the frontal space, the subject faced the center (0°) loudspeaker, but was neither instructed to avoid nor encouraged to make head movements. The chair was turned 90° clockwise for lateral left and 180° for rear space measurements. For measurement direction left–right the three consecutive stimuli started on the left side of the circular arc and changed to the right side, for right–left vice versa.
Experimental Procedure
Before starting the experiment, each subject got familiarized with the measurement procedure using two training runs consisting of 20 trials each, one for FF presentation and one for BR, both for frontal incidence and in the left–right direction. Measurements were then conducted in blocks with each block dedicated to a fixed region of space (frontal, rear, or lateral left) in random order. Within each block, the presentation mode (FF or BR) was also blocked in randomized order. Within one of these blocks, the measuring direction was fixed: first left–right followed by right–left. For the sighted subjects, the order of measurements in both vision conditions (sighted and blindfolded) was identical. Blind participants were not blindfolded and thus underwent only one round of measurements in all conditions. This means that “blindfolded participants” in the following only means normally sighted individuals who were blindfolded. Participants attended the experiment in one session of 1.5 h (blind) and about 2 h (sighted) including pauses.
Data Analysis
Initial analysis of presentation directions (left–right and right–left) separately showed that extracted data from left–right presentations were not statistically different from data of right–left presentations. Therefore, the two different measuring directions were combined (pooled) for each subject and measurement condition for subsequent statistical analysis.
The combined (left–right and right–left) data set of each person and measurement condition was normalized to output the percentage of correct subject's responses that the distance of the probe is smaller to reference 1. A logistic psychometric function (Jürgens & Brand, 2009) was fitted to this data. In agreement with Aggius-Vella et al. (2020), two parameters extracted from the fit were further statistically analyzed: Firstly, the threshold, which is defined as the inverse slope of the psychometric function, and secondly, the bias, which is the offset of the 50% point of the psychometric function from center presentation (for instance, 0° for frontal space). An example psychometric function of a subject for one condition is shown in Figure 2. The image shows the probability of the subject's response that the perceived distance between reference 1 and the probe stimulus is smaller than the perceived distance between the probe and reference 2 (circles) as a function of stimulus incidence angle. The corresponding fitted psychometric function is shown as a continuous line. The inverse of the slope at the 50% point (here shown as the straight dashed-dotted line) is defined as the threshold. The threshold is equivalent to the difference of angles between the intersections of 0% and 100% with this straight line (dashed arrow) and therefore indicates how large the transition area is between certainty that the distance to reference 1 or 2 is smaller. The bias (dashed line) is the difference between the angle of the 50% point and the center position, in this case 0°. For the psychometric function shown in Figure 2, the threshold is 7° and the bias 1.4°.
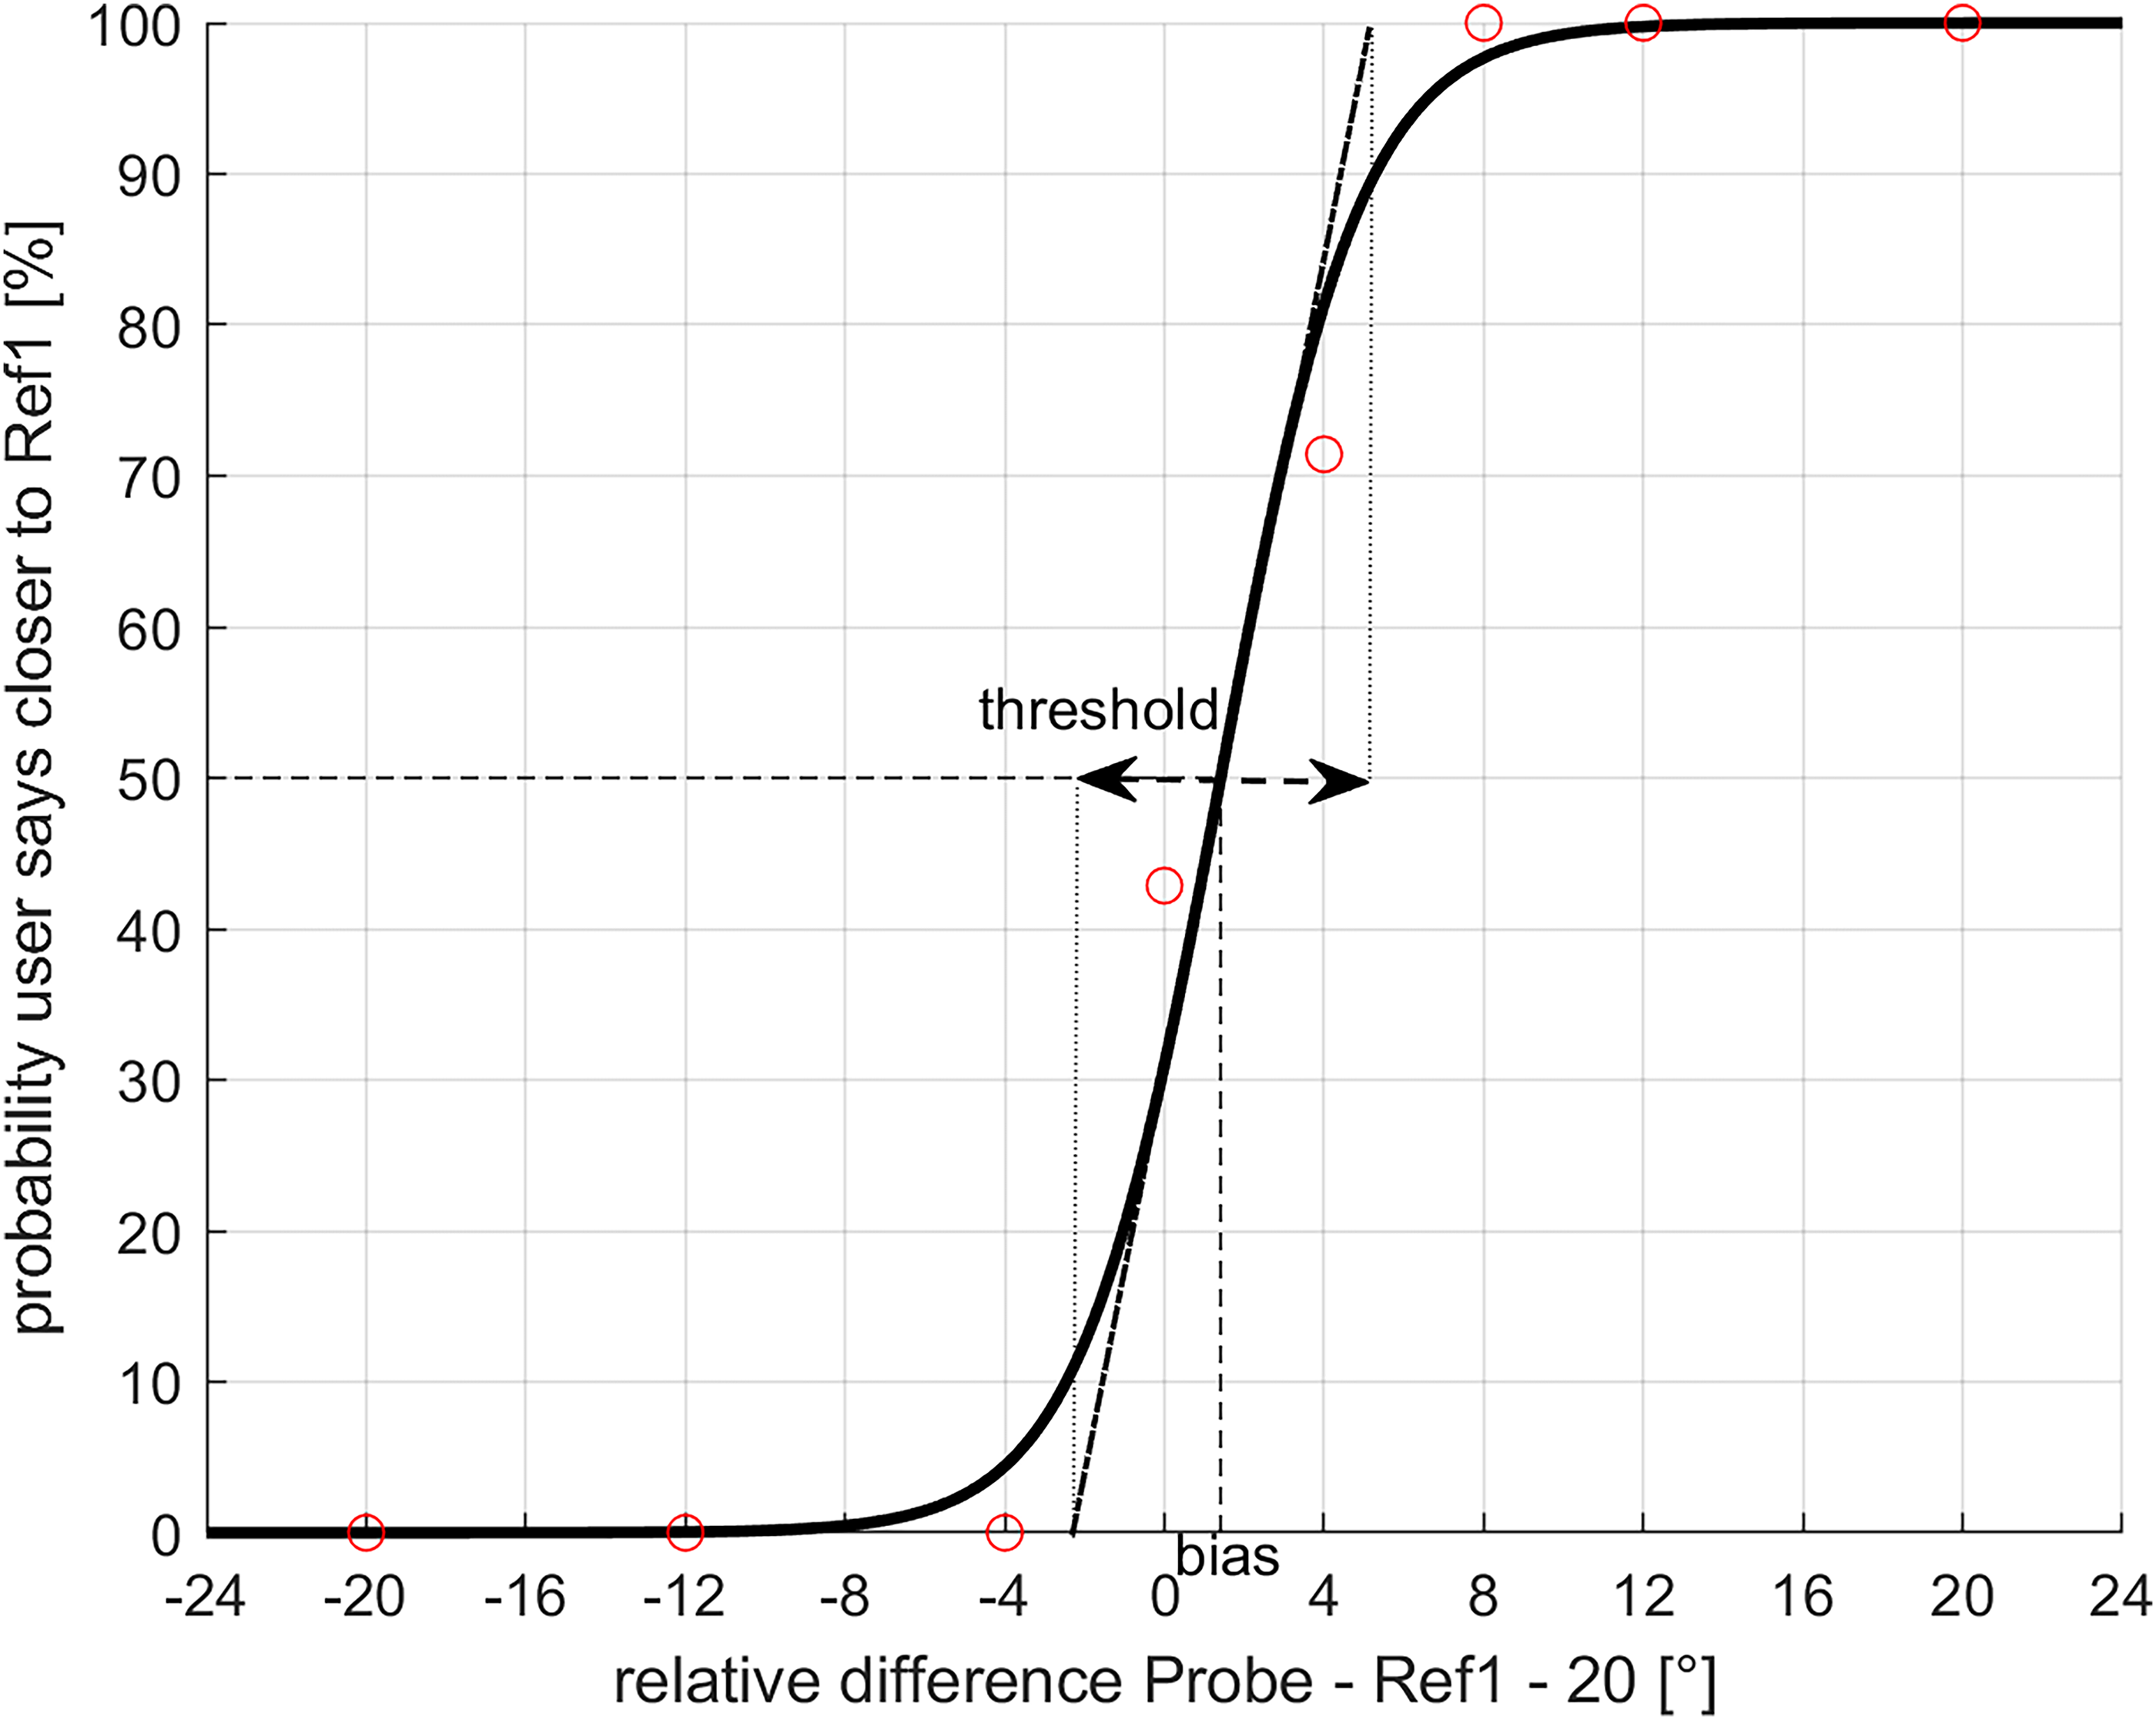
Example psychometric function (solid line) fitted to the combined (left–right and right–left) data of one participant in one condition (circles). Threshold as the inverse slope of psychometric function and bias are shown.
Statistical Analysis
Statistical analysis was done using Jamovi version 2.3 (Jamovi, 2022). Threshold and bias data were first tested for normal distribution using the Shapiro–Wilk test. Due to not-normally distributed data, the non-parametric Friedman test was used for statistical analysis. Significant differences (p < 0.05) that showed up in the pairwise Durbon–Conover test, were post hoc analyzed using non-parametric tests with Bonferroni correction. The type of non-parametric test was chosen based on the composite of the data set, as a Wilcoxon rank-sum test, for the same subject (i.e., contrasting sighted and blindfolded conditions for the sighted subjects or presentation conditions within one subject group) and as Mann–Whitney U test, for different subjects (i.e., sighted and blind subjects).
Results
Figure 3 shows spatial bisection thresholds for frontal, rear, and lateral-left region of space using FF presentation and BR for all participants. FF presentation is closest to the situations that subjects encounter in everyday life most often. Therefore, FF results are presented first. Pooling all participants, there were significantly higher thresholds found in FF for the lateral-left space compared to frontal and rear space (both p < 0.001); in addition, thresholds in rear space were higher than in frontal space (p < 0.001).

Boxplots of spatial bisection thresholds for frontal, rear, and lateral-left measurement quadrants in two modes of presentation (FF and BR). Significant differences are marked with black horizontal brackets at the bottom connecting the respective data within the frontal, rear and lateral-left subpanel. Boxes range from 25th to 75th percentile of data with the median marked as horizontal line. Whiskers extend to 1.5 times the box length and outliers outside whiskers are marked with circles.
Overall, there were significant differences between FF presentation and BR for the frontal (Friedman Test: χ2(1, 96) = 5.33, p = 0.021), rear (Friedman Test: χ2(1, 75) = 32.4, p < 0.001) and lateral-left space (Friedman Test: χ2(1, 89) = 4.12, p = 0.042). Comparing the vision status, there were no significant differences between sighted, blindfolded, or blind individuals in either presentation mode or incidence direction (frontal FF: χ2(2, 48) = 3.39, p = 0.184; frontal BR: χ2(2, 48) = 5.58, p = 0.061; rear FF: χ2(2, 42) = 5.77, p = 0.056; rear BR: χ2(2, 33) = 3.56, p = 0.169; lateral-left FF: χ2(2, 46) = 3.99, p = 0.136; lateral-left BR: χ2(2, 43) = 1.97, p = 0.373). Analyzing BR only, thresholds in lateral-left space were significantly higher than in frontal (t(84) = 59; p < 0.001), and rear space (t(90) = 64; p < 0.001), and thresholds in frontal space were significantly lower than thresholds in rear space (t(77) = 16; p < 0.001).
In frontal space, the average thresholds were between 11° and 14°. Although the thresholds with FF presentation and BR were similar for normally sighted individuals, there were significant differences between both modes of presentation (Wilcoxon rank-sum test: t(40) = 39, p = 0.012). With BR in frontal space, thresholds for blindfolded subjects were significantly higher than thresholds for blind subjects (Mann–Whitney U test: t(28) = 31, p = 0.011).
In the rear space, the thresholds for FF presentation and BR were substantially different. In FF, average thresholds were between 11° and 17°, whereas with BR the thresholds were three to four times higher (between 52° and 59°, all significantly using the Wilcoxon rank-sum test, p < 0.001). The thresholds of sighted subjects in FF were significantly smaller than the thresholds of blindfolded subjects in FF (Wilcoxon rank-sum test: t(40) = 0, p < 0.001). Thresholds for blind subjects in FF were smaller than for sighted subjects (Mann–Whitney U test: t(22) = 0, p = 0.033), and smaller than for blindfolded subjects in FF (Mann–Whitney U test: t(22) = 0, p < 0.001).
In lateral-left space, the average thresholds were between 20° and 41°. Significant differences were found for sighted subjects between FF and BR (Wilcoxon rank-sum test: t(36) = 9, p = 0.001), and in FF between sighted and blindfolded conditions (Wilcoxon rank-sum test: t(38) = 33, p < 0.001). In addition, thresholds for blindfolded subjects were significantly higher for BR than in FF (Wilcoxon rank-sum test: t(33) = 97, p = 0.003).
The bias as the difference from the center point is shown in Figure 4 for different measurement conditions. The median bias values for the FF presentation were comparable to the ones using BR, but there was a bigger variance for the BR, meaning that some persons had strong biases toward reference 1, while others in the same measurement condition had a strong bias toward reference 2. The blind participants with BR showed the biggest variance of the bias. In frontal space, the average bias was for all participants between −2° and 2°, that is, smaller than the separation of two adjacent loudspeakers. For the rear incidence, the bias was also small between −2° and 4°. Similar to the thresholds (Figure 3), there were differences between loudspeaker and headphone presentation. The bias for rear presentation using BR was smaller than in FF which means that the perceived midpoint was shifted more to the right hemisphere. Laterally left, the perceived midpoint was also shifted to the rear, which is shown in Figure 4 by higher bias values in FF than for BR presentation (average bias between −2° and 8°).

Boxplot of spatial bisection bias for frontal, rear, and lateral-left directions. The display is the same as in Figure 3.
Discussion
The present study measured and compared spatial bisection thresholds (a) for FF presentation and BR modes, (b) for frontal, rear, and laterally left regions of space, and (c) for different access to vision, hereby comparing sighted to blindfolded conditions in normally sighted individuals, and to blind individuals.
In frontal space, thresholds were slightly, but still significantly better with FF presentation than with BR based on generic HRIRs, independent of the visual status of the subject. Although interaural time differences (ITDs) and interaural level differences (ILDs) dominate spatial perception here, this difference is probably attributable to access to individual pinna cues (Denk et al., 2019; Stevenson-Hoare et al., 2022). For rear presentation, thresholds measured for BR were substantially higher than for FF presentation, which was unexpected as the literature on minimum audible angle and absolute sound localization tasks only reports slightly poorer performance (Stevenson-Hoare et al., 2022; Wenzel et al., 1993). While non-individual pinna cues were recently reported to not influence localization in the rear horizontal plane (Stevenson-Hoare et al., 2022), commonly reported artifacts of BR with generic HRIRs include front-back confusions or in-head localization (Best et al., 2020; Wenzel et al., 1993). Such artifacts have likely influenced the spatial bisection task more severely than in localization tasks, especially for stimuli close to the median sagittal plane such as the frontal and rear incidence in the present experiment. Especially for these directions, front-back confusions or distortions of externalization have probably led to large difficulties in judging distances. This is also represented by the observation that thresholds with BR and rear incidence are in a range where they are larger than the separation between the reference stimuli (here: 40°), that is, the subjects appeared to have struggled with conducting the task in this condition, independent of their visual status.
Although participants were not specifically advised to keep their heads still during the loudspeaker presentation, the missing effect of small head movements with BR is deemed not to be a crucial factor here due to the brevity of the acoustic stimuli used. A benefit in localization due to head movements can be expected for stimuli >300 ms (Blauert, 1997), which is substantially longer than the 100 ms used in all conditions here. Lateral-left thresholds were again significantly increased for virtual acoustic presentation as compared to FF presentation, albeit not as substantially as for rear presentation. This may be attributed to the fact that the binaural cues ITD and ILD are less selective laterally (Williges et al., 2018) than in front or rear, and therefore ambiguities are more likely. Also, in-head localizations and front-back confusions arguably do not affect the spatial bisection task at lateral incidence as severely as in the rear incidence. In line with this physical interpretation, the perception of sound direction appears to be compressed in directions around the interaural axis (Brimijoin, 2018). Therefore, spatial bisection thresholds may be expected to be at least doubled in lateral space, which is consistent with the present results.
In FF, frontal spatial bisection thresholds were lower than thresholds collected using rear presentation, and thresholds laterally left were even higher. This replicates the findings of Aggius-Vella et al. (2018) in sighted and Aggius-Vella et al. (2020) in blindfolded subjects. Arguably, in rear and lateral-left space fewer actions in the focus of attention take place in everyday life, and therefore acoustic localization is less trained, for example, through visual calibration.
For BR, frontal bisection thresholds again were lowest, however, then followed by thresholds in lateral-left space and thresholds in rear space were highest (poorest). This overall difference highlights that especially for rear presentation, non-individual interaural spatial cues as present with BR were not sufficient for good spatial bisection. In turn, this means that the access to individual pinna and torso cues as present in FF presentation is highly important for good spatial bisection.
Blindfolding was found to not influence thresholds in frontal space, but it increased (i.e., worsens) thresholds in lateral-left space for FF presentation. Tabry et al. (2013) reported that the absolute localization error was reduced for sighted in comparison to blindfolded individuals, highlighting that access to both visual and proprioceptive cues helps with sound localization. Similarly, it may also help here for spatial bisection. However, the blind persons showed equally good thresholds laterally left in FF as their sighted peers, challenging this notion. While it is accepted that blind people can calibrate their localization ability tactilely (Zwiers et al., 2001a), hereby replacing at least part of the visual calibration present in sighted individuals, it is not likely that such calibration is equally effective for blind persons in lateral space, where little everyday action of interest takes place. Furthermore, blind individuals show relatively low and inter-individually similar bisection thresholds for rear presentation. This indicates that calibration feedback does not play a major role, if any, in this condition. This finding contrasts with the current view about the underlying causes of blind individuals' performance in tasks requiring the allocentric frame (see Voss, 2016). It seems plausible that calibrating distance, as needed for the spatial bisection task, may be more dependent upon visual calibration, because the targets will be out of reach, but that angular discrimination, as used in tasks involving the egocentric perspective, could be better calibrated through proprioception for nearby targets.
Comparisons between sighted and blind persons in the present study should be, however, taken with caution, not only because of the different number of participants in each group. The blind participants were not age-matched to the comparable group of sighted participants, that is, blind persons were on average older. Since age is known to affect localization performance (Dobreva et al., 2011), thresholds of blind persons might be underestimating the performance of an age-matched younger group. All participants had normal or close to normal hearing, although some blind subjects showed slightly higher (but still better or equal than 30 dB HL) hearing thresholds than sighted subjects, probably due to their age. This fact, however, should not influence the azimuthal localization ability because mild age-related hearing loss does not influence horizontal sound localization (Otte et al., 2013).
Comparing the FF presentation and BR, both sighted and blindfolded persons showed significantly better performance when they had access to individual spatial cues in the FF presentation. Blind persons showed no differences between FF presentation and BR in frontal and lateral-left space and tended to show a large reduction of performance with BR in the rear space similar to normally sighted participants. Altogether, the data suggest that providing only generic HRIR cues does not affect the auditory spatial bisection performance of blind individuals more severely than normal-sighted ones.
The results of the present study show that the spatial bisection task was feasible for all subjects irrespective of their access to vision. There was no serious inability found, as Gori et al. (2014) found for congenitally blind adults, even in those participants here who were blind from birth. According to the definition of blindness, some participants in the present study had residual light sensitivity, which may be one explanation for this discrepancy, as participants with residual vision may perform significantly differently from those with full vision loss (e.g., Lessard et al., 1998). Also, the early blind definition (blindness onset at 11 years or younger) adopted from Voss et al. (2004) is less strict than in other studies, for example, 5 years or less in Lewald (2002) and Kolarik et al. (2021). Furthermore, the sample size of blind participants in the present study was relatively small, albeit similar to the number of blind participants in Gori et al. (2014). Vercillo et al. (2015) showed that blind subjects who use echolocation perform as well as sighted individuals in spatial bisection. It is known that two subjects in the present study had experience with echolocation. However, their spatial bisection thresholds did not differ considerably from the other subjects, such that this explanation is less likely. In comparison to the spatial bisection thresholds collected in Aggius-Vella et al. (2020), the thresholds of blindfolded persons in the present study were increased as compared to a normal-sighted condition. One reason for this may be the different FF setups used. The current setup was adjusted such that the FF presentation and BR were as comparable as possible. This means that the spatial separation of the loudspeakers and their distance to the subject (3 m) was chosen to match that of the HRIR database of Wierstorf et al. (2011). Moreover, the setup was placed in an anechoic chamber, whereas Aggius-Vella et al. (2020) used an acoustically unoptimized room. Other possible reasons for the increased thresholds in the current study in comparison to Aggius-Vella et al. (2020) were the adjustment of the adaptive QUEST algorithm, whose exact parameter values were not known from Aggius-Vella et al. (2020), and the calculation of thresholds from the recorded data, pooling left–right and right–left collected subject ratings.
Future studies may investigate the influence of the sound source's distance on the auditory spatial bisection task. The listener's position in near- or far-field of the sound sources may influence the localization and might lead to the differences in localization accuracy between the present study, Aggius-Vella et al. (2020) and Gori et al. (2014). Besides, it would be interesting if the localization ability differs between laterally left and right space. Voss et al. (2004) for instance found a specialization in the analysis of space in the right hemisphere while using the minimum audible angle task.
Conclusions
This study investigated auditory spatial bisection performance in frontal, rear, and lateral-left space, and compared FF presentation with BR over headphones based on generic HRIRs. The following conclusions can be drawn:
Significantly lower (better) thresholds were found in frontal space in comparison to rear and left space. BR strongly compromised performance in the rear space compared to FF presentation, but hardly affected spatial bisection thresholds in frontal or left space. Blindness (with only residual light sensitivity) showed no significant influences on spatial bisection performance in comparison to sighted individuals. Acute absence of vision by blindfolding normal-sighted subjects reduced bisection performance in FF overall slightly, but significantly especially in lateral-left space.
Footnotes
Acknowledgements
The authors would like to thank all listeners for participating in the experiments of this study. Thanks to the Blinden- und Sehbehindertenverein Hamburg e.V. and the SV-Sportsgeist e.V. for forwarding the request to possible subjects. Special thanks to Ulrich Graubner for technical support with the loudspeaker setup.
Data and Code Availability
Data will be made available upon request.
Declaration of Conflicting Interests
The authors declared no potential conflicts of interest with respect to the research, authorship, and/or publication of this article.
Funding
The authors disclosed receipt of the following financial support for the research, authorship, and/or publication of this article: The authors acknowledge financial support by Land Schleswig-Holstein within the funding programme Open Access Publikationsfonds.
Appendix. Parameters of the QUEST algorithm

| Variable | Unit | Description | Used value |
|---|---|---|---|
| tGuess | ° | Prior threshold estimate | 20° (front) |
| 110° (rear) | |||
| 200° (lateral left) | |||
| tGuessSd | ° | Guessed standard deviation | 50 |
| pThreshold | % | Threshold criterion: Probability of correct response | 0.5 |
| Beta | %/° | Slope of psychometric function | 0.1 |
| Delta | Fraction of trials the subject presses blindly | 0 | |
| gamma | ° | Fraction of trials that will generate response 1 when intensity = 1 | 0 |
| grain | ° | Quantization/step size | 4 |
| range | Largest and smallest possible thresholds | [] | |
| plotIt | Automatic plots (when plotIt = 1) | [] |
q = QuestCreate (tGuess, tGuessSd, pThreshold, β, δ, γ, grain, range, plotIt),
= QuestCreate (tGuess, 50, 0.5, 0.1, 0, 0, 4, [], [])