
Abstract
Subjective reports indicate that hearing aids can disrupt sound externalization and/or reduce the perceived distance of sounds. Here we conducted an experiment to explore this phenomenon and to quantify how frequently it occurs for different hearing-aid styles. Of particular interest were the effects of microphone position (behind the ear vs. in the ear) and dome type (closed vs. open). Participants were young adults with normal hearing or with bilateral hearing loss, who were fitted with hearing aids that allowed variations in the microphone position and the dome type. They were seated in a large sound-treated booth and presented with monosyllabic words from loudspeakers at a distance of 1.5 m. Their task was to rate the perceived externalization of each word using a rating scale that ranged from 10 (at the loudspeaker in front) to 0 (in the head) to −10 (behind the listener). On average, compared to unaided listening, hearing aids tended to reduce perceived distance and lead to more in-the-head responses. This was especially true for closed domes in combination with behind-the-ear microphones. The behavioral data along with acoustical recordings made in the ear canals of a manikin suggest that increased low-frequency ear-canal levels (with closed domes) and ambiguous spatial cues (with behind-the-ear microphones) may both contribute to breakdowns of externalization.
Introduction
Sound sources in the world around us are typically associated with well-externalized sound images, that is, they are perceived outside of the head (see reviews in Best et al., 2020; Durlach et al., 1992). This can be contrasted with headphone listening, in which sound images are typically internalized or perceived to be located somewhere between the ears. Sound externalization is a relatively poorly understood aspect of spatial perception, which is important for making sense of auditory environments and for one's overall sense of “connectedness” to those environments. A majority of the literature on sound externalization comes from the fields of virtual and augmented reality, which deal with the creation of spatially compelling and well-externalized sound images with headphone presentation. It is by now well established that virtual sounds can be indistinguishable from real sounds as long as the natural physical characteristics of an external sound source are recreated adequately at the left and right ear canals (Hartmann & Wittenberg, 1996; Kulkarni & Colburn, 1998; see also Weisser et al., 2019).
Listening with hearing aids is another situation in which the natural sound path to the ear canals is disrupted. In a typical hearing-aid user, the sound arriving at the ear canals is a mix of naturally arriving sound and amplified sound that has been captured by the hearing-aid microphones and delivered via the hearing-aid receivers. It is easy to appreciate how this complex setup might impact sound externalization, but surprisingly little is known about this issue. The limited available data suggest that hearing aids do have a disruptive effect. For example, one question in the Speech, Spatial, and Qualities of Hearing Scale (SSQ; Gatehouse & Noble, 2004) asks “Do the sounds of things you are able to hear seem to be inside your head rather than out there in the world?” Average ratings for this question indicate that hearing aids disrupt externalization and that the problem is worse for bilateral versus unilateral fittings (Noble & Gatehouse, 2006). These broad findings were later supported by a more targeted survey (the Perception of Internalization Questionnaire; Boyd, 2014) that was designed and administered to a large number of hearing-aid users. In a recent study (Cubick et al., 2018), normal hearing listeners were fitted with hearing aids and presented with speech and competing sounds from several loudspeakers. In addition to reporting back the target speech, they were also asked to sketch the sound images for each of the presented sounds. Their responses indicated that aided listening (compared to unaided) gave rise to broader sound images that were often close to or inside the head.
The aim of the current study was to provide some quantitative behavioral data on how hearing aids affect sound externalization. One objective was to determine if it was possible to measure the detrimental effects of hearing aids on externalization in a laboratory setting. If so, another objective was to estimate the scope of the problem for current hearing aids, asking how often it occurs and whether it occurs for everyone. We also wanted to gain some initial insights into the underlying causes of the problem by testing with different hearing-aid styles. In particular, we wished to investigate the potential contribution of occlusion and microphone position. Hearing-aid earmolds can be more or less occluding (Cubick et al., 2022), and this has well-known effects on the perception of one's own voice (Denk et al., 2023; Dillon, 2012; Winkler et al., 2016). It has been speculated previously that occluding earmolds may also disrupt the perception of external sounds (Byrne et al., 1998; Byrne & Noble, 1998) but this idea has never been formally investigated. Microphone position has also been implicated in poor externalization with hearing aids (Boyd et al., 2012; Cubick et al., 2018). In particular, behind-the-ear (BTE) microphones do not capture the direction-dependent filtering imposed by the pinna, which is thought to be important for vertical localization, front-back disambiguation, and externalization. Hearing aids that capture the sound from a more natural in-the-ear (ITE) location improve sound localization (Best et al., 2010; Denk et al., 2019) but have not been studied in the context of sound externalization.
Our motivation for studying how hearing aids affect externalization, and spatial perception more broadly, is the fact that a “natural listening experience” may be one of a complex set of factors that determine satisfaction with hearing aids (Byrne & Noble, 1998). We hope that what we learn about current hearing aids may influence the design of next-generation hearing aids and other ear-worn devices.
Methods
Participants
Ten adults with normal hearing (NH; mean age: 25.2 years) and 10 adults with hearing impairment (HI; mean age: 25.5 years) participated in the study. NH listeners had audiometric thresholds of 20 dB HL or better in both ears at octave frequencies from 250 to 8000 Hz. Listeners with HI had been diagnosed with hearing loss (all but one listener had sensorineural hearing loss), which was confirmed with audiometric threshold testing during their visit to the lab. These audiometric thresholds, averaged across right and left ears, are shown in Figure 1. Table 1 includes additional information about each HI listener. The decision to focus on younger adults with HI, rather than older adults with HI, allowed us to study the effects of hearing loss (and hearing devices) without the confounding effects of age that often complicate such investigations. Overall, 7 of the 10 HI listeners were hearing-aid users but only 6 had their devices on hand at the time of testing. All listeners provided informed consent and were compensated for their time. All procedures were approved by the Boston University Institutional Review Board.
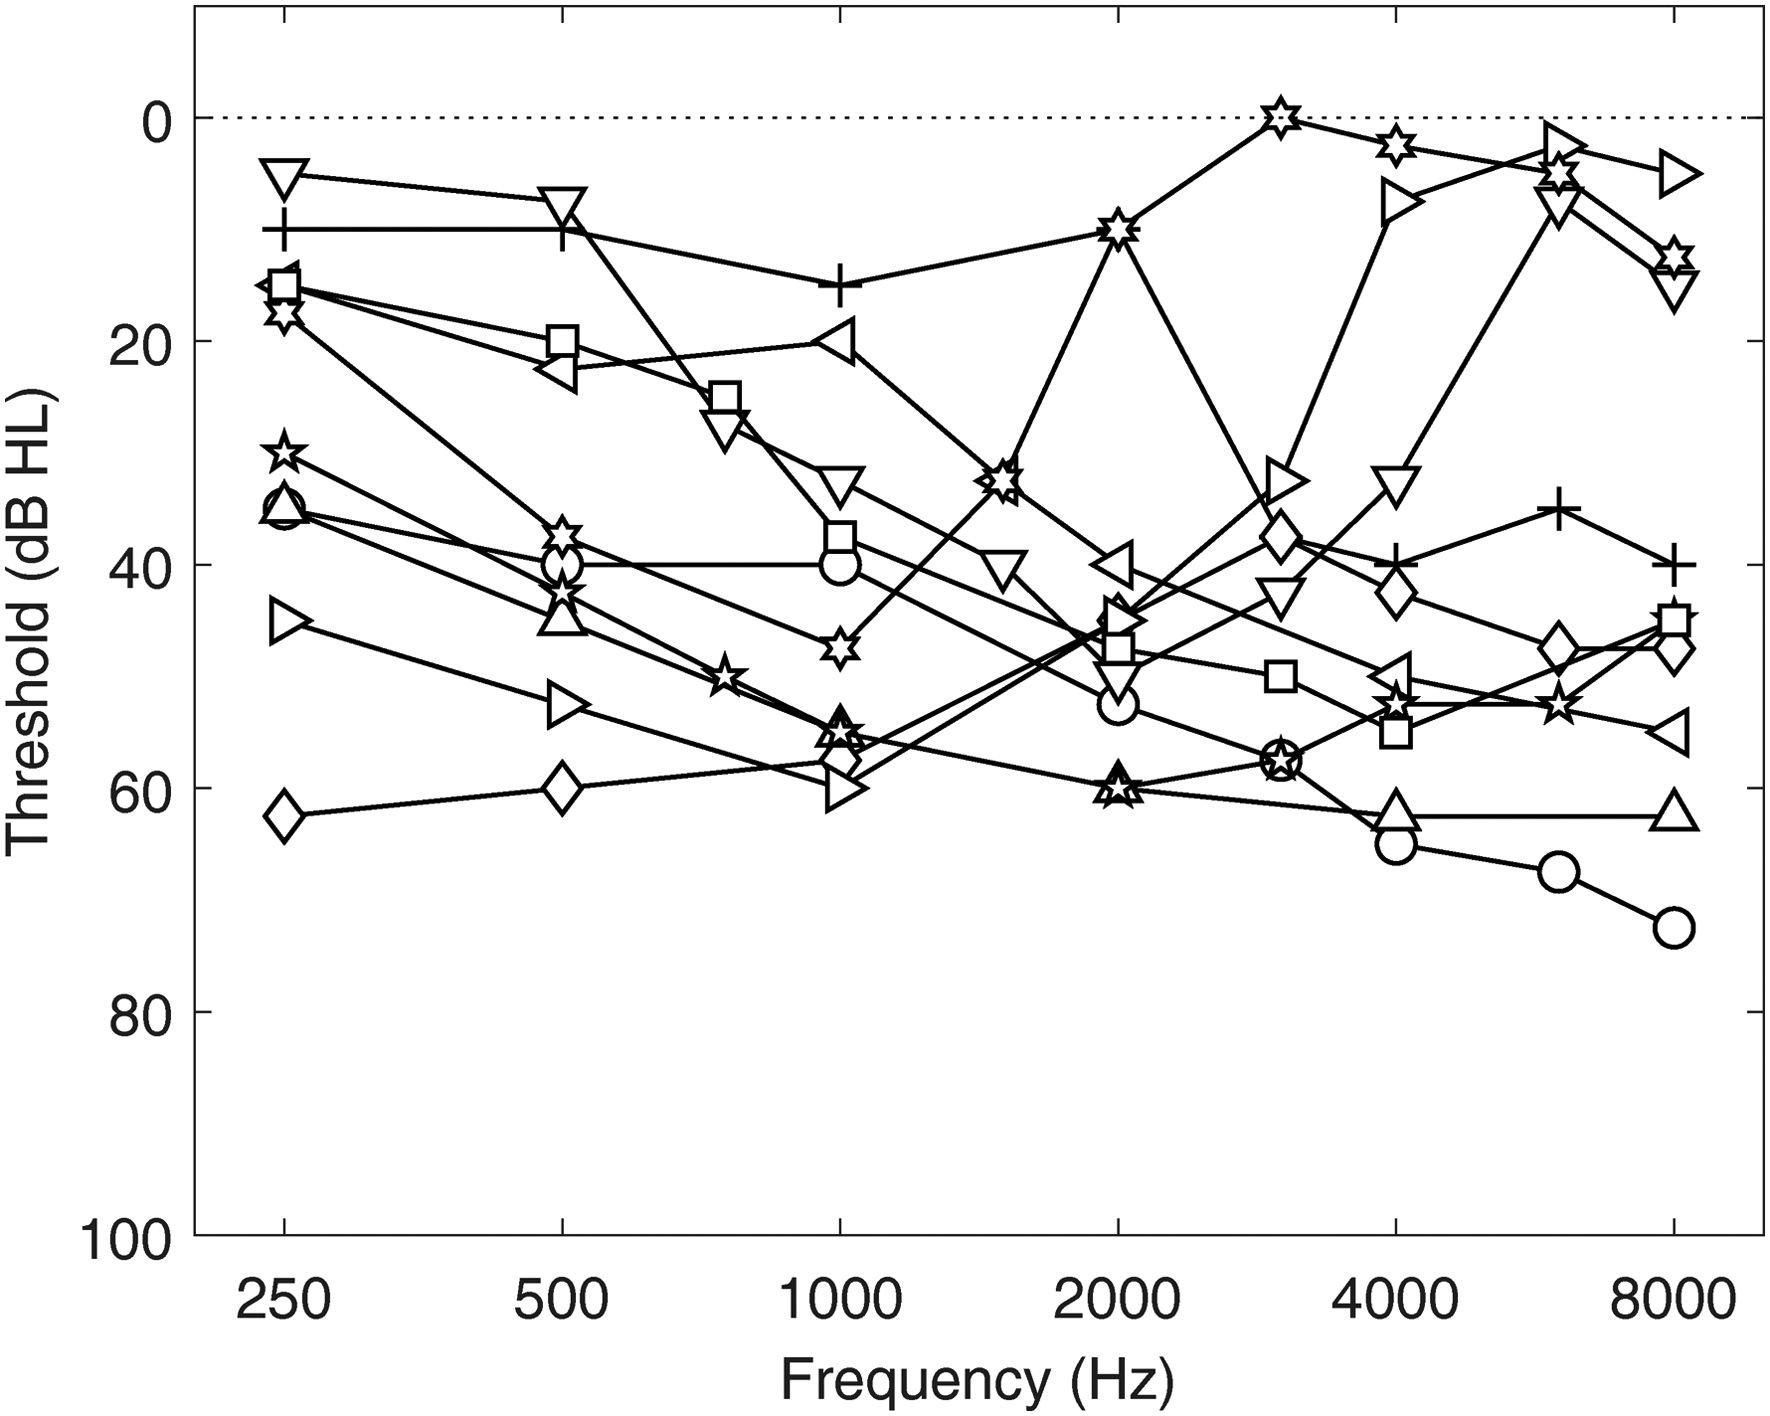
Across-ear average audiograms for each of the 10 participants in the HI group. Symbols correspond to those in Table 1.
Information About Each Participant in the HI Group, Including Age, Hearing Loss (HL) Type, Style and Coupling Type of Hearing Aid (HA), Duration of HA Use, and Scores From the Speech, Spatial, and Qualities (SSQ) Questionnaire.

Note. SSQ question 14 (Q14) asks “Do the sounds of things you are able to hear seem to be inside your head rather than out there in the world?” An answer of 0 indicates inside the head and an answer of 10 indicates out there. The final two columns of the table show the average ratings from all 17 questions from the spatial subsection of the SSQ, with smaller numbers indicating greater handicaps.
Hearing Aids and Fitting Procedures
The experimental hearing aids were three separate pairs of GN ReSound One receiver-in-the-canal devices with Microphone and Receiver In-The-Ear (M&RIE) technology (Device ID/firmware version: RS.D2.Top.CbRIE45DW/9.60.1.1). This hearing aid houses two microphones on the body of the hearing aid and a microphone on the outward-facing component of the receiver worn in the ear. We chose this device type for the ability to switch between the BTE microphones and the ITE microphone, which provided a convenient way to study the effect of microphone position within the same device. The hearing aids were used with GN ReSound silicone instant ear tips of two kinds: strongly occluding power domes and open-fit domes (referred to hereafter as “Closed” and “Open,” respectively).
For NH listeners, the three hearing-aid pairs were programmed using ReSound SmartFit software to have 10 dB linear (compression ratio = 1) gain across frequencies (250–8000 Hz). Only mild feedback cancellation was turned on, and all noise reduction and other special features were turned off. Two sets of hearing aids were used for the BTE conditions, and one set for the ITE conditions. For the BTE devices, the microphone selection in the program was “omnidirectional” and used only the front microphone on each device. For the ITE device, the microphone selection was “M&RIE.” One pair of BTE devices was fitted with power domes (BTE Closed) and the feedback manager calibration was run for each participant. The other pair was fitted with open domes (BTE Open) and the feedback manager calibration was run for each participant. The pair of ITE devices were fitted with open domes (ITE Open) and the feedback manager calibration was run for each participant. As we did not have a fourth pair of devices, we could not separately run the feedback calibration for the ITE with power domes (ITE Closed). Thus, for this condition, the ITE devices that had been calibrated with the open domes were simply fitted with power domes. Given that the ITE Open condition was more susceptible to feedback, our assumption was that the feedback manager would be more aggressive with the open dome and that using a power dome would simply make feedback less likely to occur.
For HI listeners, the three hearing-aid pairs were programmed using the Audiogram + prescriptive gain formula in the ReSound SmartFit software according to each listener's audiometric thresholds. Thus, the prescribed gain was compressive (not linear as it was for the NH listeners). Only mild feedback cancellation was turned on, and all noise reduction and other special features were turned off. HI listeners did not complete the ITE Open condition because an open dome fitted with the ITE microphone was not recommended by the manufacturer for greater than mild hearing losses given the high likelihood of feedback. For the other three conditions (BTE Closed, BTE Open, and ITE Closed), the feedback manager was run separately for each, and software microphone selections were made as with the NH listeners.
It is important to note one limitation of our design concerning the ITE conditions. For these commercial devices, when using the “M&RIE” setting in the software, there can be a mixing of ITE and BTE microphone inputs depending on the feedback manager calibration run for each individual ear and the fitted gain. The feedback manager calibration estimates the maximum stable gain across the frequency range of the hearing aid. Typically, the maximum stable gain will be lowest near 3 kHz, which corresponds to the average adult ear-canal resonance and is also the frequency where there usually is a peak in the receiver response for the receiver-in-the-canal style. In cases where the fitted gain is close to or greater than the estimated maximum stable gain, the ITE microphone will be attenuated and the response from the two BTE microphones (with pinna compensation) will be mixed in such that the output level from the three microphones combined remains constant. The bandwidth and degree of mixing are calculated according to a proprietary formula, but generally speaking, the amount of mixing from the BTE microphones increases as the fitted gains near and exceed the estimated maximum stable gain. We estimate that microphone mixing would have been minimal for the NH participants given their relatively low gains, and was fairly unlikely to affect the HI participants since they were only tested with closed domes for the ITE condition.
Experimental Room and Equipment
The experiments took place in a single-walled sound booth (Industrial Acoustics Company) with interior dimensions of 3.8 × 4.0 × 2.3 m (length × width × height), with perforated metal walls and ceiling as is standard for these booths, and a carpeted floor. The reverberation characteristics of this space are described in detail elsewhere (the “BARE” room condition in Kidd et al. (2005)). Stimuli were presented via seven loudspeakers (Acoustic Research 215PS) located on a horizontal arc of radius 1.5 m. The loudspeakers were driven by a Lenovo PC, a multichannel soundcard (MOTU 16A), and a bank of power amplifiers (Crown Audio XTi 1002) that were all located outside of the booth. The room was dimly lit such that the loudspeakers were clearly visible. Participants were seated on a chair in the center of the loudspeaker arc and were asked to keep their heads still, but no specific measures were taken to stabilize the head, and the head position was not monitored or recorded. Responses were provided via a handheld backlit keypad. Stimulus generation, stimulus presentation, and data acquisition made use of MATLAB software (MathWorks). Statistical analyses were done in R Statistical Software (v4.2.2; R Core Team, 2022).
Stimuli and Procedures
The stimuli were monosyllabic words spoken by 11 male and 11 female talkers, taken from a matrix-style corpus recorded at Boston University (Kidd et al., 2008). In this experiment, eight choices of words from the Name, Verb, Adjective, and Noun categories were used (the Number category was eliminated so as not to interfere with participants’ numeric judgments). On each trial, a random word (from the 32 unique words) spoken by a random talker (from the set of 22) was selected for presentation.
The words were presented from loudspeakers at azimuths of −90°, −30°, −15°, 0°, 15°, 30°, and 90°. In the “frontal” configuration, listeners were seated facing the 0° loudspeaker. In a frontal block, a word was presented from each of the seven loudspeakers at three presentation levels (see below) twice in random order (42 total trials). One block per hearing-aid condition was completed, in random order, before a second block per hearing-aid condition was completed in a new random order. After the completion of the frontal blocks, the experiment was repeated in a “front-back” configuration. For this configuration, the chair was repositioned to face the loudspeaker at −90°, and stimuli were only presented from the loudspeakers at −90° and +90° (now 0° and 180°). In a front-back block, a word was presented from each of the two loudspeakers at three presentation levels (see below) eight times in random order (48 total trials). One block per hearing-aid condition was completed, in random order, before a second block per hearing-aid condition was completed in a new random order. We note that the different hearing-aid conditions were of primary interest in this study. The variations in azimuth and level introduced within each block were simply to provide some variation in the stimuli on top of that provided by using random word tokens. Without sufficient variation in the stimuli, it is our experience that externalization ratings are subject to adaptation effects and can become unstable.
Before commencing each set of blocks, listeners were provided with schematic and written instructions describing the stimulus configuration and the range of possible responses (see Figure 2). On each trial, listeners were required to make a judgment about the perceived externalization of the presented word. They did so using a subjective rating scale where a rating of 10 corresponded to “at the loudspeaker,” a rating of 0 corresponded to “in the head,” and a rating of 1 corresponded to “at the head” or “at the ear.” Negative values (from −1 to −10) were used to indicate sound images that were behind the listener.

Schematics provided to participants indicating the rating scales to use in the frontal configuration (A) and the front-back configuration (B).
NH listeners were tested under five experimental conditions: Unaided, BTE Closed, BTE Open, ITE Closed, and ITE Open. HI listeners were tested under six experimental conditions: Unaided, BTE Closed, BTE Open, ITE Closed, Source Gain, and Own Aids (where applicable). In the Source Gain condition, listeners were tested without hearing aids, but the linear gain was applied to the stimulus before presentation according to the NAL-RP formula (Dillon, 2012). The gain was calculated using the average audiometric thresholds across the two ears. A subset of the HI group (6 of 10) completed an Own Aids condition, in which they wore their own devices set to their most common or everyday program. For all blocks that required hearing aids, the hearing aids were placed in the participant's ears by one of the experimenters (a clinically trained audiologist). The allocation of this task to a single person increased the likelihood of a consistent fit across participants and blocks.
The three presentation levels were 50, 55, and 60 dB SPL for all listeners in all conditions, with a few exceptions. Stimuli in the Source Gain condition occasionally clipped at the default presentation levels. This affected listener HI3 (who was instead tested at 35, 40, and 45 dB SPL in the Source Gain condition), and listeners HI4 and HI5 (who were tested at 45, 50, and 55 dB SPL in the Source Gain condition). For listener HI3 in the Unaided condition, some stimuli were inaudible with the default presentation levels, so this listener was tested at 60, 65, and 70 dB SPL in the Unaided condition.
Acoustical Analyses
To estimate the spectrum of signals arriving at the listener's ears during the experiment, recordings were made using the in-built microphones of an acoustic manikin (KEMAR) seated on the chair in the experimental room. The stimulus was a speech-shaped noise (matched in spectrum to the long-term average of the speech materials used in the experiment) that was 1 s long. Recordings were made for each experimental condition using each loudspeaker in each spatial configuration (frontal and front-back) and each of the three presentation levels. One set of recordings was done with the hearing aids programmed as they were in the experiment for the NH listeners. Ten subsequent sets of recordings were done with the hearing aids programmed for each individual HI listener. The Own Aids condition was not included.
Signals were routed through two sets of pre-amplifiers (the Etymotic pre-amplifiers associated with KEMAR, and a Brüel & Kjær NEXUS) and the MOTU soundcard before acquisition and analysis. For each ear of each recording, the average levels in critical bands across the full spectrum were calculated. For analysis of the relationship between behavioral data and acoustic signals, “band levels” were extracted for a range of center frequencies (500, 1000, 2000, 4000, and 8000 Hz).
Results
Raw Data
Figure 3 shows raw externalization ratings aggregated across listeners in the NH group (left column) and the HI group (right column) for the frontal configuration (top row) and the front-back configuration (bottom row). The three columns of points per condition represent the three stimulus levels. These data are shown primarily to give a sense of the large range of responses that were obtained, essentially covering the whole available range. Across all panels, stimulus level had a strong effect on responses: the softer sounds gave rise to higher ratings (i.e., were perceived to be further away) than the louder sounds. In the frontal configuration, negative ratings (corresponding to behind-the-head perceptions) were exceedingly rare for the NH listeners but occurred more often for HI listeners. In the front-back configuration, both positive and negative responses were observed, with evidence of front-back reversals occurring for both groups (gray symbols having positive ratings or black symbols having negative ratings).

Raw externalization ratings aggregated across listeners in the NH group (left column) and the HI group (right column) for the frontal configuration (top row) and the front-back configuration (bottom row). The three columns of points per condition represent the three stimulus levels (from left to right: 50, 55, 60 dB SPL). Black symbols represent responses to stimuli presented from the frontal hemifield; gray symbols represent responses to stimuli presented from the rear hemifield. The size of the symbol is proportional to the number of responses.
Mean Absolute Externalization Ratings
Figure 4 shows mean absolute externalization ratings for the NH group (left column) and the HI group (right column) for the frontal configuration (top row) and the front-back configuration (bottom row). These values are collapsed across level, azimuth, and repetition, to focus on the key experimental manipulation of the hearing-aid condition. The symbols show mean ratings for individual subjects (with symbols for HI listeners corresponding to those in Figure 1) and the bars show the across-subject mean.
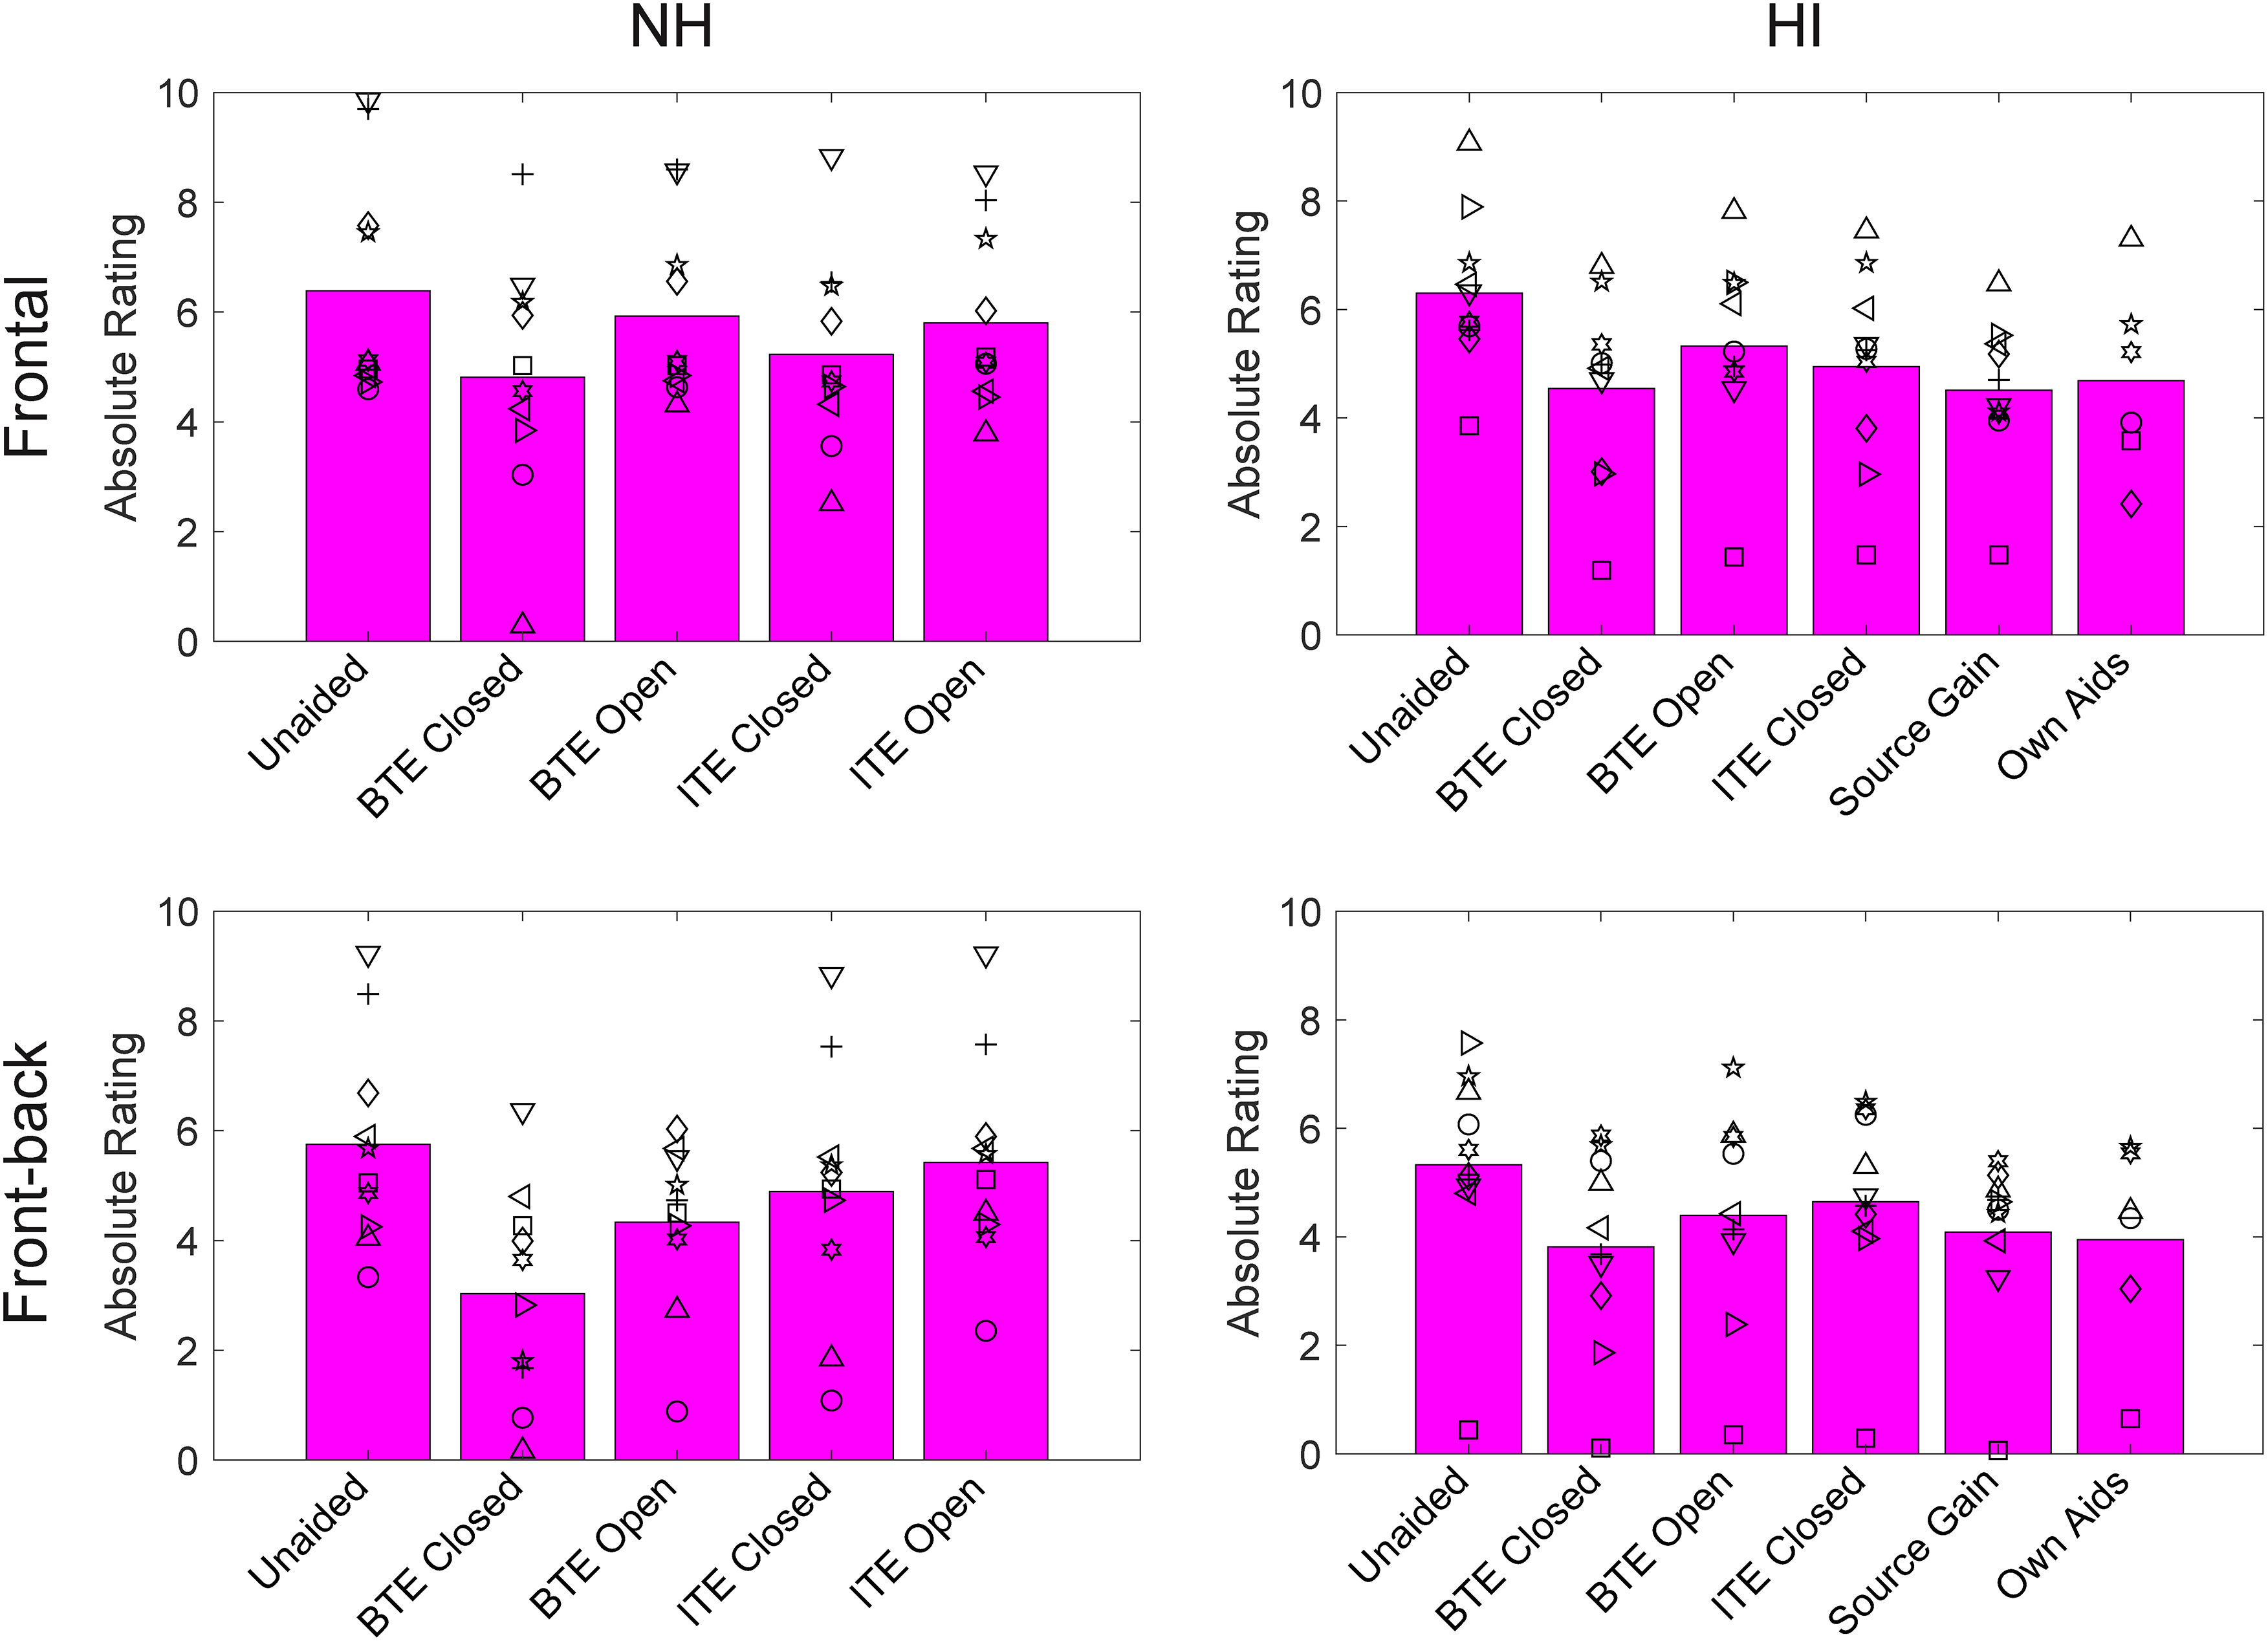
Mean absolute externalization ratings for the NH group (left column) and the HI group (right column) for the frontal configuration (top row) and the front-back configuration (bottom row). The bars show group means and the individual symbols show individual listener means (symbols for HI correspond to Figure 1 and Table 1).
Trial-by-trial data for each group in the frontal and front-back configurations were analyzed with separate linear mixed-effects models using the lmer function in R. In each model, the dependent variable was the absolute externalization rating, and the independent variables were three fixed variables—hearing-aid condition, presentation level, and azimuth—and a random intercept for the subject. Hearing-aid condition and azimuth were coded in the model as categorical variables, and level as an ordinal variable. Sum contrast coding was used such that the intercept reflected the grand mean of the variables. The models included only main effects, and not interactions, as we did not have specific hypotheses regarding the interactions, and in general, their inclusion did not improve the model fits. Significance testing for the fixed effects made use of the anova function in R, and post hoc contrasts were explored using the Tukey method.
The model results for the four sets of data (NH frontal, NH front-back, HI frontal, and HI front-back) are shown in Table 2. In all cases, there were significant effects of hearing-aid condition and level, and for the HI models, there was a significant effect of azimuth. The significant effect of level reflects the fact that higher-level stimuli produced lower ratings on average. The significant effect of azimuth for the HI group for the frontal condition reflects non-systematic variations in the ratings as a function of azimuth, and for the front-back condition reflects the fact that stimuli from the front were rated as slightly closer than stimuli from the rear. As the hearing-aid condition was of primary interest, post hoc contrasts for this factor were examined and are provided in the Supplementary Material (Tables S1–S4). In all cases, the aided conditions produced significantly lower ratings than the Unaided condition. Moreover, the Closed conditions produced significantly lower ratings than the equivalent Open conditions (BTE Closed vs. BTE Open; ITE Closed vs. ITE Open). Finally, in most cases, the BTE condition produced significantly lower ratings than the equivalent ITE condition (BTE Closed vs. ITE Closed; BTE Open vs. ITE Open).
Significance Testing for Effects of Hearing-Aid Condition, Level, and Azimuth on Absolute Externalization Ratings.

Internalized Responses
To assess the frequency with which sounds were truly internalized (i.e., perceived in or at the head rather than in external space), we tallied the trials in which listeners responded with 0 or ±1. Percentages of these responses are depicted in Figure 5 for the NH group (left column) and the HI group (right column) for the frontal configuration (top row) and the front-back configuration (bottom row). As for Figure 4, the values are collapsed across level, azimuth, and repetition. The symbols show mean values for individual subjects (with symbols for HI listeners corresponding to those in Figure 1) and the bars show the across-subject mean.
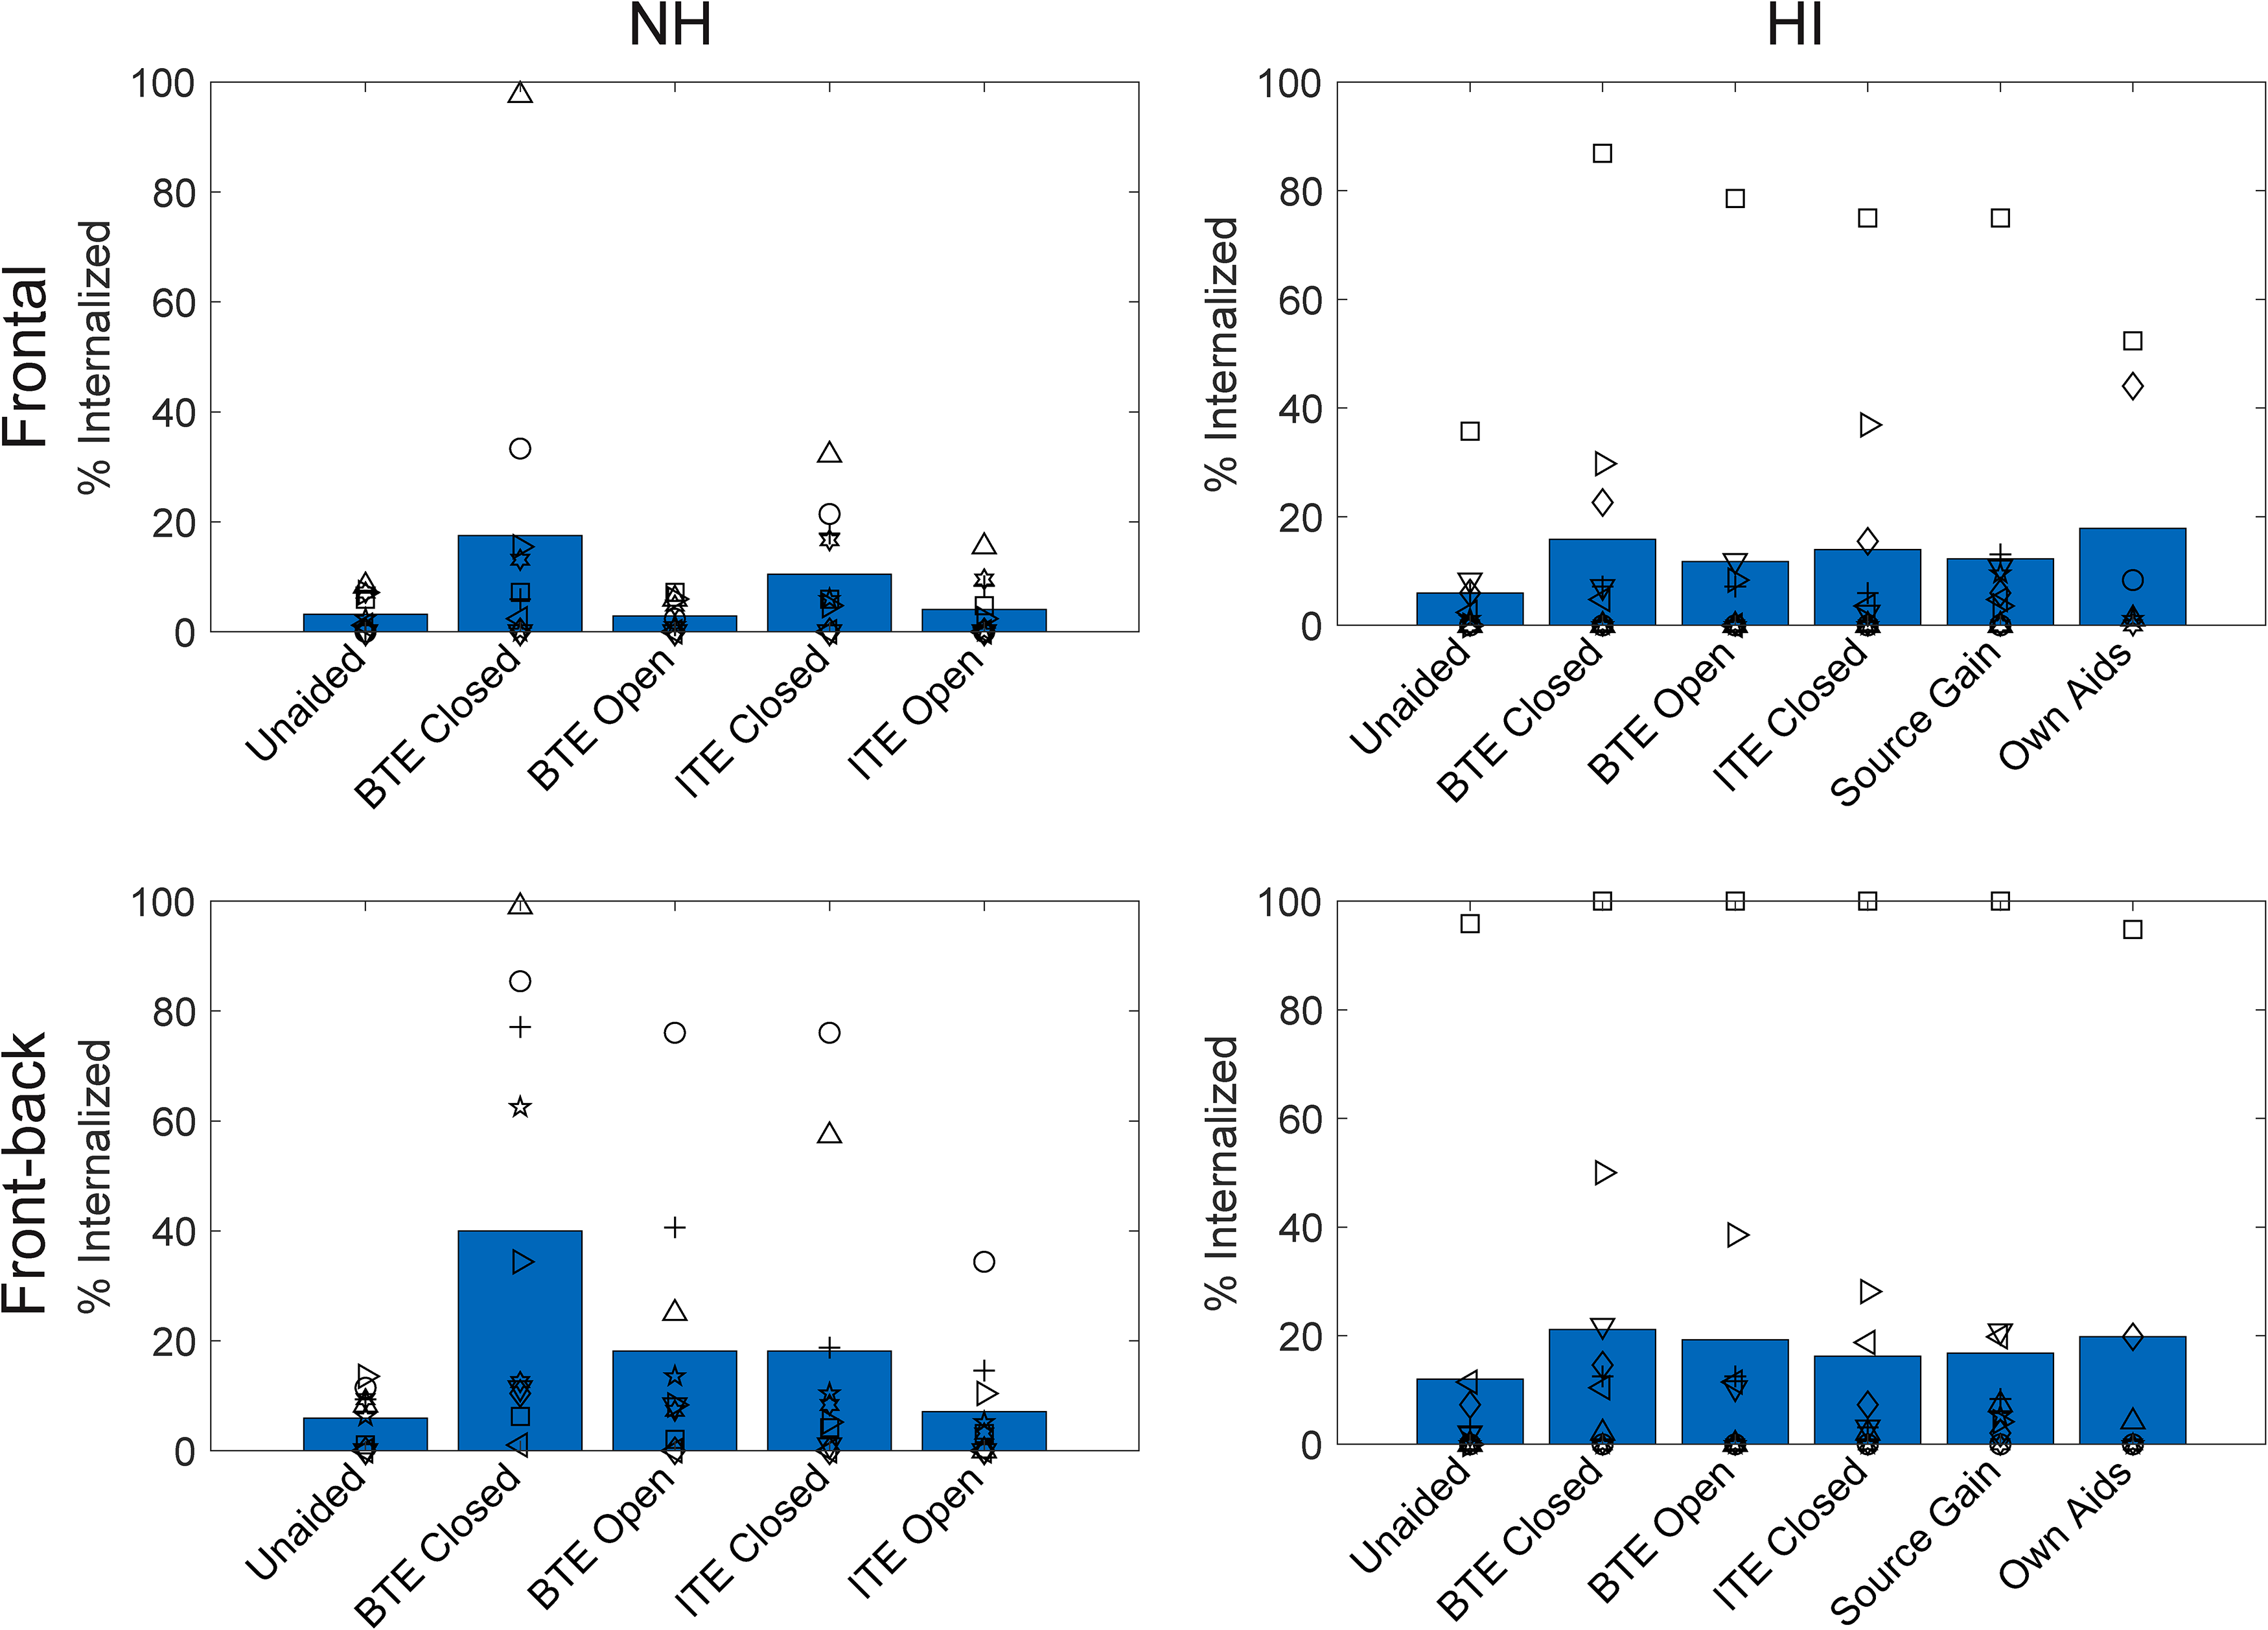
Percentage of internalized responses for the NH group (left column) and the HI group (right column) for the frontal configuration (top row) and the front-back configuration (bottom row). The bars show group means and the individual symbols show individual listener means (symbols for HI correspond to Figure 1 and Table 1).
In the frontal configuration, internalized responses occurred on 3/6% of trials (NH/HI) in the Unaided condition and on 9/14% of trials on average when listening through hearing aids. In the front-back configuration, these values were higher, at 6/12% in the Unaided condition and 21/19% on average with hearing aids. These broad proportions agree well with existing survey data (Boyd, 2014; Noble & Gatehouse, 2006). There were, however, substantial individual differences, with some listeners rarely reporting internalization, and others reporting it on most trials.
Trial-by-trial data were coded as 1 (internalized) or 0 (not internalized) and analyzed with generalized linear mixed models using the glmer function in R. Models were run separately for NH and HI and frontal and front-back configurations. The models were structured per the absolute externalization rating models described above, except the independent variable was the binary indicator of internalization. Significance testing for the fixed effects made use of the Anova function in the R package car.
The model results for the four sets of data (NH frontal, NH front-back, HI frontal, and HI front-back) are shown in Table 3. In all cases, there were significant effects of hearing-aid condition and level, and for the HI models, there was a significant effect of azimuth. The significant effect of level reflects the fact that higher-level stimuli were more likely to be internalized. The significant effect of azimuth for the HI group for the frontal condition reflects non-systematic variations in internalized responses as a function of azimuth and for the front-back condition reflects the fact that stimuli from the front were slightly more likely to be internalized than stimuli from the rear. Post hoc contrasts for hearing-aid conditions are provided in the Supplementary Material (Tables S5–S8). In the NH models (both frontal and front-back), internalized responses were significantly more likely for the Closed conditions than the Unaided condition and the corresponding Open conditions. Internalized responses were also more likely in the BTE conditions when compared to the corresponding ITE conditions. In the HI models, internalized responses were significantly more likely for all hearing-aid conditions compared to the Unaided condition, but the hearing-aid conditions generally did not differ from one another. The only exceptions were in the HI front-back model where internalized responses were more likely for BTE Closed than for the ITE Closed or Source Gain conditions.
Significance Testing for Effects of Hearing-Aid Condition, Level, and Azimuth on the Percentage of Internalized Responses.

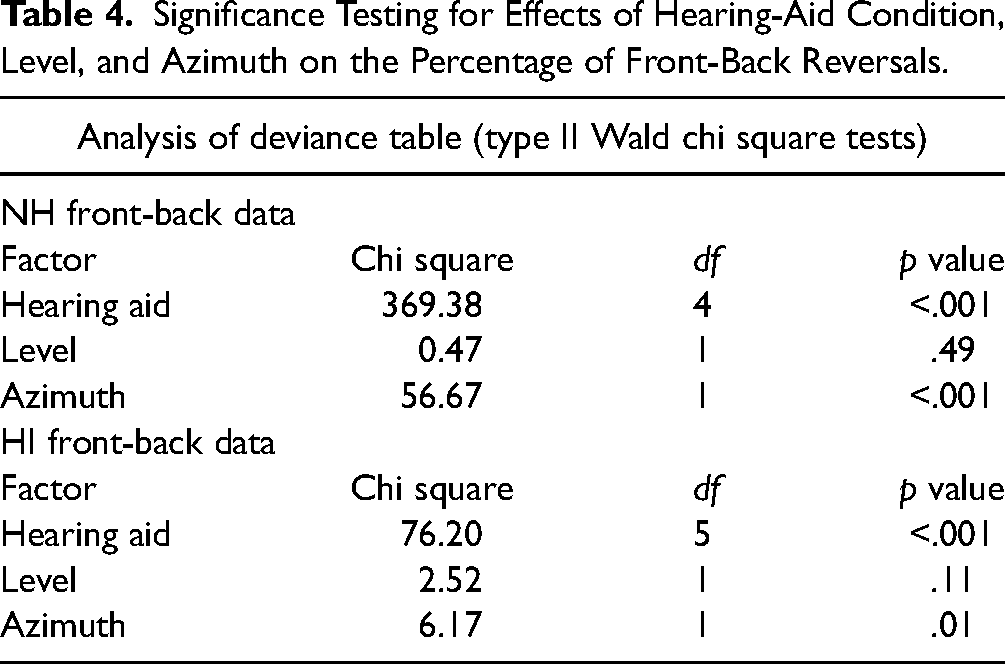
Significance Testing for Effects of Hearing-Aid Condition, Level, and Azimuth on the Percentage of Front-Back Reversals.
Front-Back Reversals
Figure 6 shows the percentage of trials in which the listener perceived the sound source to be in the incorrect hemifield (i.e., they made a front-back reversal). Note that before calculating these percentages, we excluded all trials in which the response was 0. Front-back reversal rates are shown for the NH group (left column) and the HI group (right column) for the frontal configuration (top row) and the front-back configuration (bottom row). As with Figures 4 and 5, the values are collapsed across level, azimuth, and repetition. The symbols show mean values for individual subjects (with symbols for HI listeners corresponding to those in Figure 1 and Table 1) and the bars show the across-subject mean.
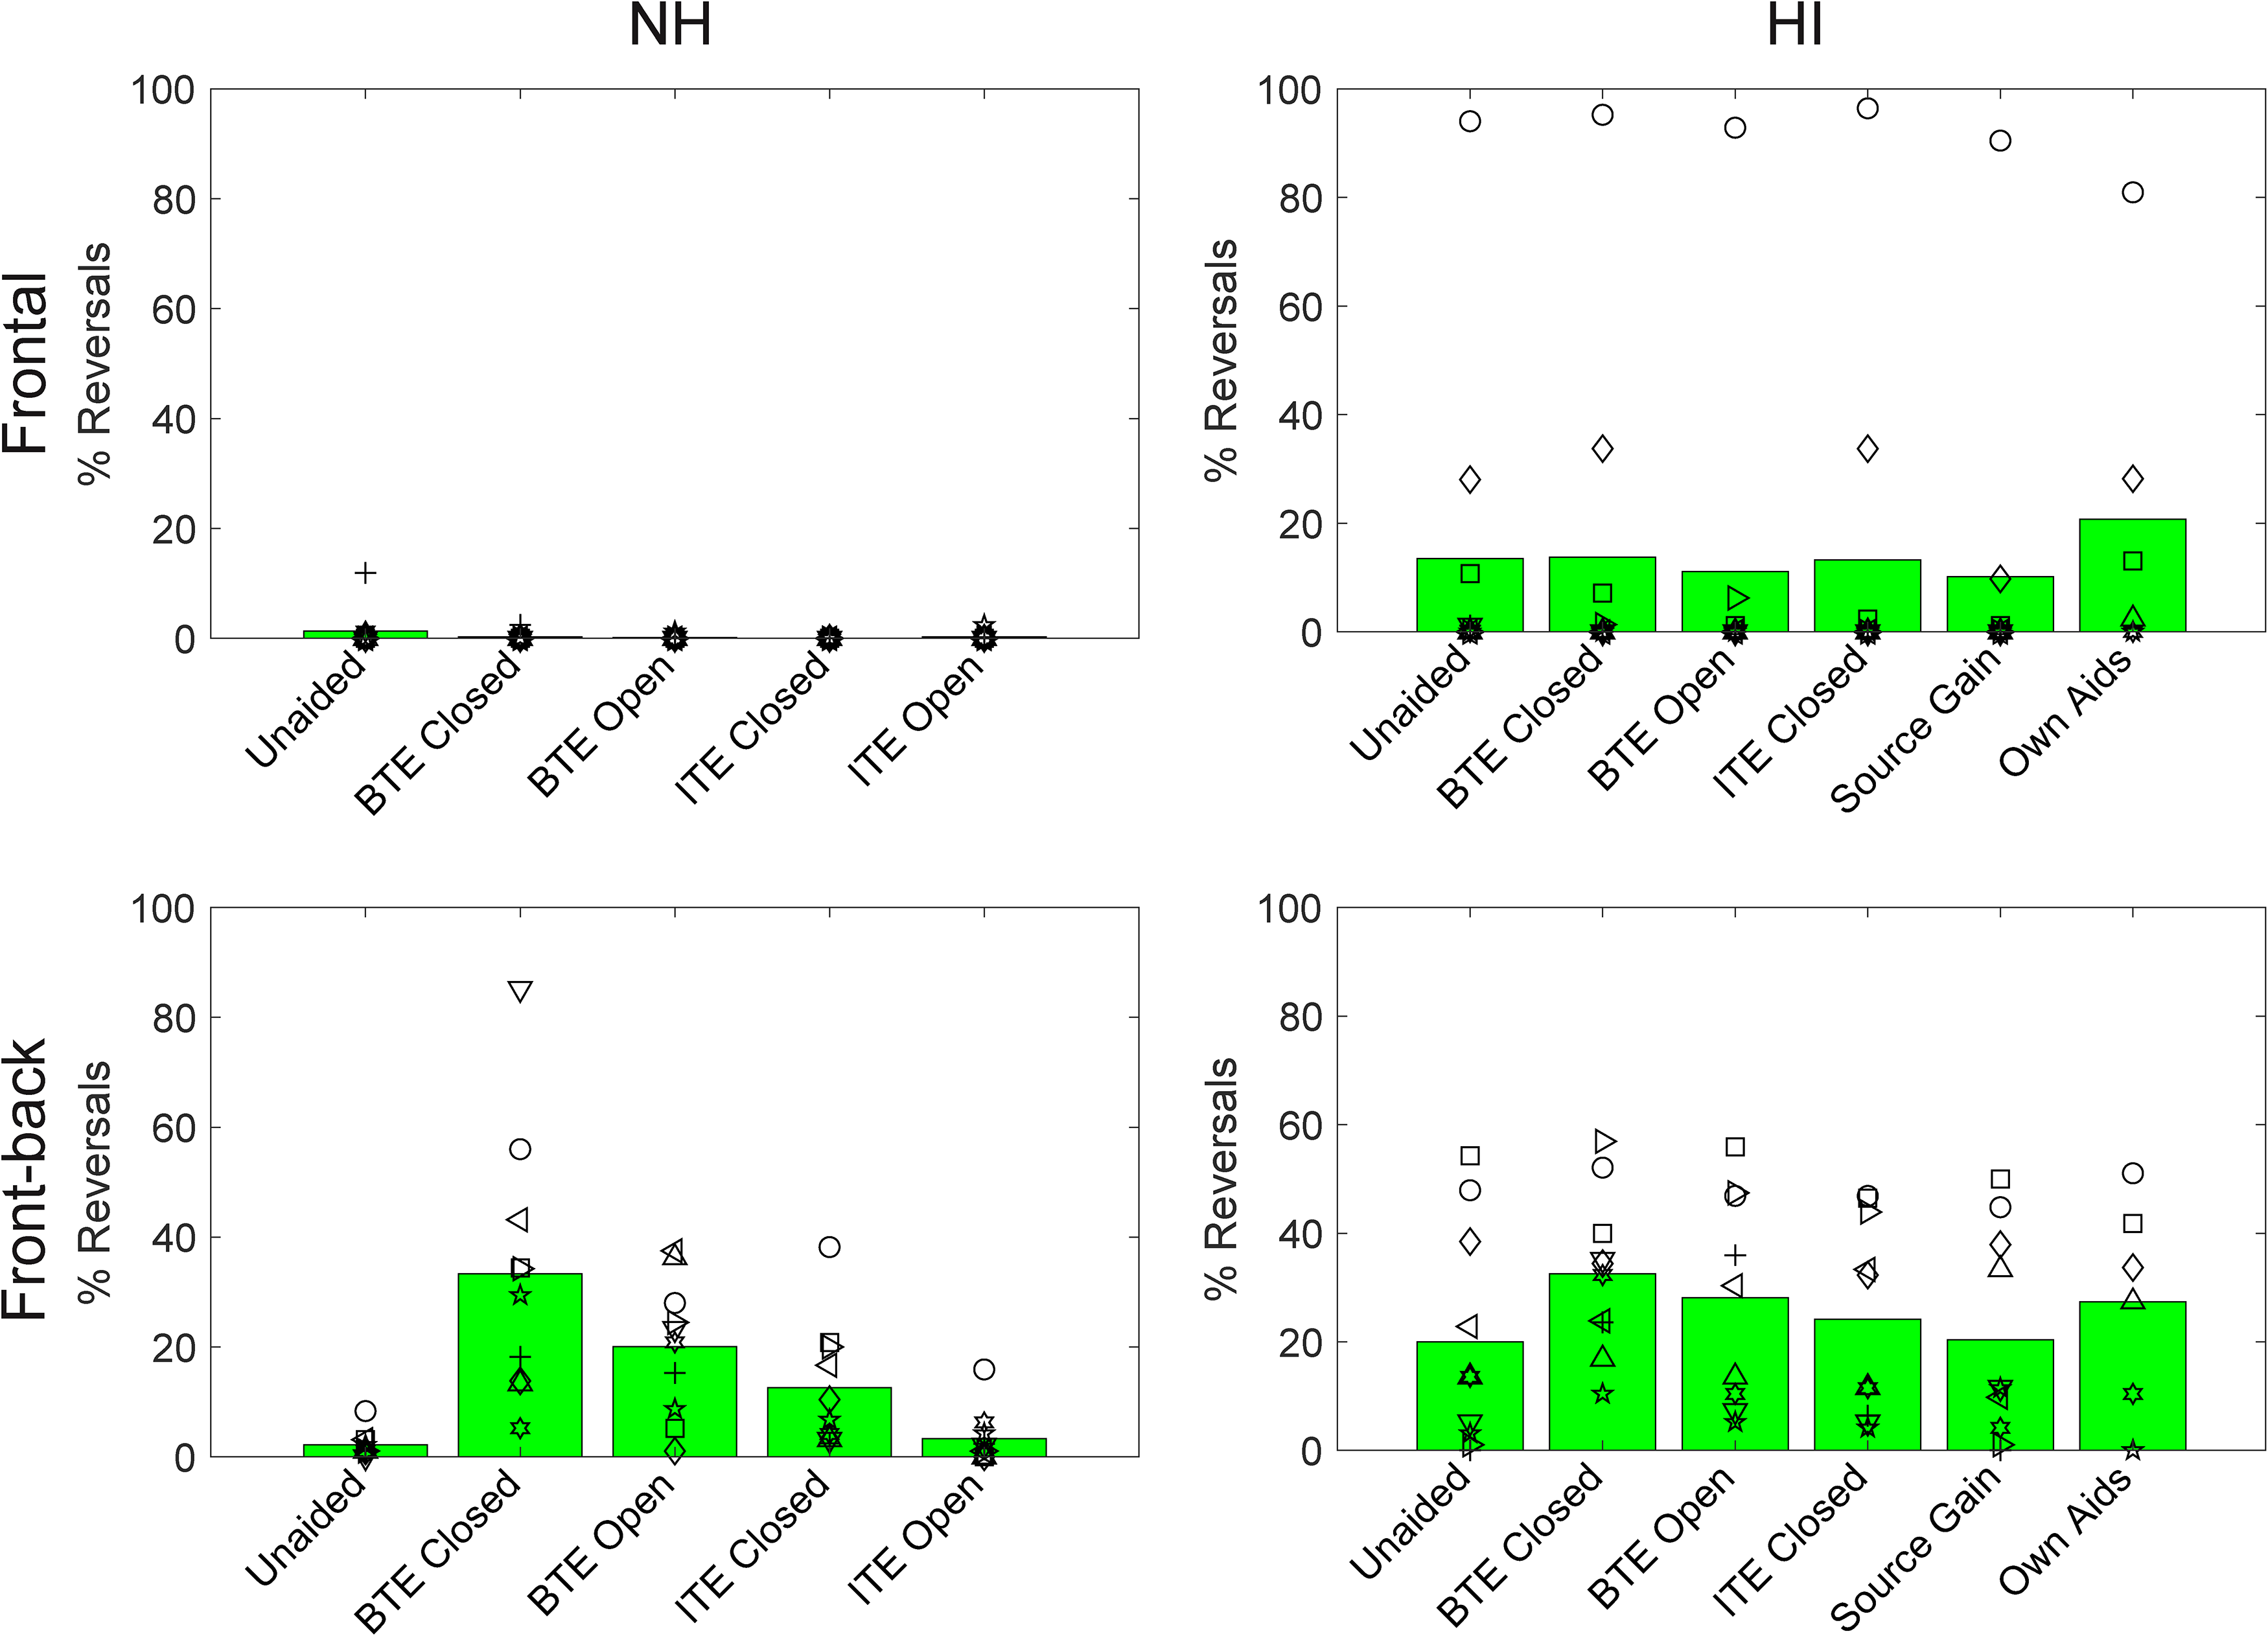
Percentage of front-back reversals for the NH group (left column) and the HI group (right column) for the frontal configuration (top row) and the front-back configuration (bottom row). The bars show group means and the individual symbols show individual listener means (symbols for HI correspond to Figure 1 and Table 1).
As was seen in Figure 3, front-back reversals were very rare in the frontal configuration for NH listeners (<1% of all trials). They occurred more frequently in the HI group (14% of all trials) largely as a result of one or two listeners who had very high rates. Front-back reversals were much more common in the front-back configuration. In the NH group, reversal rates varied across conditions, ranging from 2% in the Unaided condition to 33% in the BTE Closed condition. In the HI group, reversal rates varied less across conditions, but were still lowest in the Unaided condition (20%) and highest in the BTE Closed condition (33%).
Trial-by-trial data were coded as 1 (front-back reversal) or 0 (not a front-back reversal) and analyzed with generalized linear mixed models using the glmer function in R. Models were run separately for NH and HI and frontal and front-back configurations. The model structure and significance testing followed those described above for the internalized responses. The models failed to converge for frontal data, where there were very few reversals, and thus only front-back model results are presented.
These model results are shown in Table 4. In both models, there were significant effects of hearing-aid condition and azimuth, but not level. The significant effect of azimuth reflects the fact that rear sources were more likely to be reversed than frontal sources. Post hoc contrasts for hearing-aid conditions are provided in the Supplementary Material (Tables S9–S10). For the NH group, reversals were more likely for all hearing-aid conditions (except ITE Open) versus Unaided, for all Closed conditions versus Open conditions, and for BTE conditions versus ITE conditions. For the HI group, reversals were more likely for both BTE conditions versus the Unaided condition, for the BTE Closed condition versus all other hearing-aid conditions except BTE Open, and for BTE Open versus Source Gain. Overall, these results indicate that both dome type and microphone position influenced reversals for the NH group, but that only microphone position influenced reversals for the HI group.
A comparison of Figures 5 and 6 reveals some similar patterns across hearing-aid conditions (further supported by the pattern of significant contrasts in the statistical models). This suggests that the conditions that tended to produce more internalized responses were also the conditions that tended to produce more front-back reversals (and vice versa).
Acoustical Analyses
The top row of Figure 7 shows ear-canal spectra measured in KEMAR for the NH group (left column) and the HI group (right column) for stimuli in the frontal configuration. Spectra are shown only for the middle presentation level and are averaged across azimuths and ears. The middle row shows equivalent recordings made for the front-back configuration. The different colored lines in each panel show spectra for the different hearing-aid conditions. For the HI group, the spectra represent the average across the 10 different sets of recordings made with the 10 individualized hearing-aid settings. These plots demonstrate the expected overall increases in gain in the hearing-aid conditions relative to unaided, as well as a number of differences between hearing-aid conditions. For example, there are systematic variations in level in the low- to mid-frequency region, with higher levels observed for the conditions with closed domes (blue and green) and for the Source Gain condition in the HI group (magenta).

Top row: Ear-canal spectra for the NH group (left column) and the HI group (right column) for the frontal configuration. Middle row: Ear-canal spectra for the NH group (left column) and the HI group (right column) for the front-back configuration. Spectra are shown for the middle presentation level, averaged across all loudspeaker azimuths and the two ears. For the HI group, spectra are averaged across the 10 individual hearing-aid settings. Levels are referenced to the mean Unaided level in the lowest frequency band for 0° azimuth. Bottom row: Difference between ear-canal spectra for 0° and 180° in the front-back configuration for the NH group (left) and the HI group (right). Difference spectra are shown for the middle presentation level, averaged across the two ears. Colors depict the different hearing-aid conditions as labeled.
The bottom row of Figure 7 shows the difference in the ear-canal spectra for 0° and 180° in the front-back configuration for each hearing-aid condition. This plot demonstrates that for the Unaided condition, sounds in front result in higher ear-canal levels than sounds in the rear (i.e., the “difference spectra” are largely positive, at least for higher frequencies). This effect is due to how frontal and rear sounds interact with the pinna and provide a reliable cue for front-back discrimination. The difference spectra take a similar form for the ITE conditions, as expected from the in-ear microphone location, which preserves the effects of the pinna. In contrast, the difference spectra for the two BTE conditions have a different form and are even negative for some frequencies. These effects are consistent with detailed measurements presented and described elsewhere (Denk et al., 2018; Durin et al., 2014).
Relationship Between Acoustic and Behavioral Data
As described above, visual inspection of the ear-canal recordings revealed that there were systematic variations in level in the low- to mid-frequency region depending on the hearing-aid condition. Moreover, this systematic variation appeared to mirror some of the patterns seen in the behavioral data (for example, the level in this region is lowest for the Unaided condition and highest for the BTE Closed condition). Thus, we explored the ad hoc hypothesis that ear-canal levels in this region may predict externalization (with higher band levels being associated with poorer externalization). Figure 8 provides some support for this hypothesis. In the top row, mean absolute ratings in the frontal condition are plotted as a function of 1000 Hz band levels (referenced to the Unaided level at 55 dB in each panel) for the NH group (left) and the HI group (right). The colored symbols in each panel depict the different hearing-aid conditions (with color coding per Figure 7). The three lines in each panel connect symbols that correspond to one of the three stimulus levels (dotted: 50 dB; dashed: 55 dB; solid: 60 dB). The effect of stimulus level is seen here in the vertical separation of the three lines (see also Figure 3 and Table 2). For any given stimulus level, however, there is also a rather clear relationship between 1000 Hz band levels and mean absolute externalization ratings (i.e., the lines have a negative slope). The bottom row of Figure 8 shows a similar analysis for the percentage of internalized responses. Here again, there is evidence of an overall level effect, with the louder sounds causing more internalization (see also Figure 3 and Table 3). Moreover, for any given stimulus level, there seems to be a systematic trend for higher 1000 Hz band levels to be associated with higher rates of internalization (i.e., the lines have a positive slope). There is one interesting exception in the HI group. Specifically, the Source Gain condition (rightmost symbols in magenta) produced the highest 1000 Hz band levels overall (see also Figure 7) but did not produce the highest rates of internalization. This may reflect the fact that the ear canals were open in the Source Gain condition and the higher levels were not a result of ear-canal occlusion. It may also reflect the fact that levels were increased overall in the Source Gain condition (see Figure 7), and thus in relative terms the boost at 1000 Hz was not as dramatic as for other conditions.

Top row: Relationship between 1000 Hz band levels (normalized to the Unaided band level at 55 dB in each panel) and absolute externalization ratings in the frontal configuration for the NH group (left) and the HI group (right). Bottom row: Relationship between 1000 Hz band levels (normalized to the Unaided band level at 55 dB in each panel) and internalized responses in the frontal configuration for the NH group (left) and the HI group (right). The colored symbols in each panel depict the different hearing-aid conditions (per Figure 7). The three lines in each panel connect symbols that correspond to one stimulus level (dotted: 50 dB; dashed: 55 dB; solid: 60 dB).
While we only show results for 1000 Hz here, equivalent plots for the whole range of frequencies (500, 1000, 2000, 4000, 8000 Hz) and for both frontal and front-back configurations, are provided in the Supplementary Material (Figures S1 and S2). The value of 1000 Hz was selected for closer inspection because it gave rise to the strongest overall correlations (highest r values) between band levels and behavioral data across all groups, configurations, externalization measures, and levels.
Discussion
General Observations
Despite the fact that we used real sounds presented from loudspeakers that participants could see, we observed a large range of externalization ratings that essentially covered the whole available range. Even in the Unaided condition, where we expected responses to cluster at or close to 10, we saw average ratings of around 6 (see Figure 4). Several choices made in the experiment may have played a role here. First, the experiment was conducted in a typical audiometric booth with little reverberation, and thus very limited cues for absolute distance (Zahorik et al., 2005). Thus, it is perhaps not surprising that responses were driven more strongly by level than by the true location of the source. The use of speech as a stimulus may also have affected responses, as variations in speech level in real-world environments typically arise due to changes in the distance of a talker. Finally, it may simply be that participants were reluctant to repeatedly use the endpoints of the rating scale in the Unaided condition. It is our intention in future studies to investigate different room conditions, different stimuli, and different response methods.
Although it was not the primary goal of the study, our design allows us to draw broad comparisons between groups in terms of their externalization ratings. Absolute ratings in the Unaided condition were comparable across groups (Figure 4), as were the rates of internalized responses (Figure 5), with the exception of one HI listener with extremely high rates of internalized responses and correspondingly low absolute externalization ratings. Unaided front-back reversals were more common in the HI group than in the NH group (Figure 6), consistent with reduced access to high-frequency spectral cues (Best et al., 2010; Brungart et al., 2017). Across hearing-aid conditions, we observed a more compressed range of externalization ratings and internalization rates in the HI group, which may be suggestive of reduced sensitivity to changes in externalization, as has been reported by others (Boyd et al., 2012; Ohl et al., 2010).
Effects of Hearing Aids on Externalization
Our results demonstrated that hearing aids have a disruptive effect on externalization. Relative to unaided listening, the hearing-aid conditions produced lower absolute externalization ratings and more internalized responses. The results point toward two aspects of the hearing-aid form factor that may contribute to disruptions in sound image externalization: occlusion and microphone position.
Regarding occlusion, we found that the Closed conditions produced significantly lower (closer to the head) ratings than the Unaided condition. Moreover, in the majority of cases, the Closed conditions produced significantly lower ratings than the equivalent Open conditions. A similar pattern of results was found for internalized responses, which were most frequent in the BTE Closed condition. Based on these results, we speculate that much like the perception of one's own voice, the perception of external sounds may also be affected by occlusion and that the occlusion effect may reflect a general change in one's sense of connection to the environment. This idea has been discussed previously (Byrne et al., 1998; Byrne & Noble, 1998) but to our knowledge, this study provides the first empirical data on the issue. Our KEMAR measurements suggest that the main acoustic effect of occlusion—essentially an increase in the level of the received stimulus in the low- to mid-frequency region—relates quite well to the changes we observed in externalization reports. Although speculative, it may be that changes in the spectral balance of our speech stimuli contributed to the reductions in perceived distance and the increase in internalized responses. It is important to point out however that we only made ear-canal recordings in KEMAR, and not in each individual listener, largely because of time constraints. As such, we are only able to relate average recordings to average data and discuss broad trends. It would be extremely valuable in future studies to collect real-ear measurements of individual listeners and relate those to individual data. In a recent study, Cubick et al. (2022) measured the occluding properties of hearing-aid domes in multiple people over multiple re-seatings. They observed that while within-subject measurements were quite consistent, and open-dome responses varied little across people, the effective occlusion of closed domes varied widely across people. This kind of variability could be very important in explaining the wide individual differences we see in our externalization data. It would also be interesting to relate externalization responses to own-voice occlusion ratings on an individual level. Real-ear measurements would also provide the opportunity to carefully match the ear-canal levels for the Open and Closed conditions, which may reduce the effects of dome type.
The second physical aspect of hearing aids that we believe may contribute to disruptions in sound image externalization is microphone position. Our data showed that the BTE conditions tended to produce lower absolute externalization ratings and more internalized responses than the equivalent ITE conditions. In the literature, it has been argued that the presence of pinna-related spectral cues is required for good externalization (Baumgartner et al., 2017; Hartmann & Wittenberg, 1996) and that the loss of these cues as a result of the BTE microphone position may directly affect externalization (Boyd et al., 2012). Here we offer a subtly different account whereby incorrect spectral cues may affect externalization somewhat indirectly. This account brings in the well-established fact that BTE hearing aids disrupt front-back discrimination. We observed increases in front-back reversals in the BTE conditions in both NH and HI groups, consistent with many previous reports in the literature (Best et al., 2010; Byrne & Noble, 1998). Reversals when listening through BTE devices result from disruptions to the spectral cues (which normally distinguish frontal sounds from those in the rear) that have been characterized extensively elsewhere (Denk et al., 2018; Durin et al., 2014; see Figure 7). Interestingly, we also observed increased reversals in NH listeners when listening through occluding domes, which has been observed previously in hearing-aid wearers but has no clear explanation that we are aware of (Brimijoin & Akeroyd, 2016). Broadly speaking, the hearing-aid conditions that tended to produce more internalized responses were also the conditions that tended to produce more front-back reversals (and vice versa). Informal reports from the participants, and our own listening, suggest that there are qualitatively different percepts that can arise on BTE trials. On some trials, the word is clearly perceived in front, or in the back, at an appropriate distance (even if that percept constituted a reversal). On other trials, the word is spatially ambiguous (e.g., neither in front nor behind, or both in front and behind) and this may elicit a response of 0 given the available response options. Thus it could be that a breakdown in front-back discrimination contributed to the breakdown in externalization for BTE conditions. It is interesting to consider that these two percepts may often be confounded in experiments that are designed only to detect one or the other. As noted by Durlach et al. (1992): “It takes rather subtle experimental techniques to distinguish among an externalized double image, an externalized single-location image whose position is perceived probabilistically at either of two locations, or a partially internalized image.” This general issue deserves further attention and is relevant not just for hearing aids but for other domains such as virtual reality. A challenge when exploring this issue is that there appear to be strong context effects. In the current study, for example, internalized responses and front-back reversals were more frequent in the front-back configuration than in the frontal configuration, suggesting that participants’ judgments were influenced by the expectation of (or exposure to) sounds from behind in the front-back configuration.
It is worth mentioning briefly that while current hearing-aid users were tested with their own devices, quantitative analysis of this condition is complicated by the fact that only 6 of the 10 HI listeners completed it, and each of those used different devices and settings. Nevertheless, it is interesting to note that these six listeners wore BTE devices, and four had highly occluding domes (Table 1). These factors may have contributed to the relatively high incidence of internalization and front-back reversals in the Own Aids condition (see Figures 5 and 6).
Limitations and Future Directions
While we identified two aspects of hearing aids that appear to affect externalization, in future studies it will also be important to broaden the form factors that we consider. At the current time, we are seeing an explosion in the range of available form factors thanks to the rapidly expanding category of over-the-counter devices (Tucci & Califf, 2022), as well as a new generation of ear-worn consumer products (e.g., Valderrama et al., 2023). Beyond the “physical” factors we investigated here, it is also possible that externalization may be affected by hearing-aid processing. Indeed it has been shown that non-linear processing can disrupt binaural cues (Brown et al., 2016) and that the resulting unnatural combinations of cues can reduce externalization (Wiggins & Seeber, 2012). Non-linear processing may also impact externalization by altering the reverberant qualities of signals (Hassager et al., 2017) or self-motion cues (Brimijoin et al., 2016). We did not specifically investigate these issues in the current study. In our NH group, we deliberately focused our investigation on physical factors by using linear gain and turning off all special features. The manufacturer settings used for our HI group included compressive gain, and it is possible that this contributed to the results found for this group, although the broad similarity of results across groups suggests any contribution was relatively small.
An important limitation of our study is that we measured acute effects only; participants were fit with hearing aids immediately before testing and had no chance to acclimatize to them (except when tested with their own aids) or to the testing environment. This choice was quite deliberate, as we felt that it was important to first establish that we can observe an effect in the laboratory and to get a sense for the conditions under which it is observed, before studying how familiarization (or active training) with hearing aids may potentially alleviate the problem and what the timescales involved are, etc. Previous studies on listeners with hearing loss fitted with different styles of hearing aids (e.g., Best et al., 2010) suggest that acute disruptions to sound localization are reduced but not fully eliminated after several weeks of acclimatization. We are aware of only one study that has considered externalization (Boyd, 2014), wherein listeners with NH were fit with BTE devices and showed acute disruptions to externalization that were reduced but not eliminated after several hours of acclimatization. While our sample included several hearing-aid wearers who were tested with their own aids, our sample size was not large enough to address how extended hearing-aid use moderates acute effects related to externalization.
Another limitation of the current study is that we are not able to determine the contribution of head movements to the measured externalization ratings. While the stimuli were relatively brief and participants were asked to keep their head still, the head was not physically stabilized, and head position was not recorded. Given that active head movements are known to counteract the effects of incorrect spectral cues (Brimijoin & Akeroyd, 2012; Wallach, 1940), it is possible that the impact of microphone position would be reduced when users move around. One study that examined this idea in hearing-aid users, however, concluded that non-linear processing in hearing aids may distort dynamic binaural cues and thus impede the use of head movements (Brimijoin & Akeroyd, 2016). Additional studies are needed to determine the impact of hearing aids on externalization in dynamic real-world scenarios.
Finally, having established that hearing aids can impact externalization, an important next step will be to explore what the consequences of poor externalization are in relevant real-world tasks such as spatial orientation, auditory scene analysis, and competing talker situations (extending the efforts of Cubick et al., 2018).
Conclusion
On average, compared to unaided listening, hearing aids tended to disrupt the externalization of speech stimuli, reducing perceived distance and causing more internalized responses. This was especially true for closed domes in combination with BTE microphones. Our analyses suggest that there may be two contributing causes: increased ear-canal levels with closed domes (occlusion) and incorrect spectral cues with BTE microphone positioning (spatial ambiguity).
Supplemental Material
sj-pdf-1-tia-10.1177_23312165241229572 - Supplemental material for Externalization of Speech When Listening With Hearing Aids
Supplemental material, sj-pdf-1-tia-10.1177_23312165241229572 for Externalization of Speech When Listening With Hearing Aids by Virginia Best and Elin Roverud in Trends in Hearing
Footnotes
Acknowledgments
The authors would like to thank Gerald Kidd, Chris Mason, Bill Hartmann, Bill Whitmer, Ganesh Swaminathan, and Dorea Ruggles for their support and helpful discussions. The data, recordings, and relevant analysis scripts will be made freely available upon request.
Declaration of Conflicting Interests
The authors declared no potential conflicts of interest with respect to the research, authorship, and/or publication of this article.
Funding
The authors disclosed receipt of the following financial support for the research, authorship, and/or publication of this article: This work was supported by the National Institute on Deafness and Other Communication Disorders (grant number DC015760).
Supplemental Material
Supplemental material for this article is available online.
References
Supplementary Material
Please find the following supplemental material available below.
For Open Access articles published under a Creative Commons License, all supplemental material carries the same license as the article it is associated with.
For non-Open Access articles published, all supplemental material carries a non-exclusive license, and permission requests for re-use of supplemental material or any part of supplemental material shall be sent directly to the copyright owner as specified in the copyright notice associated with the article.