
Abstract
The objective to preserve residual hearing during cochlear implantation has recently led to the use of intracochlear electrocochleography (ECochG) as an intraoperative monitoring tool. Currently, a decrease in the amplitude of the difference between responses to alternating-polarity stimuli (DIF response), predominantly reflecting the hair cell response, is used for providing feedback. Including other ECochG response components, such as phase changes and harmonic distortions, could improve the accuracy of surgical feedback. The objectives of the present study were (1) to compare simultaneously recorded stepwise intracochlear and extracochlear ECochG responses to 500 Hz tone bursts, (2) to explore patterns in features extracted from the intracochlear ECochG recordings relating to hearing preservation or hearing loss, and (3) to design support vector machine (SVM) and random forest (RF) classifiers of acoustic hearing preservation that treat each subject as a sample and use all intracochlear ECochG recordings made during electrode array insertion for classification. Forty subjects undergoing cochlear implant (CI) surgery at the Oslo University Hospital, St. Thomas’ Hearing Implant Centre, or the University Hospital of Zurich were prospectively enrolled. In this cohort, DIF response amplitude decreases did not relate to postoperative acoustic hearing preservation. Exploratory analysis of the feature set extracted from the ECochG responses and preoperative audiogram showed that the features were not discriminative between outcome classes. The SVM and RF classifiers that were trained on these features could not distinguish cases with hearing loss and hearing preservation. These findings suggest that hearing loss following CI surgery is not always reflected in intraoperative ECochG recordings.
Keywords
Introduction
The objective to reduce surgical trauma and preserve residual hearing during cochlear implantation has recently led to the use of intracochlear electrocochleography (ECochG) as an intraoperative monitoring tool. Cochlear implant (CI) manufacturers have enabled real-time measurements of ECochG responses through the electrodes of the CI using back-telemetry. During CI insertion, responses are usually collected using the most apical electrode of the array while using acoustic stimuli with alternating polarity. Currently, a detected decrease in the amplitude of the difference between responses to alternating-polarity stimuli (DIF response) is used for providing feedback; this ECochG component predominantly reflects the hair cell response and was shown to be the most sensitive to cochlear trauma (Choudhury et al., 2011), which usually occurs near the end of insertion. Although ECochG-based surgical feedback helped preserve residual hearing in a clinical trial (Bester et al., 2021), and DIF response amplitude decreases correlated with postoperative acoustic hearing loss in several studies (Campbell et al., 2016; Giardina et al., 2019; Koka et al., 2018; Lenarz et al., 2022; Weder et al., 2020), the observed relationships were only moderate and were not found in all cohorts (O'Connell et al., 2017). Overall, the predictive power of the observed amplitude drops was low, and the research methods differed between studies.
Campbell et al. (2016) recorded ECochG responses during continuous CI insertions in 18 subjects. They distributed the recordings into a group with no or only reversible DIF response amplitude drops and a group in which an irreversible drop occurred. They demonstrated that the distributions of low-frequency hearing losses, averaged at 250 and 500 Hz, were significantly different between the two groups (nonparametric Kruskal–Wallis test, p = .02, with median hearing losses of 10 and 25 dB for the groups without and with an irreversible drop, respectively).
Giardina et al. (2019) recorded ECochG responses during stepwise insertions in 12 subjects. Hearing preservation, defined as <80 dB postoperative audiometric threshold at 250 Hz, was successful in 9 of 12 subjects. Using contingency tables, they found that the occurrence of a DIF response amplitude decrease ≥2 dB with respect to the initial recording could predict postoperative hearing loss with a sensitivity of 100%. However, as these drops also occurred in most cases with hearing preservation, the specificity was only 44%.
Lenarz et al. (2022) recorded ECochG responses during continuous CI insertions in 68 subjects. DIF response amplitude decreases were defined as the change in amplitude from the peak to the largest drop after the peak. The change in pure tone average (PTA) was calculated for frequencies between 125 and 500 Hz. They found a moderate positive correlation (r = 0.56, p < .01) between the size of the DIF response amplitude drop and the magnitude of the PTA change.
Weder et al. (2020) recorded ECochG responses during continuous CI insertions in 55 subjects and characterized amplitude decreases in the DIF responses (from the peak to the largest drop after the peak) and their slope steepness. They used the binary hearing preservation metric of >25% residual hearing loss at 500 Hz (Skarzynski et al., 2013). Using receiver operating characteristic analyses, they found that the most efficient cut-off criterion for a relative hearing loss of 25% was an amplitude loss of 61% at a fixed slope steepness of 0.2 μV/s. This criterion returned an area under curve of 0.81, significantly <0.50 (p < .0001).
O'Connell et al. (2017) recorded ECochG responses during continuous CI insertions in 18 subjects and analyzed correlations between amplitude changes in the DIF responses and postoperative changes in the PTA. They found that a low-frequency PTA shift, averaged at 125, 250, and 500 Hz, did not correlate significantly with round window to peak amplitude (r = −0.40, p = .17) nor drop from peak to completion of insertion (r = 0.26, p = 0.38).
Changes in ECochG responses can have a multitude of causes. When using a 500 Hz tone burst for acoustic stimulation, DIF response amplitude decreases unrelated to cochlear trauma often occur near full insertion. They are likely caused by destructive interferences of hair cells from the 500 Hz resonance location and more basal hair cells since the response generators from these locations move out of phase (Giardina et al., 2019; Soulby et al., 2021). Such atraumatic amplitude decreases are often accompanied by phase shifts and harmonic distortions (Kohllöffel, 1970; Soulby et al., 2021).
In addition, 180-degree phase shifts could be caused by the movement of the recording electrode around the hair cell's electric dipole (Davis et al., 1950; Hudspeth, 1982). Harmonic distortions can also result from simultaneous contributions of inner and outer hair cells from the same tonotopic regions to the ECochG recordings. Outer hair cell responses relate to basilar membrane displacement, while inner hair cell responses relate to fluid pressure velocity (Dallos et al., 1972). Hence, inner hair cell responses are the derivative of outer hair cell responses. While ECochG responses are generated mainly by outer hair cells in normal hearing subjects, outer hair cells are largely lost in CI recipients. The relative contribution of inner hair cells in this population is yet to be resolved and likely varies along the cochlear duct and between individuals.
Amplitude decreases in the DIF responses may also be caused by interferences between hair cell and neural components (Giardina et al., 2019). Furthermore, they could result from contact between the electrode array and the basilar membrane instead of cochlear trauma (Kiefer et al., 2006), although impingement of the basilar membrane can also cause postoperative hearing loss. The advancement of the recording electrode beyond the site of response generation along the basilar membrane may additionally result in amplitude decreases (Walia et al., 2022). Amplitude variations in the summated responses to alternating-polarity stimuli (SUM response) could also result from cochlear trauma, basilar membrane fixation, or changing contributions of hair cells and neural structures to the ECochG responses (van Gendt et al., 2020). Finally, ECochG amplitude decreases during CI insertion may be caused by flooding of the middle ear due to bleeding or excessive water flushing.
Phase changes and harmonic distortions in the DIF responses and amplitude changes in the SUM response can help distinguish atraumatic from traumatic DIF response amplitude drops (Dalbert et al., 2021; Giardina et al., 2019; Koka et al., 2018; Sijgers et al., 2021; Weder et al., 2021). Giardina et al. (2019) and Weder et al. (2021) both showed that the inclusion of phase changes in the DIF responses and changes in the ratio of SUM and DIF response amplitudes improved the prediction of hearing outcomes compared with DIF response amplitude decreases alone. Giardina et al. (2019) included these ECochG features in their contingency table and observed a specificity increase from 44% to 89% while the sensitivity of 100% was retained. Weder et al. (2021) analyzed the relationship between these ECochG features and postoperative hearing outcomes in all subjects for whom a DIF response amplitude decrease was detected in the ECochG responses (35/73 cases). Using multiple linear regression, they obtained a total model R2 of 0.30 when including phase changes in the DIF responses and changes in the ratio of SUM and DIF response amplitudes as predictors of postoperative hearing loss.
A classifier of postoperative hearing outcomes trained on various features extracted from intraoperative ECochG recordings may distinguish patterns in the responses relating to hearing preservation and hearing loss. Real-time classification of cochlear functionality based on intraoperative ECochG recordings could be utilized to provide feedback to the surgeon and thereby prevent cochlear trauma. However, making a classifier of single ECochG recordings obtained during CI electrode insertion is currently infeasible, as assessments of cochlear functionality or trauma cannot be made in real time during surgery. Therefore, the first step would be to perform classification on a per-subject base. This could aid the eventual development of a real-time classifier by providing insights into relevant parameters and model architectures. In addition, per-subject classification could be deployed for end-of-insertion predictions of postoperative hearing outcomes.
Here, ECochG responses were recorded during CI electrode array insertion in the Oslo University Hospital, St. Thomas’ Hearing Implant Centre in London, and the University Hospital of Zurich. In Oslo, London and Zurich, intracochlear ECochG responses were recorded during slow, continuous insertions of the electrode array. Responses recorded after the insertion of electrodes 2, 4, 8, 12, and 16 and at full insertion were extracted from the continuous recordings to obtain pseudo stepwise recordings. In Zurich, simultaneous intracochlear and extracochlear recordings were additionally obtained during stepwise insertions. The objectives of the present study were (1) to compare simultaneously recorded intracochlear and extracochlear responses to enhance the interpretation of the intracochlear recordings, (2) to explore patterns in features extracted from the (pseudo) stepwise intracochlear ECochG recordings relating to hearing preservation or hearing loss, and (3) to design support vector machine (SVM) and random forest (RF) classifiers of acoustic hearing preservation that treat each subject as a sample and use all intracochlear ECochG recordings made during electrode array insertion for classification. With this, we aimed to investigate the feasibility of predicting postoperative hearing preservation based on various components of intraoperative ECochG responses. Furthermore, by assessing the final models’ performance on a test dataset, the predictive performance of ECochG recordings for determining postoperative hearing loss could be determined.
Methods
Subjects with residual hearing at 500 Hz undergoing CI surgery at the Oslo University Hospital, St. Thomas’ Hearing Implant Centre in London, or the CI center of the University Hospital of Zurich were enrolled in this study. In London, two children were included and were implanted bilaterally; ECochG recordings were made on both sides and were included as separate subjects in this study. The study was approved by the local ethical committees (REK Norway 2017/1839 in Oslo, IRAS: 214480 in London, and KEK-ZH 2013-0317 and KEK-ZH 2020-00639 in Zurich), and all subjects provided written informed consent before surgery. Subjects received a Mid-Scala, SlimJ, or SlimJ3D CI (Advanced Bionics LLC, Stäfa, Switzerland), with 16 intracochlear electrode contacts and electrode number 1 referring to the most apical electrode. CI surgery was conducted by performing an anterior mastoidectomy and posterior tympanotomy. The electrode array was then inserted through the round window. During insertion, it is expected that the SlimJ electrode array touches the lateral wall in the basal turn, while the Mid-Scala array should not contact the lateral wall or modiolus. The SlimJ array usually achieves a lateral placement at full insertion, while the Mid-Scala electrode array is typically positioned in the middle of the scala.
Electrocochleography Recordings
Responses to acoustic stimuli at 500 Hz were acquired during the insertion of the CI electrode array, whereby the recording methods differed between the three research groups (see Table 1). For part of the recordings in Zurich, the electrode array was inserted in a stepwise manner, and ECochG responses were recorded at each step while holding the electrode array in place. The number of inserted electrodes during each recording was marked, and the insertion was video recorded. For the remaining surgeries in Zurich and all recordings in Oslo and London, ECochG measurements were made continuously during slow insertions of the electrode array. The total insertion duration was usually around 3 min for all groups. The research group in Oslo made synchronized video and fluoroscopy recordings of the insertion to link the ECochG recordings and corresponding insertion depths. The groups in London and Zurich used vocal cues to mark the time points at which each CI electrode entered the cochlea and the time at which insertion was complete.
Overview of the Recording Methods for the Three Different Research Groups.
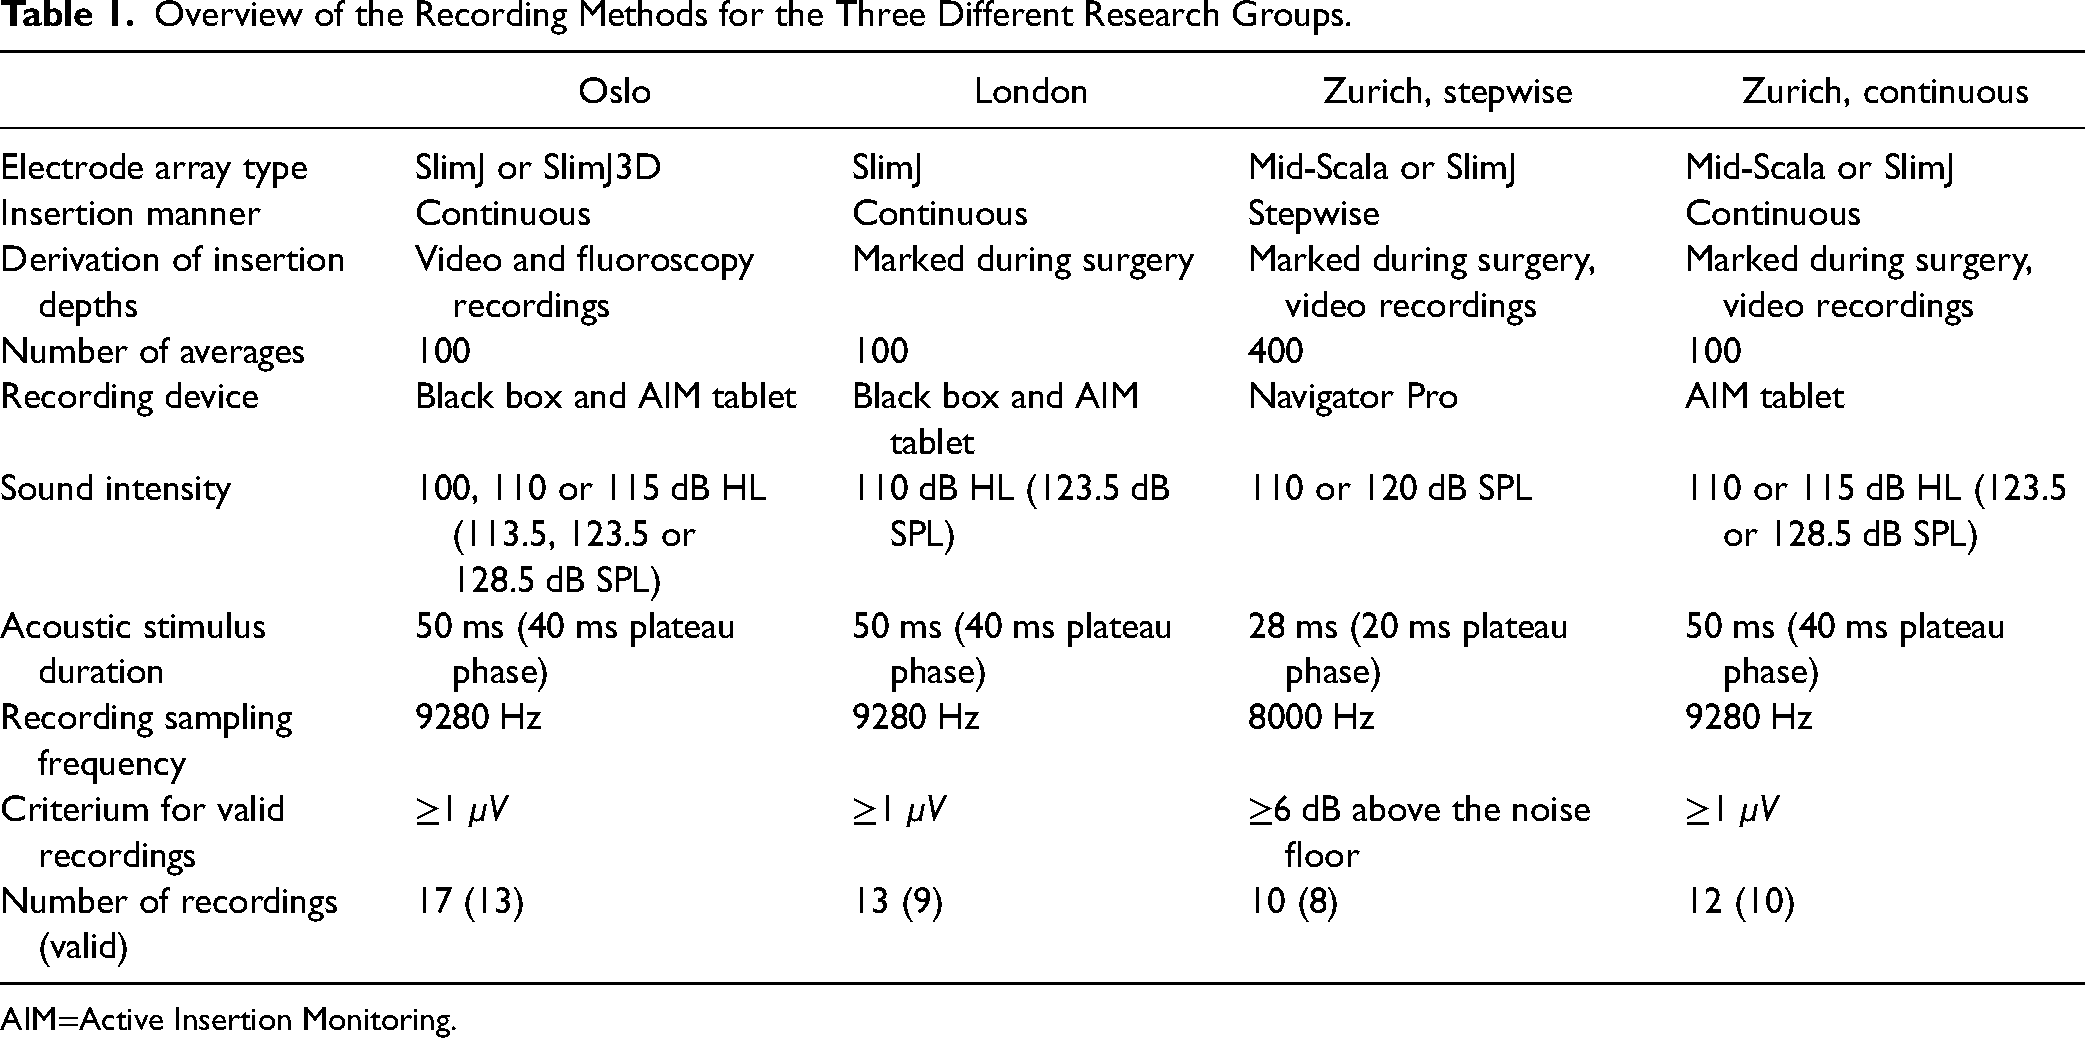
AIM=Active Insertion Monitoring.
The stepwise insertions in Zurich were made in four or five steps, with two electrodes inserted at the first step, while a full insertion of the electrode array was achieved at the final step. Responses to 400 acoustic stimuli with alternating starting phases were acquired at each step. Separate averages were obtained for condensation and rarefaction stimuli, and the SUM and DIF responses were derived from these averages by respectively adding and subtracting them. From the continuous recordings from the Zurich, Oslo, and London groups, responses recorded after the insertion of electrodes 2, 4, 8, 12, and 16 and at full insertion were extracted to obtain pseudo stepwise recordings. For each of these six “steps,” responses to 100 acoustic stimuli with alternating starting phases were averaged, corresponding to a recording duration of 7s per step. The SUM and DIF responses were derived. The number of averages taken was a trade-off between the signal-to-noise ratio (SNR) and the amount of movement of the recording electrode between measurements that were averaged. The insertion depths of the CI's most apical electrode at each step (in mm) were estimated using specifications provided by the manufacturer.
Stepwise ECochG measurements were made using the Navigator Pro stimulation and recording device (Biologic Systems, Mundelein, IL, USA). Simultaneous intracochlear and extracochlear ECochG responses were acquired at a sampling rate of 8000 Hz from a needle electrode placed on the promontory and the CI's most apical electrode. Access to the apical electrode was obtained by creating a short-circuit between this electrode and the reference ring electrode and attaching a clip electrode to the CI's ring ground. The details of the recording method and measurement setup are described by Sijgers et al. (2021). Only the intracochlear recordings were included for classification, but a comparison with simultaneous extracochlear recordings was made to obtain additional insights. For acoustic stimulation, a tone burst was used with an intensity of 110 or 120 dB SPL and a duration of 28 ms, including a 4 ms rise and fall time shaped by a Blackman window. Recordings were band-pass filtered by the recording device with the high-pass filter cut-off frequency set at 10 Hz and the low-pass filter cut-off frequency set at 3000 Hz.
Continuous ECochG measurements were made using either the “Black Box” device or the “Active Insertion Monitoring (AIM) Tablet” (Advanced Bionics LLC). Intracochlear ECochG responses were acquired at a sampling rate of 9280 Hz from the CI's most apical electrode. The details of the recording method and measurement setup are described by Soulby et al. (2021). For acoustic stimulation, a tone burst with an intensity between 100 and 115 dB HL (113.5 and 128.5 dB SPL) and a duration of 50 ms, including 5 ms linear onset and offset ramps, was used.
The recordings were analyzed using MATLAB (MathWorks, Inc., Natick, MA, U.S.A.). A Fast Fourier Transform (FFT) was performed on the DIF and SUM responses using a rectangular window over the range of 6 to 22 ms (stepwise recordings) or 15 to 45 ms (continuous recordings), starting at the time of stimulus presentation. Signals recorded using the AIM Tablet were high-pass filtered before determining the FFTs using a sixth order Butterworth filter with a cut-off frequency of 100 Hz. This was done to remove the offset, which was especially large in the SUM response obtained with this system. The amplitude and phase of each DIF response were obtained from the FFT bin at 500 Hz; the amplitude of the SUM response was determined from the FFT amplitude at 1 kHz.
Following stepwise insertions, a noise floor recording was made by disconnecting the insert earphone from the loudspeaker and repeating the ECochG measurement. A measurement was considered valid if the FFT amplitude of the DIF response was at least 6 dB above the amplitude of the corresponding FFT bin in the noise floor recording. Since noise floor recordings were not made after continuous insertions, continuous measurements were considered valid if the FFT amplitude of the DIF response was at least 1 μV. A value of 1 μV was chosen to ensure that ECochG responses could be visually distinguished from the noise floor.
Recordings from a subject were included for classification if at least the first or the second measurement was considered valid. In total, recordings from 8 out of 10 subjects with stepwise insertions and 10 out of 12 subjects with continuous insertions included in Zurich, 13 out of 17 subjects included in Oslo, and 9 out of 13 subjects included in London were considered valid, leading to the inclusion of data from 40 subjects for classification. The data from London and recordings from 6 out of 10 subjects with stepwise insertions from Zurich were previously published (Sijgers et al., 2021; Soulby et al., 2021).
Audiometry
PTAs were usually conducted within 3 months prior to surgery and approximately 4 to 6 weeks after surgery. Air conduction threshold values were determined at 0.25, 0.5, 1, and 2 kHz. To calculate the PTA from these frequencies, the maximum output of the audiometer plus 5 dB was used as a threshold value if no response was present at the maximum output of the audiometer (90 dB HL for 0.25 kHz and 115 dB HL for 0.5, 1, and 2 kHz). Three hearing preservation categories were defined based on the preoperative and postoperative PTAs (Balkany et al., 2006): (1) complete hearing preservation (mean hearing loss of ≤10 dB), (2) partial hearing preservation (mean hearing loss of >10 dB with some remaining hearing at the assessed frequencies), and (3) no hearing preservation (complete loss of residual hearing). For classification purposes, categories 2 and 3 were combined into one “partial or complete hearing loss” group; this was done to enable a more straightforward translation of the study results into devices providing real-time surgical feedback. In one of the two children, postoperative audiometry was only conducted at 0.5 kHz. Since the hearing thresholds at this frequency decreased from 75 to 105 dB HL for the left ear and from 60 to 100 dB HL for the right ear, partial hearing loss was concluded on both sides.
Feature Extraction
MATLAB was used to extract features from the stepwise or pseudo stepwise ECochG recordings and audiogram of each subject. Subsequently, an exploratory analysis of the feature set was performed in the R software. Table 2 shows the list of features that were used for classification. These features were chosen because the simultaneous intracochlear and extracochlear ECochG recordings presented by Sijgers et al. (2021) suggested that they may be relevant for the classification of hearing outcomes. In Table 2, the “distance between recordings” is defined as the difference in insertion depths (in mm) of the CI's apical electrode between these recordings. The total harmonic distortion is defined as the ratio of the equivalent root mean square (RMS) voltage of all the harmonic frequencies, starting from the second harmonic, over the RMS voltage of the fundamental frequency (in this case, 500 Hz). Equation (1) shows the RMS formula used to calculate feature 12, including only FFT amplitudes below 3 kHz to account for the low-pass filter of the Navigator Pro recording device.
List of Features Used for Classification.

Hearing thresholds are in dB HL, ECochG amplitude changes are in dB, phase changes are in degrees and insertion depths and distances between recordings are in mm. The parameter values for features marked with (*) were set to zero in case no increase or decrease was detected. The location of the DIF response drop, marked with (**), was set to the location of the smallest DIF response increase in case no drop was detected. PTA=pure tone average.
As SVMs and RFs cannot automatically deal with missing values, the parameter values for features marked with (*) were set to zero in case no increase or decrease was detected. The location of the DIF response drop (feature 11, marked with **) was set to the location of the smallest DIF response increase in case no drop was detected.
Model Development
The models used for classification were developed using Python's Scikit-Learn library. Figure 1 shows the development cycle of the classifiers, and Figure 2 further elaborates on steps 3, 4, and 5 of Figure 1. The dataset used for hearing outcome classification consisted of 40 samples (subjects) from 2 different classes (complete hearing preservation, and partial or complete hearing loss; step 1), with 14 features for each sample (step 2). The features were chosen based on prior research, as discussed in the previous section. Features can be optimized based on the modeling outcomes for further development of the classifier in the future, as demonstrated in Figure 1.

Development cycle of the ECochG-based SVM and RF for classifying cochlear trauma. Scaling is only applied as part of step 3 for SVM development. ECochG=electrocochleography; RF=random forest; SVM=support vector machine.

Overview of the process used to train and evaluate the SVM and RF models. Initially, the dataset is divided into a training and test set. The training set is then split into five folds. For each combination of hyperparameters, five model fits are made, whereby four of the folds serve as a training set and one fold serves as a validation set. The resulting five f1 scores are averaged and the model with the highest mean f1 (training score) is chosen. The performance of the final model is evaluated using the held-out test dataset. RF=random forest; SVM=support vector machine.
The data was split into a training and test dataset (step 3). The test dataset was used only to score the tuned classifier and was not used in any preceding steps. Twenty-five percent of the total dataset was kept apart for testing the final model, with stratification of the hearing outcome to preserve the percentage of samples from each class. After the data had been split, scaling was applied to the training and test dataset used to develop the SVM, but not the RF, to obtain zero mean and unit variance. This is important because SVMs are optimized by minimizing the decision vector; hence, the optimal hyperplane is influenced by the scale of the input features.
Selected hyperparameters of the SVM and RF were optimized using three different tuning techniques: grid search, randomized search, and Bayes optimization (step 4). The goal of the tuning process was to identify the hyperparameter values that reduce the training error of the classifier. Grid search tests every unique combination of hyperparameters in a search space defined by the user to determine the combination that yields the best performance. With random search, the user defines a distribution for the hyperparameter search space instead of a set of values. A specific number of hyperparameter sets, defined by the user, is then evaluated randomly. The user also chooses a hyperparameter distribution and number of iterations for Bayes optimization, but instead of assessing combinations of hyperparameters randomly chosen from this space, the Bayesian optimization method can converge to the optimal hyperparameters by learning from previous iterations. Since these optimization methods each assess different hyperparameter values, we used all three to maximize the chance of finding an optimal model.
The SVM hyperparameters that were iterated over were “C,” the type of kernel, and some kernel-specific parameters. The parameter value space was chosen based on common practice. Table 3 shows the hyperparameters that were tuned, as well as their interpretation and the parameter space that was iterated over. The functions of the linear, polynomial, and radial basis function kernel are shown in equations 2, 3, and 4, respectively, where 
SVM Hyperparameters That Were Iterated Over During Model Optimization.

SVM=support vector machine.


The RF hyperparameters that were iterated over were the number of trees, the splitting criterion, the maximum tree depth, the minimum number of samples required to split an internal node, the minimum number of samples required to be at a leaf node, and the number of features to consider when looking for the best split. Table 4 shows the hyperparameters that were tuned, as well as their interpretation and the parameter space that was iterated over. The functions of the gini index and entropy splitting criterion are shown in equations (5) and (6), where 
Random Forest Hyperparameters That Were Iterated Over During Model Optimization.


Within the search for the optimal hyperparameters, five-fold cross-validation was used to fit the SVM and RF to the training dataset to avoid overfitting. Using grid search, the combinations of hyperparameters that were iterated over resulted in a total of 864 SVM candidate models and 1728 RF candidate models that were fitted per fold. The same number of iterations was made for randomized search and Bayes optimization.
The parameter “f1,” defined as the harmonic mean of precision and recall, was chosen for evaluating model performance and selecting the optimal hyperparameters since it has been designed to work well on data with imbalanced classes (step 5). To combine the f1-scores of both classes into a single number, the arithmetic mean of the per-class f1-scores was taken (called the macro-averaged f1-score, or macro-f1).
Analysis of Results
The final model performance was analyzed using the held-out test dataset. Based on the results, the feasibility of ECochG-based classification of cochlear trauma and the importance of different features for outcome predictions were assessed. In addition, recommendations were made for ECochG-based classification of cochlear trauma and for further development of the classifier.
Results
Electrocochleography Recordings
In Oslo and London, preoperative hearing at 500 Hz was ≤80 dB HL for all included subjects except one. In Zurich, the inclusion criteria were less strict, and preoperative hearing at 500 Hz was ≤80 dB HL in only around half of all cases. Overall, of the 40 subjects in whom valid ECochG responses were recorded, hearing was preserved in 15 cases, while hearing loss occurred in 25 cases. In 7 out of these 25 cases, the hearing was completely lost. Figure 3 shows the preoperative and postoperative audiograms (mean ± SD) for subjects with hearing preservation and hearing loss.

The preoperative and postoperative audiograms (mean ± SD) for subjects with hearing preservation and hearing loss. The audiograms of the child in whom postoperative audiometry was only conducted at 0.5 kHz, and who had a partial hearing loss on both sides, were omitted from the figure.
Figures 4 and 5 show the phase and amplitude of the intraoperative and extracochlear DIF responses recorded in Zurich. Figure 4 shows the cases with sudden, near 180-degree phase shifts (5/10), while Figure 5 shows the cases with slight, gradual phase changes (5/10). The five subjects with sudden, near 180-degree phase shifts all show large intracochlear signal amplitudes and large differences in amplitudes between intraoperative and extracochlear recordings. In comparison, the intracochlear signal amplitudes are much smaller overall for the five subjects with slight, gradual phase changes. For these subjects, intracochlear amplitudes are much larger than extracochlear amplitudes in only one case (S08). The recordings from subjects S05 and S10 were not included for classification because they were not considered valid based on the SNR criterium. For the remaining subjects, hearing was preserved for S03 and S06, while it was completely lost for S04 and S09 and partially lost for S01, S02, S07, and S08.
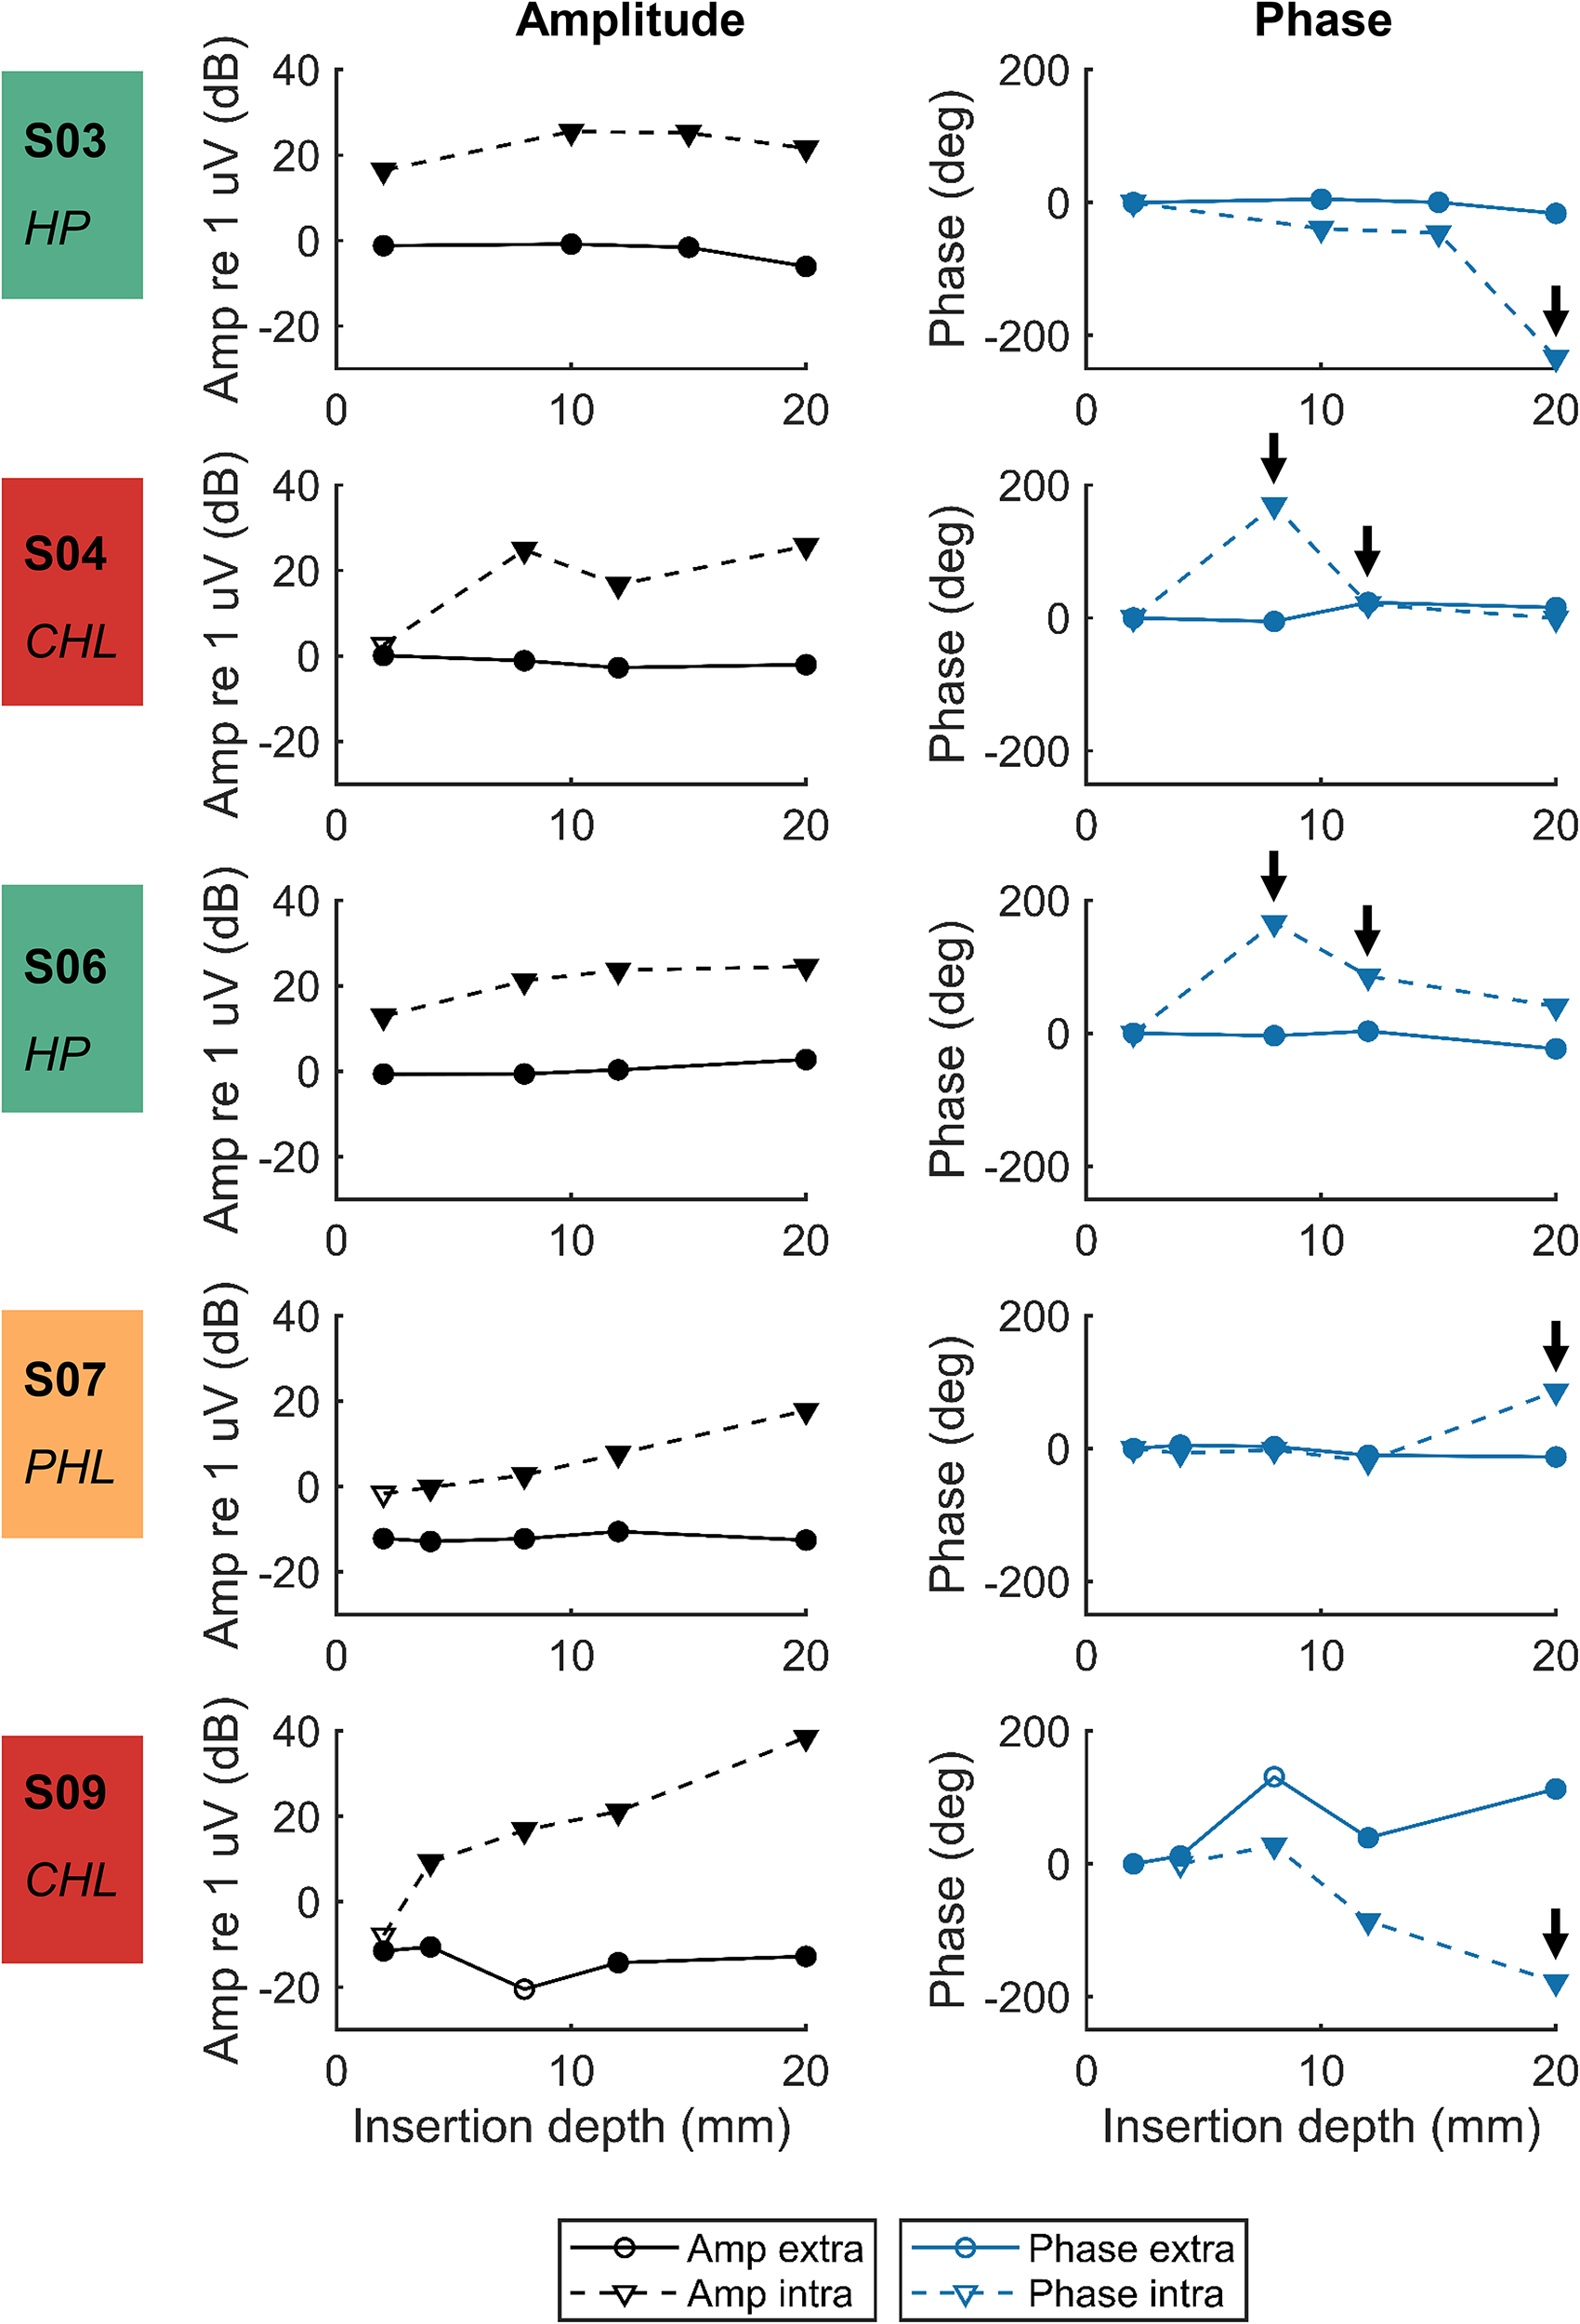
Amplitude and phase component at 500 Hz of the extracochlear and intracochlear DIF responses for cases with sudden, near 180-degree phase shifts (shown by the arrows). The phases determined are not corrected for the cycle. Measurements within the noise floor are represented by open symbols, while measurements above the noise floor are represented by filled symbols. Hearing was preserved in S03 and S06 (hearing preservation (HP), green), while it was partially lost in S07 (partial hearing loss (PHL), orange) and completely lost in S04 and S09 (complete hearing loss (CHL), red).

Amplitude and phase component at 500 Hz of the extracochlear and intracochlear DIF responses for cases with slight, gradual phase changes. The phases determined are not corrected for the cycle. Measurements within the noise floor are represented by open symbols, while measurements above the noise floor are represented by filled symbols. Hearing was partially preserved in S01, S02, and S08 (partial hearing loss (PHL), orange). Measurements of S05 and S10 were excluded because the initial recordings were within the noise floor.
Figure 6 shows the DIF and SUM response amplitudes (mean ± SD) of the continuous recordings from Oslo, London, and Zurich, plotted against insertion depth. Only recordings that were included for classification are shown. The recordings made with the SlimJ and Mid-Scala electrode arrays are shown in separate plots because the insertion depth estimations are based on the number of electrodes inserted into the cochlea; hence, they differ slightly between electrode array types. For the subjects receiving a SlimJ array who had postoperative hearing loss (n = 16, of which hearing was completely lost in four cases), the mean amplitude of the DIF and SUM response increased with increasing insertion depth. For the subjects receiving a SlimJ array in whom hearing was preserved (n = 12), the mean amplitude of the DIF responses also increased with increasing insertion depth but showed a slight decrease at full insertion. The mean amplitude of the SUM response in these subjects showed a maximum of around 8 mm insertion depth, albeit with a large standard deviation (SD), after which it slightly decreased and then stayed relatively constant. Three of the four subjects receiving a Mid-Scala electrode array had postoperative hearing loss. The ECochG responses of these subjects showed an average decrease in the DIF and SUM response amplitude around an insertion depth of 13 mm. In the subject with preserved hearing, DIF and SUM response amplitude decreases were observed halfway during insertion, with a second DIF response amplitude decrease occurring at full insertion.

DIF and SUM response amplitudes (mean ± SD) of the continuous ECochG recordings for subjects with and without hearing preservation, plotted against insertion depth. Only recordings that were included for classification are shown. ECochG=electrocochleography.
The Feature Set and the Classifiers
Exploratory analysis of the feature set suggested that the features were not discriminating well between the classes with hearing preservation and hearing loss. An example is shown in Figure 7, where features 5, 6, 9, 12, 13, and 14 are plotted against the maximum DIF response amplitude decrease (feature 4). No clear clusters of subjects with hearing preservation and hearing loss could be detected in the feature pairs shown here or in any of the other feature combinations.

Features 5, 6, 9, 12, 13, and 14 versus the maximum DIF response amplitude decrease (feature 4), for both the hearing preservation and the hearing loss class.
Table 5 shows the optimal SVM and RF model parameters found using grid search, randomized search, and Bayes optimization. Using randomized search and Bayes optimization, the optimal hyperparameter values were different each time the model was trained. The presented values for these optimization methods were obtained after training the model once and therefore represent an example model. Despite the fact that the obtained SVM parameter values were different within and between optimization methods, the kernel was always a polynomial, and the mean and standard deviation of the training f1-score were always the same, indicating that the different models had the same performance on the training set. For the RF, the three optimization methods resulted in models with different hyperparameter values and training scores, with grid search achieving the highest mean f1-score and randomized search resulting in the lowest training score.
Optimal SVM and Random Forest Model Parameters Found Using Grid Search, Randomized Search, and Bayes Optimization, as well as the Mean and SD of the Macro-f1-Scores for the Five Cross-Validation Folds Fitted Using These Hyperparameters.

SVM=support vector machine.
For the SVM training sessions reported in Figure 8, grid search arrived at the optimal model the fastest, followed by Bayes optimization. The SVM test scores (Table 6) are the same for the three optimization methods, indicating that the three different resulting models arrived at the same classification performance. The fact that different models achieve exactly the same scores is due to the small size of the test dataset. The macro-f1 test score is slightly higher than the training score, indicating that the models did not overfit to the training dataset. The precision, recall and f1-score are higher for the hearing loss class than for the hearing preservation class. Overall, the training and test scores of the tuned SVM classifier indicate that the model could not distinguish the two hearing outcome classes based on the feature set; it did not perform much better than random classification.

Maximum SVM (left) and RF (right) cross-validation f1-score for the training iterations using Bayes optimization, random search, and grid search. RF=random forest; SVM=support vector machine.
Test Scores of the Tuned SVM and Random Forest Classifiers.

SVM=support vector machine.
For the RF, both the final training scores (Figure 8) and the model performance on the test set (Table 6) differed between the three optimization methods. While the training score was highest when using grid search, the final model determined using this optimization method performed much poorer when classifying the test set, indicating overfitting. Overfitting issues were less severe for the models determined using randomized search and Bayes optimization. However, only the RF model obtained using randomized search had a test score (slightly) above 0.5, and none of the models performed well enough to confidently distinguish between classes.
Discussion
Currently, a decrease in the DIF response amplitude is the best indicator of acoustic hearing loss (Choudhury et al., 2011). Amplitude decreases can be defined as decreases with respect to the initial ECochG recording (Giardina et al., 2019) or any previous recording (Campbell et al., 2016; Koka et al., 2018; Lenarz et al., 2022; O’Leary et al., 2020; Weder et al., 2020). As the intracochlear ECochG response often increases during CI insertion before any changes in cochlear functionality occur, a decrease relative to any previous recording is the most common method to assess cochlear trauma. These relative amplitude decreases can recover later during insertion or not. Studies by Campbell et al. (2016) and Weder et al. (2020) both distinguished recovered and nonrecovered ECochG amplitude drops; while Campbell et al. (2016) observed that only nonrecovered amplitude drops were indicative of hearing loss, Weder et al. (2020) found no difference between the two groups.
In the current study, the begin-end DIF response amplitude change was negative in only 3 of 25 cases in the hearing loss group, compared to 2 of 15 cases in the hearing preservation group. A DIF response amplitude decrease between two subsequent recordings was observed in 31 of 40 cases. Recordings of 18 of 25 subjects in the hearing loss group showed such a drop, compared to 13 of 15 cases in the hearing preservation group. Therefore, neither overall nor relative DIF response amplitude decreases could distinguish between acoustic hearing loss and hearing preservation in this cohort.
Amplitude decreases in cases with hearing preservation can result from movements of the recording electrode with respect to the different signal generators (Dalbert et al., 2021; Giardina et al., 2019; Sijgers et al., 2021; Soulby et al., 2021). In the cases with hearing loss where no amplitude decreases were detected, hearing loss could have occurred after the insertion of the electrode array. For example, tissue reactions during the immediate postoperative period could have resulted in fibrotic tissue formation, or movements of the electrode array after the insertion could have caused trauma or basilar membrane fixation. In addition, it may be that relative amplitude decreases were missed due to the stepwise rather than continuous ECochG recording and analysis approach.
Previous research suggests that ECochG characteristics such as phase changes and harmonic distortion in the DIF responses and amplitude changes in the SUM response can help distinguish traumatic and atraumatic DIF response amplitude decreases (Giardina et al., 2019; Sijgers et al., 2021). However, the classification results show that the features extracted from the ECochG recordings and preoperative audiograms did not help distinguish cases with hearing preservation and hearing loss. This may be because the choice of features was suboptimal or because there was no relationship between ECochG responses recorded during electrode array insertion and postoperative hearing outcomes.
Various reasons could explain the lack of relationship between the extracted features and the preservation of acoustic hearing. First, changes in the SUM response amplitude and DIF response phase corresponding to atraumatic DIF response amplitude decreases do not necessarily occur at the exact location of the DIF response amplitude decrease (Sijgers et al., 2021). Hence, they may not be captured well by features 13 and 14. Second, features were extracted from recordings performed in relatively large steps, and distances between recording steps were not always the same. Smaller, equal steps would provide more precise information on the location and rate of ECochG response changes. Third, amplitude and phase changes may largely relate to preoperative residual hearing, rather than intraoperative trauma (Bester et al., 2020). This is supported by the simultaneous intracochlear and extracochlear ECochG recordings in the present study. Large intracochlear phase changes related to large intracochlear signal amplitudes and large amplitude differences between intracochlear and extracochlear recordings, indicating multiple populations of intact hair cells. Finally, two types of electrode arrays were used in this study. Lateral wall electrodes, such as the SlimJ electrode array, are prone to ride up and touch the basilar membrane, causing hearing loss through disruption of cochlear mechanics (Bester et al., 2022). The mechanisms of hearing loss with Mid-Scala electrode arrays likely differ, and this heterogeneity in the data may have impacted the study findings.
Many factors potentially influence ECochG recordings in CI recipients, including the populations of intact hair cells along the cochlea, the proportion of inner and outer hair cells, the combination of hair cell and neural survival, and the level of the acoustic stimuli. To account for interindividual differences, large datasets are needed, and features should be chosen carefully to capture complex relationships. Likely, continuous recordings would better capture relationships between ECochG responses and hearing outcomes, as recent studies showed that drops in DIF response amplitude observed in real-time recording did predict poorer residual hearing (Bester et al., 2021; O’Leary et al., 2020; O’Leary et al., 2023). In addition, residual hearing was likely lost in the postoperative period for part of the included subjects. These cases should be distinguished when designing future classifiers, such that the model is not trained on outcomes that do not relate to patterns in the ECochG responses. This could be done by recording ECochG responses from all intracochlear electrode contacts immediately after CI insertion and at the appointment during which postoperative audiometry is conducted. In addition, bone conduction thresholds could be recorded after cochlear implant surgery to detect immediate changes in residual hearing, as in Saoji et al. (2022).
Conclusion
In this cohort, DIF response amplitude decreases did not relate to postoperative acoustic hearing preservation. SVM and RF classifiers that were trained on features extracted from ECochG responses recorded in steps could also not distinguish cases with hearing loss and hearing preservation. Exploratory analysis of the feature set showed that the features were not discriminative between outcome classes. Likely explanations are the small dataset and the use of ECochG responses recorded in relatively large steps. Future research should therefore focus on the classification of continuous ECochG recordings, for example, using a time series classification model where temporal relationships are explicitly defined. In addition, the collection of larger datasets will be necessary to capture the complex relationships between ECochG recordings and hearing preservation outcomes. Time series classification models that work well with large datasets, such as long short-term memory neural networks, may then also result in better outcomes.
Footnotes
Declaration of Conflicting Interests
The authors declared no potential conflicts of interest with respect to the research, authorship, and/or publication of this article.
Funding
The authors disclosed receipt of the following financial support for the research, authorship, and/or publication of this article: The study was partially funded by Advanced Bionics, Stäfa, Switzerland, and InnoSuisse Grant Nr. 29547.1 IP-LS.