
Abstract
Closed-set consonant identification, measured using nonsense syllables, has been commonly used to investigate the encoding of speech cues in the human auditory system. Such tasks also evaluate the robustness of speech cues to masking from background noise and their impact on auditory-visual speech integration. However, extending the results of these studies to everyday speech communication has been a major challenge due to acoustic, phonological, lexical, contextual, and visual speech cue differences between consonants in isolated syllables and in conversational speech. In an attempt to isolate and address some of these differences, recognition of consonants spoken in multisyllabic nonsense phrases (e.g., aBaSHaGa spoken as /ɑbɑ
Researchers have often used consonant or vowel recognition experiments for studying speech processing in the human auditory system. Analysis of consonant and vowel errors caused by the presence of masking noise or by frequency filtering provides insights into the relative importance of different speech cues (e.g., Hillenbrand et al., 1995; Li et al., 2012; Miller & Nicely, 1955; Peterson & Barney, 1952; Phatak & Allen, 2007; Wang & Bilger, 1973). Phoneme recognition is commonly measured using nonsense syllables produced in isolation, which allows researchers to analyze the perception of basic speech cues without the confounding effects of linguistic information. However, the use of isolated syllables also limits the applicability of results to conversational speech communication due to several factors. First, consonant and vowel sounds produced in isolated syllables are articulated differently than those in conversational speech. When phonemes are spoken at conversational rates, the cues for consonants and vowels are altered due to coarticulation, stress, and phrasing (Picheny et al., 1986). Increasing lexical stress in English primarily results in more prolonged and more intense vocalic nuclei, that is, steady-state vowels and adjoining formant transitions (Silipo & Greenberg, 1999). Prolonged and stronger formant transitions can also improve consonant identification. In isolated nonsense syllables, which are generally mono- or bisyllabic, the syllable containing the test consonant or vowel is almost always stressed. For example, the second syllable in the /ɑCɑ/ stimuli used in the Grant and Walden (1996) study was stressed. In connected speech, not every syllable is stressed, resulting in relatively shorter and less intense formant transitions. The recognition of consonants in such unstressed syllables can be expected to be worse than that in isolated syllables, if the context information is not available. Connected syllables spoken at a faster syllable rate may not allow the speech articulators to reach the intended target positions for producing various consonants (Gay et al., 1974), resulting in coarticulation that may cause shortened, incomplete, or weaker acoustic cues.
Speaking rate alters not only the production but also the perception of consonant cues. For example, the phonetic boundaries used for perceptually segregating consonant categories vary with speaking rate (Miller & Volaitis, 1989). Second, processing the continuous flow of speech cues in a conversation may be affected more by an individual's working memory and speech processing speed, compared to phoneme recognition in isolated syllables (Baddeley, 2012). Finally, the lexical, semantic, and syntactic information in meaningful words and sentences provide speech information, even if portions of the speech signal are inaudible or masked by noise (Boothroyd & Nittrouer, 1988; Bronkhorst et al., 2002; Miller et al., 2020). Differences like these confound the translation of phoneme recognition from isolated nonsense syllables to words and from words to connected speech.
Measuring consonant confusions with connected speech stimuli, such as sentences, has several challenges. Responses to open-set sentences, especially when presented in background noise, include insertions (i.e., reporting words or phonemes that were not presented, or false starts such as “um”) and deletions (i.e., not reporting words or phonemes that were presented), which makes it extremely difficult to create a one-to-one mapping of response phonemes to stimulus phonemes that is necessary for analyzing consonant feature errors. Automatic phoneme alignment algorithms have been developed for open-set responses to sentence-length stimuli (Bernstein et al., 1994, 2021; Ratnanather et al., 2022) in order to generate consonant confusion matrices (CMs) for sentence stimuli. However, consonant feature analysis based on such CMs is confounded by the context information in meaningful words and sentences. For example, when listening to a sentence about a vehicle, if a listener hears only the first half of a monosyllabic word describing the vehicle as “va” (/væ/), the lister can recognize the word as “van” even if the last consonant sound (i.e., /n/) was not audible due to background noise or reverberation. Thus, context information can compensate for the missing speech cues, thereby confounding the interpretation of recognition scores. Even low-context sentences such as IEEE (Grant et al., 1998) or nonsense sentences (Helfer, 1997) have contextual information due to lexical constraints and morphosyntactic structure. To avoid this, some studies have used nonsense syllables or target words embedded in a carrier phrase to analyze error patterns for consonants spoken at a faster rate (Amerman & Parnell, 1981; Helfer, 1994). However, the primary focus of these studies was to measure the effect of carrier phrase, and not the effect of naturalistic consonant production in connected syllables. Measuring such effects would require comparing consonant error patterns or consonant feature transmission between nonsense syllables embedded in carrier phrases (with carrier phrase either removed or intact) and nonsense syllables spoken in isolation.
Another shortcoming of the above-mentioned studies that attempt to score and build consonant CMs from sentence stimuli is the absence of visual speech cues. In most practical situations, speech conversations are often audiovisual in nature. Visual speech cues obtained from lip reading are known to aid speech recognition in difficult communication environments that are noisy and reverberant (Sumby & Pollack, 1954). The current models of audiovisual speech cue integration that analyze complementary and redundant information extracted across spectral channels in auditory and visual modalities are all based on responses to isolated syllables (Braida, 1991; Grant et al., 2007; Massaro, 1987). Consonant CMs built from responses to isolated syllables showed that visual speech cues significantly aid the reception of place- and, to a lesser extent, manner-of-articulation cues, thereby improving overall consonant recognition scores (Grant & Walden, 1996). These results may not be applicable to consonants in connected syllables spoken at a faster rate, because the consonant feature transmission probabilities in audio and visual modalities for such stimuli are different from those for isolated syllables. Specifically, articulators like the jaw, lips, tongue etc. that are visible to the listener do not reach the intended target positions when speaking at a faster rate (Gay et al., 1974), which may reduce the place-of-articulation information in visual speech cues, and their overall contribution to audiovisual consonant recognition. Furthermore, the integration of auditory and visual speech cues, which is considered to occur over an asymmetric temporal integration window of about 200 ms (Van Wassenhove et al., 2007), may be affected by the rate at which consonants are heard and processed in the auditory system. This limits the applicability of these models to conversational speech communication. There is very little published literature about audiovisual consonant confusions when spoken in a series of connected syllables produced at a conversational rate. Therefore, extending the audiovisual speech cue integration models to connected speech requires consonant CMs measured in both modalities using connected syllables spoken at a conversational rate.
The current study is an attempt to partially bridge the gap between phoneme perception in isolated syllables and connected speech by measuring recognition of consonants spoken at a conversational rate in multisyllabic nonsense phrases. For this purpose, audiovisual recordings of multisyllabic phrases were used as stimuli in this study. Each phrase consisted of four syllables that contained three consonants separated by the vowel /ɑ/, for example, aBaSHaGa spoken as /ɑbɑʃɑɡɑ/. The fixed phonetic structure in these syllables provided a “sub-lexical” context to the listener, which was necessary to avoid insertion and deletion errors. This is true for any closed-set phoneme recognition study that measures confusion errors. But these multisyllabic phrases were missing the linguistic cues that are present in meaningful words and sentences (e.g., lexical constraint, semantic, morphological context, and situational context). Moreover, the probability of phoneme occurrence was uniform across all consonant sounds in these phrases, unlike real words and phrases in English, where certain consonant or vowel sounds, or certain combinations of those, are more likely to occur than others in certain positions (Fletcher, 1995; Hayden, 1950; Mines et al., 1978). However, these nonsense phrases, spoken at a rate of about 3.6 syllables/s, were expected to be similar to real words or phrases in terms of syllabic duration, coarticulation, intonation, stress, and prosody. Thus, these phrases would be “word-like” in the acoustic sense, but not in the linguistic sense.
Figure 1 schematizes the properties of different speech stimuli, from isolated syllables to conversational speech, that are expected to influence consonant perception. As mentioned above, producing connected syllables at a faster rate in nonsense or meaningful words or phrases changes the stress patterns and pitch contours. It also results in increased coarticulation and degradation of consonant cues. These acoustic changes to the speech signal should reduce overall consonant intelligibility. At the same time, lexical properties and morphological rules that apply to meaningful words provide context that should increase consonant intelligibility. Additional acoustic and linguistic changes occur when meaningful words are spoken together to form sentences or when sentences are spoken together in a conversation. Generally, the improvement in scores due to context information is much greater than the reduction in scores due to acoustic changes, resulting in higher recognition scores for sentences compared to words, and for meaningful words compared to nonsense syllables (ANSI, 1997; French & Steinberg, 1947). The multisyllabic nonsense phrases used in the current study thus allow us to isolate the effects of acoustic change on consonant recognition in naturalistic speech while controlling for linguistic cues that occur in meaningful words or phrases. Compared to isolated syllables, consonants in these multisyllabic phrases would have the degrading effect of acoustic changes, without the benefit of linguistic information in real words and phrases. Moreover, processing multiple phonemes in a sequence could lead to an increase in working memory load, further reducing consonant recognition scores in connected syllables, compared to isolated syllables. Therefore, we hypothesized that consonant recognition performance with these multisyllabic nonsense phrases would be worse than that with isolated syllables.
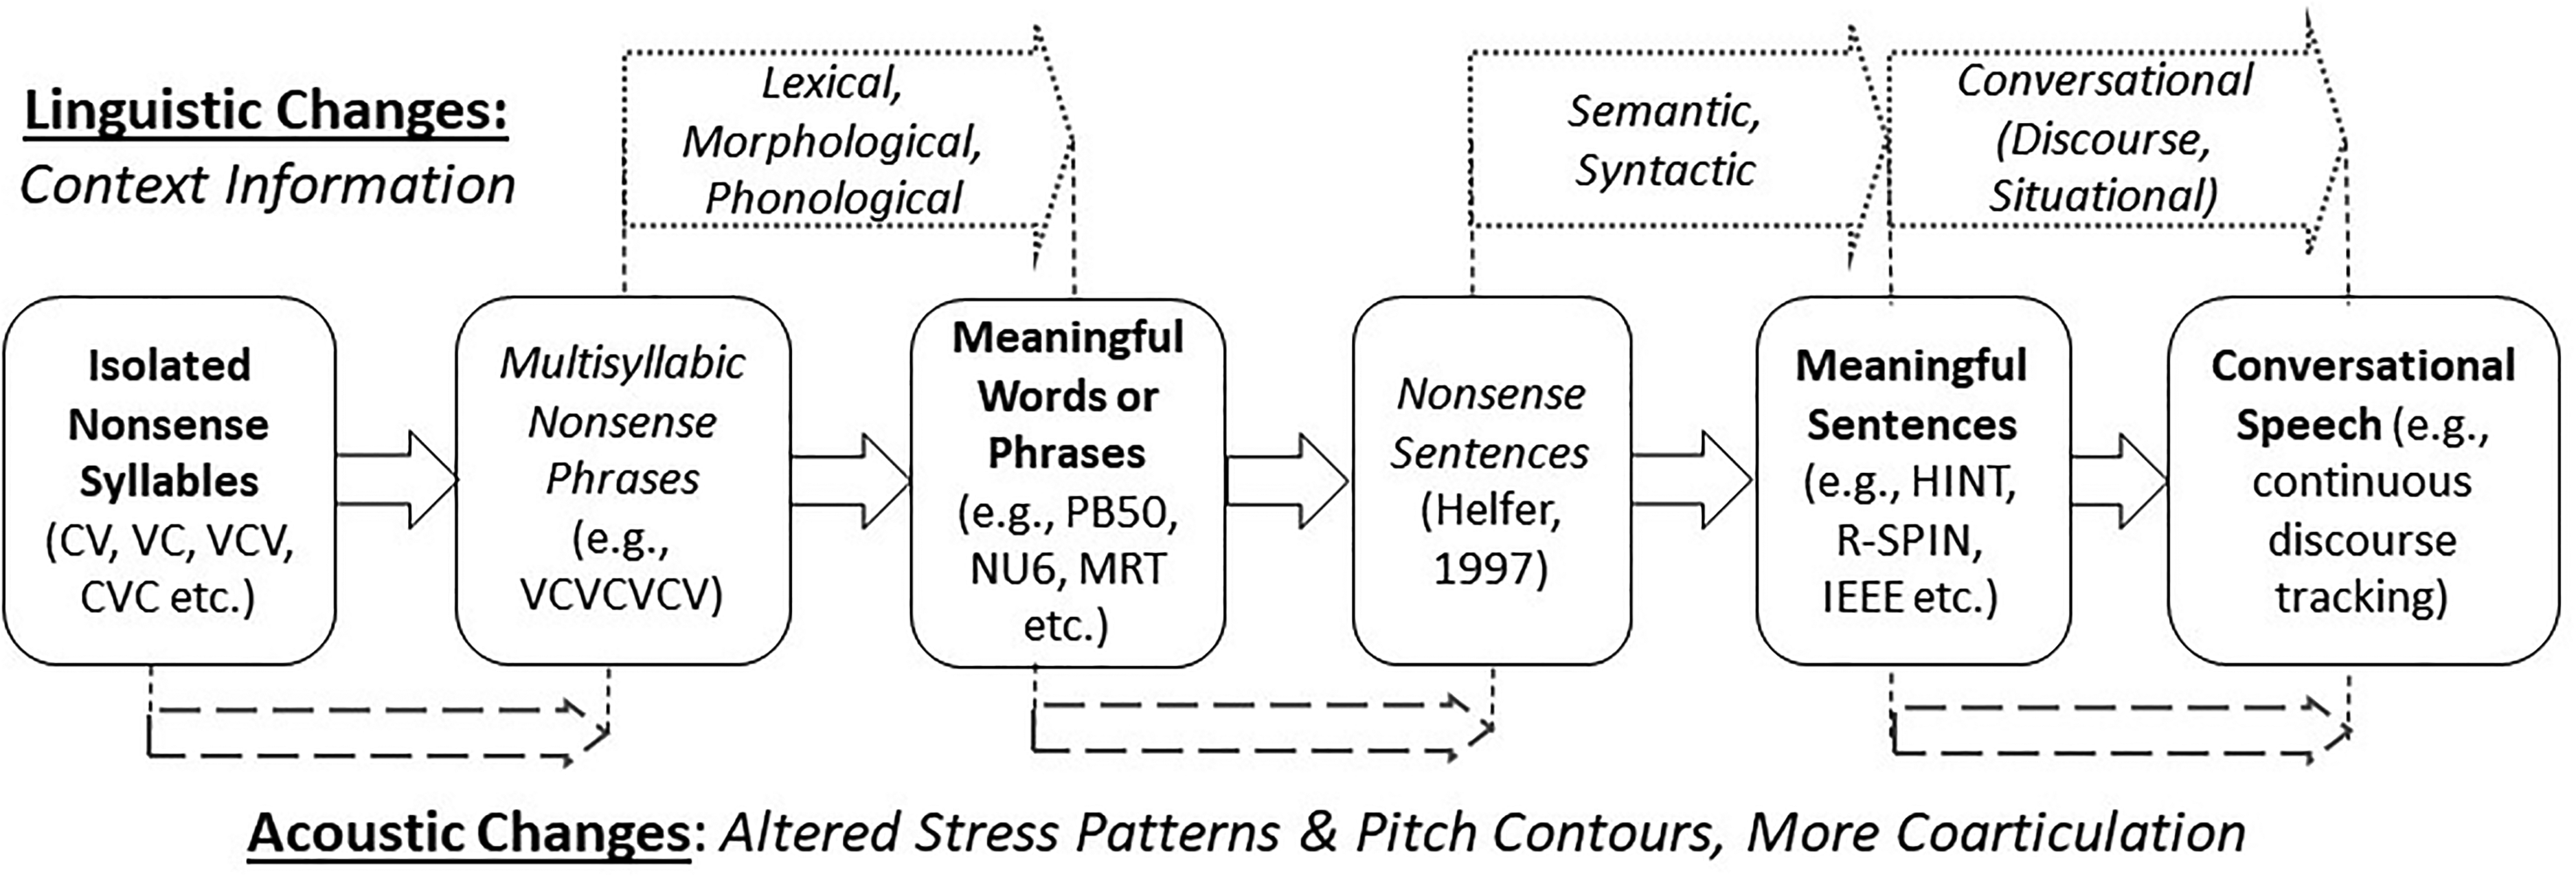
Conceptual illustration of acoustic and linguistic properties of various speech stimuli, starting from isolated nonsense syllables to conversational speech, that are expected to influence consonant perception. The location of arrows below and above the boxes indicate the stages where acoustic and linguistic properties change, respectively, between stimulus types. C: consonant; V: vowel; PB50: phonetically balanced list of 50 words; NU6: Northwestern University word lists; MRT: modified rhyme test; HINT: hearing in noise test; R-SPIN: revised speech in noise test; IEEE: Institute of Electrical and Electronics Engineers sentences (Harvard sentences).
In the current study, recognition performance was estimated using a modified version of the asymmetric step-size adaptive tracking method proposed by Kaernbach (1991). The modification allowed simultaneous measurement of the signal-to-noise ratio (SNR) corresponding to 70% recognition performance and the local slope of the score-SNR function at that performance level. The SNR threshold indicates consonant recognition robustness in background noise, that is, how much noise can be tolerated while achieving 70% recognition, whereas the slope indicates sensitivity to background noise, that is, how much a small change in background noise level affects recognition performance. Participant responses were used to build consonant CMs, which were then used to estimate transmission probabilities of the three articulatory features, viz., voicing, place, and manner of articulation.
To analyze the effect of producing consonants in a sequence at a conversational rate, the performance metrics (i.e., SNR and slope) and the feature transmission probabilities measured in this study were compared with those measured using isolated syllables in the Grant and Walden (1996) study (GW96). Differences in stimuli spectra across the two studies were accounted for by converting SNRs to the Speech Intelligibility Index (SII) (ANSI, 1997). The GW96 study measured closed-set consonant recognition by 12 subjects with normal-hearing thresholds (all audiometric thresholds ≤ 20 dB HL, 18–50 years old) using /ɑ/C/ɑ/ syllables with 18 different consonants. This study was chosen for comparison for several reasons. First, GW96 speech stimuli had the consonant in the medial position between two /ɑ/ vowels, which was identical to the consonant-vowel environment in the current study. Second, GW96 measured consonant recognition in audio-only (AO), video-only (VO), and audiovisual (AV) modalities. Third, GW96 measured psychometric curves for consonant recognition, which allowed us to estimate both performance metrics (i.e., SNR and slope at 70% recognition). Fourth, GW96 measured consonant CMs at about 70% recognition scores in both AO (69.92% at −6.37 dB SNR) and AV (69.86% at −12.3 dB SNR) modalities. Finally, the speech and masker stimuli from GW96 were readily available for the SII analysis.
While it was expected that the overall recognition of consonants spoken in sequences at a conversational rate would be degraded compared to those in isolated syllables, degradation might also differ across consonants or across consonant categories because of differences in the spectrotemporal characteristics of various consonant cues. For example, Phatak and Grant (2019) found that locally time reversing the speech signal, which causes a predominantly temporal distortion, degrades the recognition of plosives, non-sibilant fricatives, and affricates more than sibilant fricatives or nasals. Increasing the speech rate has also been shown to degrade the recognition performance of plosives (Agwuele et al., 2008; Amerman & Parnell, 1981). Therefore, we hypothesized that consonants that rely heavily on temporally dynamic speech cues (e.g., voice-onset time, formant transitions, envelope rise time, etc.) would be affected most in consonant sequences produced at conversational syllabic rates. To test this hypothesis, individual consonant scores and consonant confusion errors were analyzed, and compared with those for isolated syllables measured in the Grant and Walden (1996) study.
To evaluate the benefit of visual information in connected syllables, consonant feature transmission was measured separately in both AO and AV modalities. An earlier pilot experiment 1 provided the information transmitted and received in the VO modality. Connected syllables spoken at a faster rate may not allow the articulators to reach the intended target positions for producing various consonants (Gay et al., 1974), resulting in poorer auditory and visual place cues in sequenced syllables. Therefore, we hypothesized that the place-of-articulation feature transmission would be degraded in the auditory-visual modality for sequenced syllables compared to that for isolated syllables.
The results of this study are expected to provide insights into how consonant cues are perceived by eye (e.g., speechreading) and by ear when the consonants are presented in a sequence of syllables spoken at a conversational rate. Such information may be helpful in not only designing speech enhancement strategies for automatic speech recognition and hearing prostheses, but also in improving models that translate phoneme recognition scores to word recognition scores or sentence recognition scores (Boothroyd & Nittrouer, 1988; Bronkhorst et al., 2002; Miller et al., 2020). Current models use phoneme recognition scores measured using isolated syllables or words as the baseline, and therefore may be underestimating the benefit of context when considering the role of phoneme recognition in understanding connected speech. As depicted in Figure 1, these models may be measuring a combined effect of an increase in performance due to contextual cues, and a decrease in performance due to degraded articulation and perception caused by the faster rate of production. The use of phoneme recognition scores produced at a conversational syllabic rate as the baseline may provide a more accurate estimate of the benefit of word- and sentence-level context.
Methods
Subjects
Fourteen normal-hearing subjects (seven males) in the age range of 20 to 59 years (mean and one standard deviation of 31.9 ± 12 years) completed the experiment. All but one subject had normal hearing (thresholds ≤ 20 dB HL for audiometric frequencies from 250 Hz to 8 kHz). One listener had thresholds of 30 dB HL at 8 kHz in both ears, but had all other thresholds (up to 6 kHz) ≤ 15 dB HL, and was therefore retained in the study. All subjects signed consent forms as approved by the Walter Reed National Military Medical Center's Institutional Review Board.
Stimuli
Consonant stimuli consisted of audiovisual recordings of sequences of three consonants preceded and followed by the vowel /ɑ/, spoken by a male talker at a rate of about 3.6 syllables/s. Consonant sequence tokens were in the format /ɑ/C/ɑ/C/ɑ/C/ɑ/, where each C was one of 16 consonants (/b/, /d/, /ɡ/, /v/, /z/, /ʒ/, /p/, /k/, /t/, /f/, /s/, /ʃ/, /m/, /n/, /ʧ/, /ʤ/). These 16 consonants were labeled as B, D, G, V, Z, ZH, P, K, T, F, S, SH, M, N, CH, and J, respectively, when depicted visually on the computer screen. A total of 416 tokens were available, such that each consonant appeared approximately equal number of times in each of the three positions. 2
The masker was a random noise that was spectrally shaped to match the average spectrum estimated over the three consonant regions of all sequence tokens. The third syllable (i.e., the second consonant and the following vowel) in these recordings was stressed, resulting in a systematic and consistent level variation across syllables in every token. A masker with a constant level would result in a difference in the SNR across the three consonants in a sequence token, providing relatively less masking to the second consonant sound. To achieve a relatively constant SNR across consonant positions, the masking noise level was varied across syllables as follows. First, the start and the end of all three consonants in each token were marked by a research team member using the spectrogram and amplitude envelopes of that token. These markings were then verified by two other team members. These markings divided each token into seven regions, that is, three consonant regions (C1, C2, C3) and four vowel regions (V1, V2, V3, V4). Formant transitions between consonants and vowels, which are important perceptual cues for many consonants, were included in the respective consonant regions for the purpose of this study. Following the demarcation of consonant and vowel regions, the root-mean-square (rms) level of the masking noise was adjusted to locally match the rms in the seven regions with a 10 ms linear transition band between rms levels of consecutive regions. Thus, a matched masking noise was pre-generated for each speech token that was intended to minimize the variation in consonant intelligibility due to different levels of C1, C2 and C3. Minimizing the effect of consonant position would allow pooling data across the three consonant positions in order to build CMs with enough row-sums to reliably estimate consonant errors and consonant feature transmission scores.
Figure 2 shows waveforms of a single token (aZHaMaTa) and the corresponding noise masker. Black dashed lines indicate rms values in the seven temporal regions. Masking noise started 100 ms before the onset of V1 and ended 100 ms after the offset of V4. The envelope of the masker was deliberately chosen to coarsely match the speech envelope (i.e., in seven steps) to ensure that the masking noise envelope, when combined with the visual speech cues in the AV modality, would not contribute to speech intelligibility (Grant et al., 1985). The target speech was set at 65 dB SPL, and the masker level was controlled as per the tracking rule.
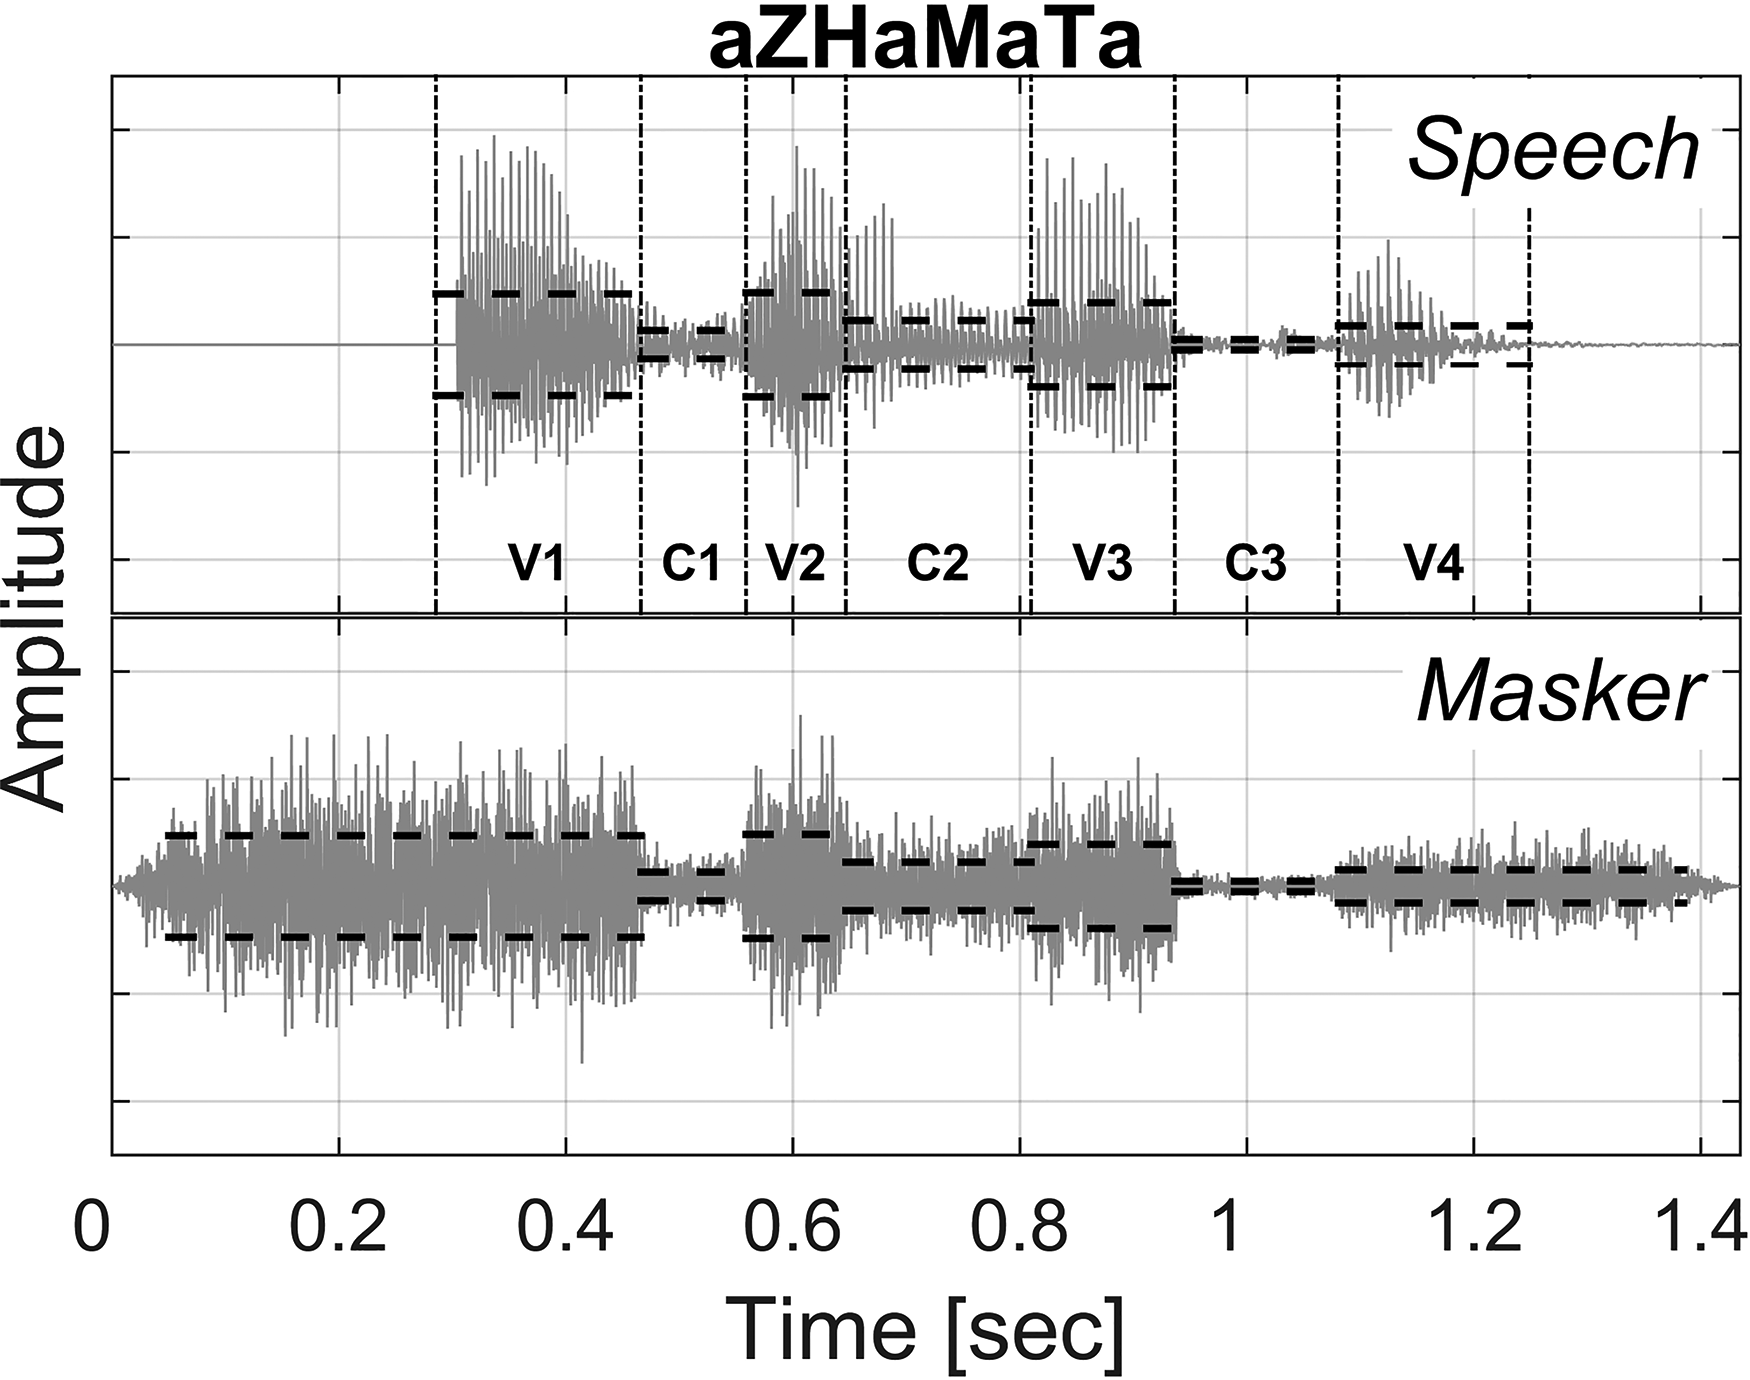
Waveforms of the consonant sequence token aZHaMaTa (top) and the corresponding noise masker (bottom). Black dashed lines denote the local root-mean-square levels in the four vowel (V1, V2, V3, V4) and the three consonant (C1, C2, C3) regions.
Procedure
Adaptive tracking using a transformed up-down staircase method (i.e., M-up, N-down) is commonly used to estimate levels or SNRs corresponding to different performance points on the psychometric function (Levitt, 1971). Estimating an arbitrary performance point can require large M and N values, which can increase the measurement time multifold. To overcome this issue, Kaernbach (1991) suggested a weighted 1-up, 1-down tracking method that could quickly converge to any desired point on the psychometric function. This method uses different up- and down-steps, and the ratio of the two step sizes determines the performance point to be tracked. The asymmetric step sizes achieve a probabilistic equilibrium at the tracked performance point (Zwislocki & Relkin, 2001). Asymmetrical step sizes also result in less fluctuation around the tracked point than the conventional up-down methods that have symmetric step sizes (García-Pérez, 2011). As any performance point can be tracked using 1-up, 1-down tracking, the time required for estimating any arbitrary point on the psychometric function takes the same time with this method. A modified version of this tracking methodology was used to simultaneously measure the SNR at 70% performance point (i.e., SRT70) and the local slope of the psychometric function at the 70% point (i.e., Slope70) for each subject in each modality.
Pilot testing revealed that identifying three consonants and holding those in memory in the correct order during the time needed to make three separate consonant responses was very challenging, and resulted in a significant cognitive load. This introduced a potential confound of working memory in interpreting experimental results. To address this, listeners were asked to identify only one of the three consonants, while the other two consonants were depicted visually on screen in their respective positions in the token. The visual display appeared as soon as the token ended. For example, after completing the playback of token aZHaMaTa, the screen would display a?aMaTa or aZHa?aTa or aZHaMa?a, and prompted the listener to fill in the question-mark with one of the 16 consonant options displayed on the screen. The order of missing consonant position was randomized across presentations and was not revealed until after the playback. Thus, the listeners were required to listen to the entire syllable sequence, identify and remember the missing consonant, and then provide a single response.
In each modality (i.e., AO or AV), 18 tokens (6 per consonant position in randomized order) were initially presented without any masking noise to familiarize the listeners with the speech stimuli in that modality. If a subject made more than two errors in these familiarization trials, then 18 more no-noise trials were presented to the subject in that modality; otherwise, the subject was allowed to proceed. This was followed by 60 trials (20 per consonant position in randomized order), where tokens were presented with the corresponding masker at varying SNR. The SNR was tracked independent of the consonant position, that is, the SNR on the current trial was based on the SNR of the previous trial and the response to that trial, but not on the position or identity of the target consonant in the previous trial. Step sizes in this phase were +7 and −3 dB, that is, the SNR was increased by 7 dB after an incorrect response and decreased by 3 dB after a correct response. The purpose of this phase was to reach an SNR close to the final SRT70 in as few trials as possible. Pilot data indicated that at the end of these 78 trials (18 + 60), the tracked SNR was indeed very close to the final SRT70 value.
After this point, there were three changes in the tracking methodology. First, the SNR was tracked separately for each consonant position to account for possible differences due to serial position (Deese & Kaufman, 1957). Second, up and down step sizes were reduced from their initial values of +7 dB and −3 dB to +1.75 dB and −0.75 dB, respectively. Third, instead of presenting a token at the intended SNR, two tokens were presented, one 3 dB above and the other 3 dB below the intended SNR, on two consecutive trials for the same consonant position. This particular modification was done in order to obtain a slope around the 70% point (i.e., Slope70) in addition to the SRT70. The order of the two SNRs (i.e., +3 dB then −3 dB, or −3 dB then +3 dB) was randomly selected. If responses at both SNRs were incorrect, then the SNR was increased by 1.75 dB, and if both responses were correct, the SNR was decreased by 0.75 dB. If only one of the two responses was correct, then there was no change in the SNR for the next trial for that consonant position. There were 312 such trials in each track (104 trials per position, 52 at SNR + 3 dB and 52 at SNR-3 dB). A total of 390 trials per modality (18 + 60 + 312) were divided in five blocks of 78 trials each. Thus, a listener was presented with a total of 10 blocks (2 modalities × 5 blocks) and the block order was randomized over the two modalities.
It was expected that SRT70 in the AV modality would be lower than that in the AO modality due to the benefit of visual speech cues. This SNR-difference in the two SRTs is a confounding factor in comparing consonant feature transmission across the two modalities. To eliminate this confounding factor, consonant recognition was also measured subsequently on a subset of five subjects in the AO modality at a fixed SNR of −9.54 dB, which was the average AV SRT70 obtained using the above tracking method.
Analysis
Tracking SNRs independently for each consonant position allowed the estimation of Slope70 and SRT70 by position. This resulted in three interleaved tracks for the three consonant positions, as shown in Figure 3. Typically, all tracks were very close to their asymptotic value by the end of the first 78-trial block. The average standard deviation in the SNR track within a block reduced from 7.17 dB in the first block to 3.69 dB in the second block and remained at or below 3.6 dB for the next three blocks. Therefore, SRT70 and Slope70 in each modality were estimated from responses in the last two blocks of that modality. The average SNR for all trials for a given consonant position in those two blocks was taken as the SRT70 for that consonant position in that modality. To estimate Slope70, the percentage correct responses were calculated separately for all +3 dB and for all −3 dB trials from the last two blocks. The Slope70, in %/dB units, was then defined as the difference between these two scores divided by 6 dB.

A typical SNR track for a single subject for each consonant position in both audio-only (AO) and audiovisual (AV) modalities. Numbers on the x-axis indicate the number of completed trials at the end of each of the five blocks. The line type and the shade of gray indicate the three consonant positions (C1, C2, and C3).
To analyze consonant errors at 70% recognition performance, responses of all subjects from the last two blocks were pooled to generate CMs and quantitatively compared across the two modalities in terms of unconditional information transmission probabilities (Miller & Nicely, 1955) for overall information received, as well as for the three articulatory features, viz., voicing, place of articulation, and manner of articulation. The categories of these three features and consonants in each category are listed in Table 1. This information transmission was compared with that for isolated syllables from GW96, which had two additional consonants (/θ/ and /ð/), and therefore had a different amount of information transmitted for each feature. To account for this difference, the information received for each feature (in bits) was normalized by dividing it with the amount of information transmitted for that feature (in bits) in the respective study. This ratio, which indicated the average percentage of the sent feature information that was received by subjects, was labeled as the relative feature reception.
Categories of Consonant Articulatory Features (i.e., Voicing, Manner, and Place) Used for Information Transmission Analysis and the Consonants in Each Category.

Results
Effect of Consonant Position and Visual Cues
Figure 4 shows average recognition scores estimated from subject responses for −3 dB and +3 dB tracks, and the average of the two, that is, at SRT70. The two tracks estimated SNRs for performance scores of approximately 60% and 80%, respectively, independent of the consonant position or modality. The average of these two tracks was very close to the intended recognition performance of 70%, with a standard deviation of ≤ 2 percentage points. An analysis of variance (ANOVA) indicated that there was no significant main effect of consonant position [F(2,26) = 0.25, p = .779] or modality [F(1,13) = 1.66, p = .221] on consonant recognition scores, and the interaction between those two was also not significant [F(2,26) = 0.37, p = .692]. 3 This indicated that the time-varying masker level helped offset the effect of level variation across consonant positions, resulting in roughly uniform SNR throughout the sequence token, and therefore, uniform intelligibility across consonant positions.

Distribution of recognition scores estimated from subject responses for −3 dB and +3 dB tracks, and the average (Avg) of the two, that is, at SRT70, for the three consonant positions (C1, C2, C3) in both modalities (AO and AV). The horizontal dashed line denotes 70% recognition accuracy. Top and bottom edges of each box indicate 75th and 25th percentile values, respectively. The center and the width of a notch indicate the median and the 95% confidence interval, respectively. Whiskers show the range of data points that are not considered as outliers, and outliers are depicted by + symbol.
Figure 5 shows SRT70 and Slope70 as a function of consonant position in both modalities. An ANOVA showed a significant main effect of the modality on SRT70 [F(1,13) = 175.00, p < .001, η2 = 0.14], with an average improvement of about 5 dB due to visual cues, and a significant but weak effect of modality on Slope70 [F(1,13) = 12.08, p = .004, η2 = 0.02], with relatively shallower slopes in the AV modality. Consonant position had no significant main effect on SRT70 [F(2,26) = 0.06, p = .955], or Slope70 [F(2,26) = 1.36, p = .275], and no significant interaction with modality. 4 Therefore, data were averaged across the three consonant positions for all further analyses.

Distribution of SRT70 (top) and Slope70 (bottom) values as a function of consonant position in auditory (AO) and audiovisual (AV) modalities. The top and bottom edges of each box indicate 75th and 25th percentile values, respectively. The center and the width of a notch indicate the median and the 95% confidence interval, respectively. Whiskers show the range of data points that are not considered as outliers, and outliers are depicted by+ symbol.
Consonant Feature Reception
Figure 6A compares the relative feature reception across the two modalities at the same recognition score of 70%, that is, at SRT70 in the respective modality. The overall relative feature reception was nearly identical across the two modalities, which was expected, but the manner-of-articulation reception was also, unexpectedly, identical across modalities. Visual speech cues increased the reception of place of articulation by 24 percentage points (pp), but decreased the reception of voicing by 19 pp. Obviously, these differences were not just because of visual cues, but also because of different SNRs (AO SRT70 = −4.12 dB and AV SRT70 = −9.54 dB). To measure the benefit of visual cues to the consonant feature reception without the confounding effect of SNR, the above AV feature reception scores were compared with the AO feature reception scores at the fixed SNR of −9.54 dB. This comparison, illustrated in Figure 6B, shows that the benefit of visual cues was highest for place of articulation (58 pp), followed by that for manner of articulation (30 pp), and relatively negligible for voicing (<8 pp), resulting in about 32 pp improvement in the overall feature reception. This hierarchy of the contribution of visual cues to various consonant features was qualitatively consistent with that observed in isolated syllables (GW96).
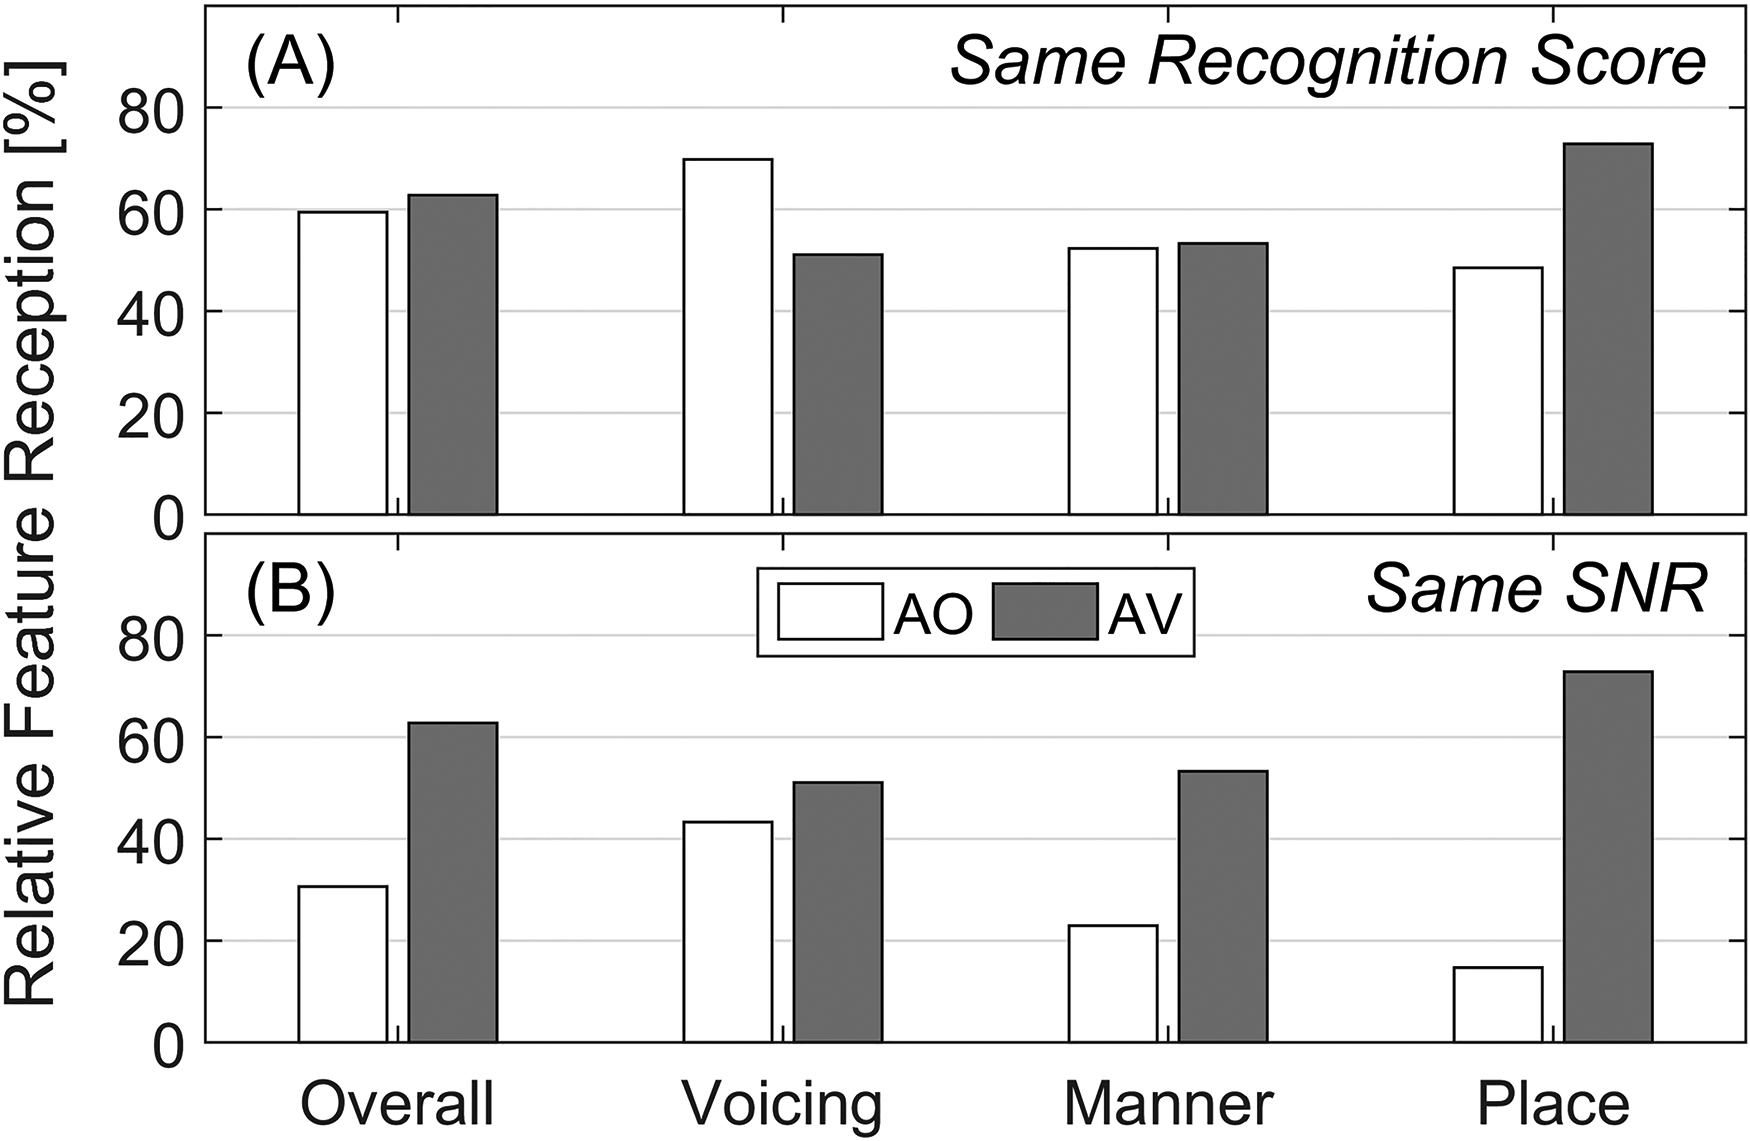
Unconditional relative information reception, that is, the ratio (in percentage) of information received (in bits) to the information sent (in bits), for consonant features—overall [O], voicing [V], manner [M], and place [P] in AO and AV modalities, at (A) equal recognition score of about 70%, and (B) equal signal-to-noise ratio [SNR] of about −9.54 dB.
Comparison With Isolated Syllables
Threshold and Slope
To understand the effect of speaking consonants in a sequence (at a conversational rate) on consonant recognition, SRT70 and Slope70 in this study were compared with those measured using isolated syllables in GW96. Figure 7 left panels compare SRT70 (top) and Slope70 (bottom) for consonants in sequenced syllables (current study) and in isolated syllables (GW96). Both studies showed a clear and comparable AV advantage (5.42 dB for sequenced syllables and 5.93 dB for isolated syllables). However, single-sample hypothesis testing indicated that the SRT70 for sequenced syllables were significantly worse than those for isolated syllables in both modalities (p = .001 for both AO and AV). The slopes were not significantly different across the two studies in the AO modality (p = .739), but were slightly shallower for sequenced syllables in the AV modality (p = .015).

Comparison of SRT70 (top) and Slope70 (bottom) values for normal-hearing subjects between the current study (sequenced) and those from the isolated syllables from Grant and Walden (1996) study (isolated). Left panels compare values on the SNR scale while those on the right are calculated on the Speech Intelligibility Index (SII) scale. Bar heights and error bars represent mean and ±1 standard deviation across all normal-hearing subjects. Individual subject data and therefore the standard deviations were not available for GW96.
These differences across the two studies could be partially due to differences in the target and the masker spectra, and could be explained by models of speech intelligibility such as the articulation index (Phatak et al., 2008; Phatak & Allen, 2007). Therefore, SNRs in the two studies were converted to the SII, which is a standardized version of the articulation index (ANSI, 1997). Right panels in Figure 7, which compare SRT70 in SII units (top) and Slope70 in %/SII units (bottom) across the two studies, indicate that the differences between the two studies were even greater on the SII scale, and were statistically significant in both modalities (p < 1 × 10⁻⁴).
Consonant Feature Reception
To understand the differences in the feature reception for consonants in sequenced versus isolated syllables, consonant feature receptions from the current study (Figure 6) were compared to those estimated for isolated syllables using GW96 data at approximately equal SII values. As per the SII analysis, an SNR of −9.54 dB in the current study was equivalent to an SNR of −7.6 dB in the GW96 study. Because −7.6 dB SNR was not used in the GW96 study, the CM at −7.6 dB was estimated by averaging data at the two adjoining SNRs, viz, −8.3 and −6.37 dB, which average to about −7.33 dB. The raw CMs from both studies in both modalities can be found in the online supplemental materials.
Figure 8 compares the relative feature reception estimates for consonants in sequenced and isolated syllables in each modality at approximately the same SII. The overall information reception for isolated syllables (GW96) was higher than that for sequenced syllables by 32 pp in AO and by 25 pp in AV modality. This difference was primarily due to higher feature reception for place and manner of articulation (about 36–38 pp) in both modalities. The slightly lower difference in the place feature reception, that is, about 24 pp, in the AV modality was likely due to a ceiling effect. This ceiling effect also did not allow an accurate estimation of the benefit of visual cues to place-of-articulation reception for consonants in isolated syllables, but the benefit to the manner-of-articulation reception was comparable across the two studies (30.3 pp and 31.2 pp for sequences and isolated syllables, respectively). Therefore, it is likely that the benefit of visual cues to place of articulation in sequenced syllables would also be comparable to that in isolated syllables in the absence of any ceiling or floor effect. In contrast, the difference in voicing feature reception between sequenced and isolated syllables was relatively small (<10 pp in both modalities), and as expected, there was negligible benefit (<10 pp) of visual cues to voicing feature reception in both studies.

A comparison of the relative feature reception for consonant features (overall [O], voicing [V], manner [M], and place [P]) for sequenced and isolated syllables, measured at approximately equal SII in both modalities (AO and AV). Feature scores for sequenced syllables were from the current study data at −9.54 dB SNR, while that for the isolated syllables were from Grant and Walden (1996) study at an estimated SNR of −7.33 dB.
Consonant Error Patterns
To understand how the reduction in manner- and place-of-articulation feature reception translates to recognition scores, CMs in the AO modality were compared across the two studies. Figures 9A and 9B show the two row-normalized CMs, that is, each row was divided by the row sum and multiplied by 100 to convert the numbers to percentages. Thus, each cell of the matrix represents the percentage of times the presented consonant was either recognized correctly (diagonal cell) or confused with another consonant (off-diagonal cell). Figure 9C shows the difference of the two matrices with black color indicating an increase of 25 pp or more and the white color representing no difference or a reduction (i.e., difference of ≤0 pp). This matrix difference indicated an increase in place- and manner-of-articulation errors, within the same voicing category, shown by areas with dashed edges. The manner errors between nonnasal voiced consonants (spanning B to J) and the two nasals were asymmetrical and biased toward the nasal consonants. Noticeable increase in place errors for plosives (P-T-K, B-D-G) and sibilant fricatives (S-SH and Z-ZH) were observed, within the same voicing and manner category. As shown in Figure 9D, these increases in manner and place errors resulted in a reduction of ≥20 pp in scores for plosives P, T, B, D, for sibilant fricatives S, SH, Z, ZH, and for affricates CH and J, when spoken in a sequence relative to those in isolated syllables. For the other four plosives and the two nasals, there was little (10–20 pp) or no reduction in scores.

A comparison of consonant error patterns at approximately equal SII in ao modality. (A) CM for the sequenced consonant at −9.54 dB SNR from the current study. Rows and columns represent presented consonants and consonant responses, respectively. (B) CM for consonants in isolated syllables estimated at about −7.33 dB SNR from the Grant and Walden (1996) study. Columns and rows corresponding to the consonants /θ/ and /ð/ are not plotted. (C) Difference of the two CMs, depicting the increase in consonant errors (in percentage points, or pp) for sequenced consonants relative to the consonant in isolated syllables. Areas with dashed edges indicate increases in place- and manner-of-articulation errors within the same voicing class. (D) Comparison of recognition scores of individual consonants in the two studies, plotted in decreasing order of the difference in scores between sequenced and isolated syllables. Consonants are depicted in all panels by their on-screen labels used in this study (see Stimuli section).
A similar comparison in the AV modality (figure not shown) revealed a reduction of ≥20 pp in the recognition scores of plosives D and T, sibilant fricatives S, SH, Z, and ZH, and affricates CH and J. The reduction for D and T scores in sequenced syllables was primarily due to an increase in place and manner errors with fricatives and affricates within the corresponding voicing category, whereas the score reduction for the four fricatives and the two affricates was due to all three types of errors (i.e., place, manner, and voicing).
Discussion
Summary and Implications
This study measured the recognition of consonants in nonsense, multisyllabic phrases (three consonants per phrase), spoken at a conversational syllabic rate. These speech stimuli were devoid of lexical, semantic, syntactic, and morphological context, while preserving natural coarticulation and syllable presentation rates comparable to those seen in conversational speech. An asymmetric step-size adaptive tracking was used to measure the SNR at 70% recognition performance and the local slope of the performance-SNR curve. Because the primary purpose of this study was to measure the effect of speaking connected syllables at a faster speaking rate on consonant perception, measures were taken to minimize the effects of other confounding factors. For example, participants were asked to report only one of three consonants to reduce working memory load. The subject would still have experienced a memory load while remembering the three consonants up to the end of stimulus playback when the token was displayed on the screen. This working memory load would not be present while recognizing a single consonant from isolated syllables, such as in the Grant and Walden (1996) study. However, this load was significantly lower than what would be required to identify and report all three consonants and was low enough to avoid any recency or latency effect. Another measure was to coarsely match the level of the masking noise to the target phrase, to avoid the effect of level variations between consonant positions. These measures helped to ensure that there was no significant effect of consonant position on the tracked recognition performance (Figure 4), threshold, and slope (Figure 5). This allowed averaging data across consonant positions to build CMs with sufficient row-sums and statistical power.
Consonant recognition in sequenced syllables from the current study was compared with that in isolated syllables from the Grant and Walden (1996) study. Differences in speech and masker spectra across the two studies were accounted for by converting SNR to SII units. Relatively higher SRT70 values and shallower slopes (i.e., slower rate of increase in intelligibility with SII) for sequenced syllable (Figure 7) indicate that recognizing consonants in connected syllables is more difficult, as expected, than recognizing consonants in isolated syllables. This supports our first hypothesis. Moreover, the benefit afforded by improvements in SNR (i.e., slope in percent correct per SII unit) is less for sequenced syllables than for isolated syllables. These results suggest that the models of translating phoneme scores to word or sentence scores may be indeed underestimating the benefit of semantic and syntactic context in conversational speech. The use of connected syllable stimuli, such as those used in this study, may provide a better characterization of consonant recognition and consonant feature reception in connected speech. This could lead to a more accurate estimate of the benefit of word- and sentence-level context.
A comparison of consonant feature reception across the two studies showed that the greater difficulty in perceiving consonants in sequenced syllables was primarily due to poorer place- and manner-of-articulation information reception (Figure 8). Overall, the benefit of visual cues seems to be comparable for consonants in sequenced or isolated syllables. However, the benefit of visual cues to place-of-articulation information for isolated syllables is likely to be underestimated due to the ceiling effect. This is because the relative place reception was always above 91% in the AV modality at all tested SNRs in the GW96 study. Thus, it is likely that the benefit of visual cues to the place information could have been much higher for isolated syllables, compared to that for sequenced syllables, if measured at lower SII-equated SNRs. In other words, the reduction in the benefit of visual cues to the place-of-articulation information due to faster production of consonants in connected syllables is likely to be larger than that observed in Figure 8. This was confirmed by the comparison of relative feature reception in the VO modality for isolated and sequenced syllables, shown in Figure 10. While there were small differences (<20 pp) in the relative feature reception for voicing and manner of articulation, the relative feature reception for the place of articulation was 57 pp higher for isolated syllables. This supports our third hypothesis. One reason for degraded place information in sequenced syllables may be a reduced ability of the talker to achieve the intended articulator positions when speaking at a conversational rate. Additionally, a reduction in the viewer's ability to track visual articulatory dynamics when consonants were spoken in sequence at conversational rates could also further contribute to the reduction in place-of-articulation information in sequenced syllables.

A comparison of the relative feature reception for consonant features (overall [O], voicing [V], manner [M], and place [P]) for sequenced and isolated syllables in video-only modality. Feature scores for isolated syllables were estimated from the confusion matrix in video-only modality from GW96, while those for sequenced syllables were obtained from data collected in a different, unpublished study2 on five NH listeners using the same stimuli and testing paradigm (i.e., closed-set recognition of one out of three consonants, randomized over the position) as the current study.
The reduced place information obtained from visual consonant cues in sequenced syllables has important implications for the extant models of audiovisual speech integration (e.g., Massaro, 1987). If place-of-articulation cues are not available with high fidelity through speechreading alone (i.e., in VO modality), then signal processing strategies designed to enhance voicing and manner-of-articulation information (e.g., cues that are traditionally not well received by speechreading alone) would likely fall short of achieving optimal AV performance. These data imply that place information in conversational speech cannot be received through the visual modality alone, as was originally assumed in GW96, and that signal processing strategies to enhance place cues may still be necessary.
Isolated Versus Sequenced Syllable Stimuli
Another way to understand the effect of speaking consonants in connected syllables would be to compare the sequenced syllable stimuli used in this study with those obtained by merely concatenating isolated syllables. In connected speech, every syllable is not stressed. In the current study, only the third syllable of the four-syllable phrase was stressed. The typical isolated syllable stimuli used in consonant identification studies are “clearly” pronounced, with primary stress on the syllable containing the test consonant. This is done in order to avoid consonant errors due to sub-optimal pronunciation confounding the analysis of perceptual consonant errors due to acoustic manipulations such as noise masking, filtering, or time truncation. To this end, some studies even removed responses to low-scoring stimuli (identified based on responses in the absence of noise) before analyzing perceptual consonant confusions caused by noise masking (Phatak & Allen, 2007).
The /ɑCɑ/ stimuli used in GW96 were produced with primary stress on the second syllable, and with a rising pitch or fundamental frequency contour (like that in a question). This resulted in the second vowel sound to be significantly longer, more intense, and at a higher pitch than the first vowel sound. Therefore, the concatenation of such isolated syllable stimuli would produce an unnatural stress pattern and discontinuous energy and pitch contours. It also resulted in prolonged and intense formant transitions in the medial consonants. It may be possible, to some extent, to alter the vowel duration, the pitch contour, and the energy pattern using signal processing techniques to match those in the multisyllabic stimuli from the current study. However, it may not be possible to remove the effect of stress on formant transitions in isolated syllables to match the formant transitions in unstressed syllables from the current study stimuli without causing perceivable artifacts.
Another important difference between the two types of stimuli, which can result in more coarticulation and affect the production of speech cues like formant transitions, is the speaking rate. The tokens in the current study were spoken at a rate of 3.6 syllables/s, which is very close to the average conversational syllabic rate of 4–5 syllables/s (Arai & Greenberg, 1997), whereas those in the GW96 study were spoken at a rate of 2 syllables/s. These syllabic rates were estimated from envelope modulation spectra and verified by measuring the distribution of intersyllabic durations of the two sets of stimuli. Speaking at a faster syllabic rate requires faster movements of articulators, which results in increased coarticulation and less prominent dynamic speech cues (Gay et al., 1974). For example, loci of formant transitions (i.e., onset and end frequencies) cannot achieve the intended value with a faster speaking rate (Agwuele et al., 2008). This can result in a degradation in the transmission of place-of-articulation information for plosives (Kewley-Port et al., 1983) and fricatives (Delattre et al., 1962). The manner-of-articulation distinction between sibilant fricatives and affricates is primarily provided by the rate of increase of frication energy onset (Mitani et al., 2006), which can be affected by the speaking rate. For isolated syllable stimuli from GW96, the time taken for the frication energy above 3 kHz to rise from 10% to 90% of the maximum value was 67.9 ms for /ʃ/ (SH) and 31.7 ms for /ʧ/ (CH). The same rise time in the present study was on average 63.2 ms for /ʃ/ (52.7 ms in C1, 78.9 ms in C2, and 57.9 ms in C3 position) and 36.2 ms for /ʧ/ (37.1 ms in C1, 37.6 ms in C2, and 33.8 ms in C3 position). This could be the likely reason behind the increase in /ʃ/-/ʧ/ confusions in sequenced syllables, compared to the isolated syllables. These are some possible explanations for the increased place and manner errors observed in sequenced versus isolated nonsense syllables at approximately equal SII (Figure 8), and support our second hypothesis that temporally-dynamic consonant cues would be affected most in consonant sequences produced at conversational syllabic rates.
Speaking rate also affects the voice-onset time (VOT), which is the primary cue for voicing distinction (Abramson & Whalen, 2017). For example, the average VOT for /t/, which was 87.1 ms for isolated syllable stimuli from GW96, reduced to an average of 56.7 ms in sequenced syllables in the current study (58.6 ms in C1, 57.8 ms in C2, and 53.6 ms in C3 position). However, listeners can adjust the perceptual boundaries for voiced-unvoiced categorization based on the speaking rate resulting in no net increase in voicing errors (Miller et al., 1986). Moreover, voicing distinctions are also determined by the spectrum in the initial 10–20 ms for plosives (Blumstein & Stevens, 1980) and initial 60 ms for fricatives (Stevens et al., 1992), and truncating the information beyond that duration leads to mostly place- and manner-of-articulation errors, but very few voicing errors (Li et al., 2010, 2012). This may explain why consonants in continuous speech convey relatively less manner- and place-of-articulation information than in isolated syllable productions, while voicing information is comparable across the two styles of productions examined in this study.
Limitations
Measuring consonant confusions with the sequenced syllable stimuli and comparing those to consonant confusions measured conventionally using isolated syllables provided an opportunity to investigate the effect of producing consonants in a sequence at a conversational syllabic rate on their intelligibility. As mentioned in the Introduction, these phrases differed from real words and phrases in terms of linguistic properties (no lexical context, different probabilities of occurrence of various consonant sounds etc.), but were acoustically similar due to an increased syllable rate that would change stress, energy and pitch patterns, and increase coarticulation.
However, the consonants in these phrases do not entirely represent those in conversational speech (see Figure 1). For example, the tokens in the current study were spoken relatively “clearly” and therefore likely have less coarticulation than those in a casual conversational speech. Thus, consonants in conversational speech can be speculated to be even more difficult to recognize. Moreover, Helfer (1997) found that the benefit of visual information is somewhat reduced for conversational speech, and that the benefit of visual cues was complementary, rather than redundant, with the benefit of speaking clearly. This suggests that the further degradation of speech cues in conversational speech may not be recovered by lip reading. However, this reduction in consonant recognition, and perhaps in vowel recognition, is either partially or completely compensated by the information provided by linguistic and topical context in conversational speech. These factors should be investigated before applying the results of this study to consonant perception in conversational speech.
While the CMs measured in this study in both AO and AV modalities provide insight into consonant feature perception in conversational speech, more data are needed at multiple SNRs to get a better understanding of the noise-robustness of consonants and specific consonant features. Measuring CMs at multiple SNRs would allow us to not only compare consonant confusions across sequenced and isolated syllables without a ceiling effect (which was present in GW96 data for the chosen SII-equated SNR), but also build confusion patterns that reveal the hierarchy in noise-robustness of consonant cues (Phatak & Allen, 2007) in sequenced syllables.
Another limitation of this study was that the effect of talker variability could not be assessed with the available stimuli. Consonant sequences in the current study were produced by a single male talker, while the isolated syllables from GW96 were spoken by a single female talker. This talker difference across the two studies is a potential confounding factor in comparing consonant perception in isolated and sequenced syllables. However, both studies used multiple utterances from the respective talker, and therefore account for the within-talker utterance variability, which has been reported to be comparable to the across-talker variability. Specifically, Zaar and Dau (2015) stated that for consonant recognition, “articulatory differences in utterances of a given talker had a perceptually comparable effect to articulatory differences in utterances of different talkers of different gender.” Therefore, it is unlikely that the differences between isolated and sequenced syllable consonant perception, which were observed after averaging out the within-talker variability, are due to differences across the two studies. Nevertheless, it should be verified by measuring consonant recognition with isolated and sequenced syllable stimuli spoken by multiple male and female talkers.
Conclusions
After accounting for differences in stimuli spectra (using SII), consonants spoken at conversational syllabic rates were found to be more difficult to recognize than those in isolated syllables, requiring higher SII to achieve the same recognition performance of 70%.
The recognition score vs. SII curve is shallower, that is, there is less improvement in recognition score per SII increase, for consonants in sequenced syllables than in isolated syllables around the 70% recognition level.
The relatively worse consonant recognition performance for sequenced syllables is primarily due to poorer reception of place- and manner-of-articulation information.
The contribution of visual speech cues to place-of-articulation information is reduced when consonants are spoken in sequence at conversational syllabic rate.
Supplemental Material
sj-txt-1-tia-10.1177_23312165231156673 - Supplemental material for Consonant Perception in Connected Syllables Spoken at a Conversational Syllabic Rate
Supplemental material, sj-txt-1-tia-10.1177_23312165231156673 for Consonant Perception in Connected Syllables Spoken at a Conversational Syllabic Rate by Sandeep A. Phatak, Danielle J. Zion and Ken W. Grant in Trends in Hearing
Footnotes
Notes
Acknowledgments
We thank Josh Bernstein for his major contribution in recording the consonant sequence stimuli set. Stefanie Kuchinsky and Ian Phillips provided important guidance regarding statistical analyses. This research was partially supported by a Cooperative Research and Development Agreement between the Clinical Investigative Regulatory Office, U.S. Army Medical Department and School, and the Oticon Foundation, Copenhagen, Denmark. The views expressed in this paper are those of the authors and do not reflect the official policy of the Department of the Army/Navy/Air Force, Department of Defense (DoD), or the U.S. Government. The identification of specific products or scientific instrumentation does not constitute endorsement or implied endorsement on the part of the authors, DoD, or any component agency.
Declaration of Conflicting Interests
The author(s) declared no potential conflicts of interest with respect to the research, authorship, and/or publication of this article.
Funding
The author(s) received no financial support for the research, authorship, and/or publication of this article.
Supplemental Material
Supplemental material for this article is available online.
References
Supplementary Material
Please find the following supplemental material available below.
For Open Access articles published under a Creative Commons License, all supplemental material carries the same license as the article it is associated with.
For non-Open Access articles published, all supplemental material carries a non-exclusive license, and permission requests for re-use of supplemental material or any part of supplemental material shall be sent directly to the copyright owner as specified in the copyright notice associated with the article.