
Abstract
Sound textures are a broad class of sounds defined by their homogeneous temporal structure. It has been suggested that sound texture perception is mediated by time-averaged summary statistics measured from early stages of the auditory system. The ability of young normal-hearing (NH) listeners to identify synthetic sound textures increases as the statistics of the synthetic texture approach those of its real-world counterpart. In sound texture discrimination, young NH listeners utilize the fine temporal stimulus information for short-duration stimuli, whereas they switch to a time-averaged statistical representation as the stimulus’ duration increases. The present study investigated how younger and older listeners with a sensorineural hearing impairment perform in the corresponding texture identification and discrimination tasks in which the stimuli were amplified to compensate for the individual listeners’ loss of audibility. In both hearing impaired (HI) listeners and NH controls, sound texture identification performance increased as the number of statistics imposed during the synthesis stage increased, but hearing impairment was accompanied by a significant reduction in overall identification accuracy. Sound texture discrimination performance was measured across listener groups categorized by age and hearing loss. Sound texture discrimination performance was unaffected by hearing loss at all excerpt durations. The older listeners’ sound texture and exemplar discrimination performance decreased for signals of short excerpt duration, with older HI listeners performing better than older NH listeners. The results suggest that the time-averaged statistic representations of sound textures provide listeners with cues which are robust to the effects of age and sensorineural hearing loss.
Keywords
Introduction
Sound textures (e.g., sounds produced by wind, insect swarms, fire, and water) are a broad class of acoustic stimuli found in everyday listening environments. One unique property of sound textures is that their statistical properties remain relatively constant over time and can thus be efficiently represented via time-averaged statistics. McDermott and Simoncelli (2011) developed a sound texture framework that synthesized textures by analyzing the time-averaged statistics at the output of several processing stages of a biologically plausible auditory model, which were subsequently used to shape a Gaussian noise seed to have matching statistics. The model comprised auditory processing stages derived from both psychophysical and physiological data, which have been shown to be important for the perception of acoustic stimuli, including frequency-selective auditory filters (Glasberg & Moore, 1990; Patterson, 1976; Patterson et al., 1987), compressive non-linearities (Ruggero, 1992; Yates, 1990; Zilany et al., 2009; Zwicker, 1979), and amplitude-modulation selective filters (Dau et al., 1997; Chi et al., 2005). Behavioral identification tasks with young (NH) listeners found that increasing the number of statistic classes imposed during the synthesis process increased the similarity of the sound texture percept to the real-world equivalent. Furthermore, when the auditory model deviated in its biological plausibility, such as applying linearly (instead of logarithmically) spaced auditory filters, the perceptual quality of the sound texture exemplars was reduced. In a subsequent study, McDermott et al. (2013) demonstrated that young NH listeners’ ability to discriminate between excerpts of two different sound textures (texture discrimination) improved as the excerpt duration increased, whereas the listeners’ ability to discriminate between two unique excerpts taken from the same sound texture (exemplar discrimination) worsened as the excerpt duration increased. The results of both texture and exemplar discrimination suggest that, as the duration of a sound texture increases, the auditory system switches from a fine-grained representation to a time-averaged statistic representation.
The present study investigated the effect of hearing loss and age on sound texture perception. Hearing loss commonly distorts the coding and representation of the sound in the auditory system and affects sound perception, including sound source separation (Bronkhorst & Plomp, 1989, 1992; Ter-Horst, 1993), spectral and temporal resolution (Dubno & Schaefer, 1995; Moore, 1985; Nelson & Freyman, 1987; Reed et al., 2009), and pitch and loudness perception (Arehart & Burns, 1999; Oxenham, 2008; Rosengard et al., 2005) which, in turn, affects music and speech perception, particularly in noisy and reverberant environments (Carhart & Tillman, 1970; Cherry, 1953; Dubno et al., 1984; Duquesnoy, 1983; Eisenberg et al., 1995; Hygge et al., 1992; Moore et al., 1995; Peters et al., 1998; Takahashi & Bacon, 1992). McWalter and Dau (2015) reported that the statistics of sound textures were altered when measured through auditory models which reflected aspects of hearing loss (broader acoustic filters and reduced non-linearities). These alterations were quantified by the coefficient of variance of squared difference. The higher-order marginal moments, correlations and modulation power statistics showed more variation than the other statistic classes. Furthermore, listeners were able to discriminate between sound textures synthesized from the unaltered auditory model and the altered ones.
Previous behavioral studies have typically focused on the perception of environmental sounds, a broader class of sounds found in everyday life of which many, but not all, may also be classified as sound textures. NH adults typically perform well in identification of everyday environmental sounds (Gaver, 1993), as well as more complex sound perception tasks, such as determining the length of objects by their sound when dropped onto a hard surface (Carello et al., 1998), the gender of a walker by the sound of their footsteps (Li et al., 1991), and hand configuration by the sound of applause (Repp, 1987). Identification of gross material categories of impacted objects has been suggested to be relatively robust (Giordano & McAdams, 2006) even when listeners only have access to long-term spectral information as in texture sounds (Hjortkjær & McAdams, 2016). However, surveys have indicated that hearing loss negatively affects the perception of environmental sounds (Badran, 2001; Cox et al., 2007; Hallberg et al., 2008; Hass-Slavin et al., 2005; Tyler, 1990, 1994; Zhao et al., 1997; Zwolan et al., 1996), as well as listeners’ sense of self-awareness, ability to detect danger and overall quality of life (Arlinger, 2003; Hétu et al., 1988; Mulrow et al., 1990; Scherer, 1998). Sound texture perception is therefore an important part of everyday audition, yet little is known regarding (HI) listeners’ perception of sound textures.
Older listeners with age-appropriate hearing (pure tone thresholds less than 41 dB HL between 250 and 4000 Hz) have also demonstrated poorer performance than younger listeners in environmental sound identification tasks, in particular when the task complexity increases or the stimulus is distorted or masked (Fabiani et al., 1996; Gygi & Shafiro, 2013). In general, age affects auditory perception and is often confounded with the effect of hearing loss. Age has been demonstrated to degrade the neural representation of sound at the auditory midbrain and cortical levels, particularly with respect to temporal attributes (Hellstrom & Schmiedt, 1990; Presacco et al., 2016; Ross et al., 2010; Sörös et al., 2009). Many psychophysical studies have explored the behavioral effects of age on temporal processing tasks in listeners with normal audiograms, such as gap detection (Lister & Roberts, 2005; Roberts & Lister, 2004), duration detection (Abel et al., 1990; Fitzgibbons & Gordon-Salant, 1994, 1995, 2001, 2004), modulation detection (Dashika et al., 2016; Wallaert et al., 2016), and temporal-fine-structure processing (Füllgrabe, 2013; Füllgrabe & Moore, 2018), in which older listeners have typically demonstrated poorer temporal processing abilities than younger listeners.
While the effects of hearing loss and age have been shown to negatively impact listeners’ perception of environmental sounds, little is known about the effects on sound texture perception. Sound textures represent a well-defined subset of environmental sounds and are characterized by temporal homogeneity. The time-averaged statistics of sound textures play an important role in perception and are presumed to be shaped by the auditory periphery. It is hypothesized that distortions to the auditory periphery due to age and/or hearing loss may be reflected in listeners’ ability to accurately identify and discriminate sound textures. Here, two of the experiments from McDermott and Simoncelli (2011) and McDermott et al. (2013) were conducted with HI and older listeners to investigate these effects and the results were compared with data from young NH listeners in those reference studies. In the first experiment, sound texture identification performance was measured in mostly older HI listeners to study the listeners’ identification sensitivity with varying sound texture statistics. In the second experiment, the effect of hearing loss and age on the listeners’ ability to discriminate between sound textures of varying excerpt duration was examined.
Materials and Methods
Sound Texture Synthesis Model
The sound texture synthesis system used in this study was the one developed by McDermott and Simoncelli (2011), and comprised an analysis and a synthesis stage. Here, a condensed description is provided, and further details can be found in McDermott and Simoncelli (2011). In the analysis stage, the real-world sound texture recording is first decomposed into 30 subbands using cosine zero-phase filters whose center frequencies are equally spaced on an equivalent rectangular bandwidth (ERB) scale across the acoustic frequencies 52 to 8844 Hz. Two additional low- and high-pass filters are applied at the extremes of the spectrum to achieve a constant summed squared frequency response across frequency. The decomposition of a broadband signal into separate acoustic frequency subbands reflects the frequency selectivity of the cochlea. Subsequently, the envelopes of each subband are derived by first taking the Hilbert transform of each subband, and then the absolute of the resultant analytic signals. Each subband envelope is compressed using a power law exponent value of 0.3. The envelope extraction represents a rough estimation of the inner hair cells’ response to a travelling wave on the basilar membrane, and the compression stage simulates the active non-linear amplitude response of the outer hair cells. The subband envelopes are downsampled to 400 Hz to improve computational efficiency. The marginal moments comprise the mean, variance, skew and kurtosis of the subband envelopes. The cochlear correlation statistics measure the correlations between each subband envelope and its eight neighboring subband envelopes. Each subband envelope is then passed through a modulation filterbank comprising 20 half-cosine filters, logarithmically spaced from 0.5 Hz to 200 Hz with a Q-factor of 2. This stage reflects the auditory system's sensitivity to the slow-varying fluctuations in a signal's temporal envelope. The modulation power is measured across each acoustic-modulation frequency channel. The modulation correlations, C1, capture the correlations between six octave-spaced modulation channels each tuned to the same modulation frequency, as well as its two nearest neighbors, but across all acoustic frequencies. The subset of six octave-spaced modulation filters cover a range of 3 Hz to 100 Hz with a Q-factor of √2. The C2 modulation correlations capture the correlations between six octave-spaced modulation channels each tuned to the same acoustic frequency, but across the same six octave-spaced modulation channels as used in the C1 correlations.
In the synthesis stage, the measured statistics are imposed onto a 5-s Gaussian noise seed using an iterative process, until the statistics of the seed match the measured statistics of the input signal. Gaussian noise is chosen to ensure that the fine structure is as random as possible and thus each synthesis yields a novel synthetic texture. The iteration loop operates on the synthetic noise seed and comprises the same acoustic and modulation-frequency decomposition stages and non-linearities. The synthetic texture's statistics at each stage is measured and an error signal is computed corresponding to the difference with the desired real-world texture's statistics. A signal-to-noise ratio (SNR) is computed for each statistic class as the squared statistic values to the squared error of the statistic class. The synthetic texture's statistics are then modified using a gradient descent method and the iteration process is stopped once all statistics classes reach an SNR of 30 dB or higher, or after 60 iteration loops. Only textures whose average SNR across all statistic classes reached 20 dB or higher were included in the present experiments.
Experiment 1: Sound Texture Identification
Procedure
The identification experiment from McDermott and Simoncelli (2011) was replicated in this study. The stimuli were divided into five sound texture classes: ‘animals’ (e.g., insects in swamp, frogs, seagulls), ‘environment’ (e.g., pouring coins, wind blowing, fire), ‘mechanical’ (e.g., bulldozer, train locomotive, jackhammer), ‘people’ (e.g., babble, crowd noise, laughter) and ‘water’ (e.g., waterfall, rain in woods, seaside waves). Sound textures within each class possessed similar perceptual and statistical properties such that sound textures within each class were more likely to be confused with each other than sound textures from two different classes. A one-interval five-alternative-forced-choice method was used, in which each trial contained a single stimulus and five labels, one of which had to be chosen. One label was correct, while the other four were incorrect and randomly selected from each of the four remaining sound texture classes. The listeners’ performance was measured in terms of percentage correct responses. The same 96 sound textures as in McDermott and Simoncelli (2011) were used, each with a duration of 7 s, a sampling frequency of 20 kHz and 16 bit resolution.
Nine conditions were prepared for each stimulus. Condition 1 represented the synthetic sound texture including the cochlear channel power only; condition 2 comprised only the marginal moments (mean, variance, skew and kurtosis); condition 3 also included cochlear correlations (C); condition 4 used modulation power instead of cochlear correlations; condition 5 included both cochlear correlations and modulation power; condition 6 added the C1 correlations, whereas condition 7 added only the C2 correlations; condition 8 included the full set of statistic classes. Condition 9 represented the original (non-synthesized) real-world sound texture.
All tasks were conducted with MATLAB 2017a on a Macbook Pro 2017 model. The stimuli were presented to both ears diotically at a sound pressure level (SPL) of 70 dB (as also used in McDermott & Simoncelli, 2011) and the playback system was calibrated using a G.R.A.S IEC 60318–1 Ear Simulator and a Norsonic Nor139 sound level meter. Audio playback was provided via a Focusrite Scarlett 2i2 Universal Serial Bus (USB) audio interface (48 kHz, 24 bit) and Sennheiser HD650 headphones. A soundproof booth (customized IAC 1200-A medical room) was used, with the fan switched off. All listeners conducted the tests without hearing aids but were provided with audibility compensation. This was done using a Cambridge method for loudness equalization (CAMEQ) filter (Moore et al., 1999) which brought as much of the stimulus’ spectrum above threshold as possible by equalizing, for each ear separately, the average specific loudness of the stimulus across the frequency range from 500 to 8000 Hz. A 10-ms half-Hanning window was applied to the onsets and offsets of the sounds during playback to avoid unwanted spectral cues. Before the session, the listeners read instructions which explained the task and were asked if they had fully understood the task before commencing the test. Each listener completed the identification task in one experimental session, including pauses. Listeners did not receive any training prior to the test, nor was feedback provided during the test, consistent with McDermott and Simoncelli (2011).
Listeners
Eleven mostly older HI listeners (10 male, age range 20 to 88 years, mean age 70.8 years, s.d. 17.7 years) participated in the experiment. All HI listeners in this study had a sloping, symmetric (±10 dB) sensorineural hearing loss within the N2 – N5 standard audiograms (Bisgaard et al., 2010). Audiograms were tested at eight frequencies: 250, 500, 1000, 1500, 2000, 4000, 6000 and 8000 Hz). Seven listeners had air-bone gap (ABG) thresholds less than 10 dB at all eight tested frequencies. Four listeners had ABG thresholds less than 10 dB at all but one tested frequency (500–4000 Hz; ABG = 15–20 dB). The listeners received financial compensation for their time and had prior experience in psychoacoustical procedures. All listeners provided informed consent and the experiment was approved by the Science-Ethics Committee for the Capital Region of Denmark (reference H-16036391).

Pure-tone audiometric thresholds for all HI listeners. The mean and standard deviation across listeners are shown by the bold markers and error bars, respectively. Left and right ears are indicated by blue and red lines, respectively. Individual listeners’ thresholds (averaged across left and right ears) are indicated by the grey lines.
Data Analysis
The young NH listeners’ scores from McDermott and Simoncelli (2011) were included as controls in the analysis of this experiment, and comprised the mean percent correct of 10 listeners’ (one male, mean age 22.2 years, age range not available) identification performance for the same nine conditions as detailed in this experiment. Tests for experimental effects were conducted using mixed linear models, with the fixed effects hearing (NH or HI) and synthesis condition (1 to 9) and a random effect of listener to account for repeated measures. Two sound texture-class confusion patterns were derived, reflecting the listeners’ responses versus the (correct) target response. One confusion pattern included the listeners’ responses to only synthesis conditions 1 to 3, referred to as ‘low-order’ textures. The other confusion patterns included the responses to only ‘high-order’ synthesis conditions 6 to 8. These synthesis conditions were chosen (as opposed to using conditions 1 to 4, and conditions 5 to 8) to place more weight on specifically the ‘low’ and ‘high’ order statistics. For each, a fixed effects model was fit with fixed effect confusion group. All t-tests were conducted using Bonferroni adjusted alpha values. The significance levels were consistent throughout this study: n.s: p ≥ 0.05, *p < 0.05, **p < 0.01, ***p < 0.001.
Experiment 2: Sound Texture Discrimination
Procedure
Sound texture and exemplar discrimination experiments as described in McDermott et al. (2013) were conducted. The stimulus pool comprised 100 textures in total: 50 pairs for texture discrimination, and 50 individual sound textures for exemplar discrimination. The stimuli were synthesized using the same toolbox as in experiment 1 and the synthesis stage imposed the marginal moments (kurtosis omitted), cochlear correlations, modulation power, and C1 and C2 correlations (synthesis condition 8) onto a 5 s white Gaussian noise seed.
A three-interval, two-alternative-forced-choice (odd-one-out) task was used. The listeners were presented with three intervals of equal duration in the order A–reference–B, with a fixed inter-stimulus interval of 400 ms. They were then asked to indicate which interval, A or B, contained the odd-one-out. In the case of sound texture discrimination, one of the intervals, A or B, was randomly assigned a unique excerpt taken from the same synthetic sound texture as the reference, while the other interval was of a different synthetic sound texture entirely. The task thus measures listeners’ ability to hear differences between two different textures. In exemplar discrimination, three intervals were again presented to the listener; however, this time all three intervals belonged to the same synthetic sound texture, whereby one interval, A or B, was randomly assigned the same excerpt as the reference (i.e., both were physically identical), while the other was a unique excerpt. The task measures listeners’ ability to discern fine details between two unique excerpts of the same sound texture. All unique excerpts were non-overlapping in time. Within a given trial, all excerpts were of equal duration, but across trials the excerpt duration was varied to be 40, 91, 209, 478, 1093 or 2500 ms. Each discrimination task thus comprised 300 trials (50 sound texture-pairs/textures x 6 excerpt durations) presented in a randomized order. The task order was also randomized and balanced across listeners. The experimental software, hardware, headphone calibration method and level, listening booth, and audibility compensation method were identical to those described in experiment 1.
Listeners
Four listener groups were tested to control for both hearing loss and age. Pilot tests were conducted with a group of four self-reported NH listeners aged between 21 and 28 years whose responses matched those of the 12 young self-reported NH listeners (all female, mean age 21.1 years, s.d. 3.0 years, age range not available) reported by McDermott et al. (2013). The four young NH listeners’ results from this study were pooled together with those of McDermott et al. (2013) to form the NH-50 group, which comprised 16 listeners under the age of 50 years (three males, mean age 22.2 years, s.d. 4.2 years). Listener group NH + 50 comprised 15 listeners over the age of 50 years (five males, age range 54 to 76 years, mean age 65.8 years, s.d. 8.1 years). The inclusion criteria for normal hearing were symmetric audiograms (± 10 dB) and a hearing level not exceeding 30 dB HL for all tested frequencies (250, 500, 1000, 1500, 2000, 4000, 6000 and 8000 Hz). Listener group HI + 50 consisted of nine HI listeners over the age of 50 years (eight males, age range 68 to 82 years, mean age 74.6 years, s.d. 4.0 years), of which all also participated in experiment 1. The fourth listener group, HI-50, comprised four listeners under the age of 50 years (three males, mean age 30.3 years, s.d. 13.3 years), of which one also participated in experiment 1. The relatively small number of listeners in this group was, in part, due to a lack of listeners who fit the described criteria for hearing loss. The inclusion criteria for sensorineural hearing loss were identical to those as described in experiment 1. Seven HI + 50 and three HI-50 listeners had ABG thresholds less than 10 dB at all tested frequencies. Two HI + 50 listeners and one HI-50 listener had ABG thresholds less than 10 dB at all but one tested frequency (500–4000 Hz; ABG = 15–20 dB).
The criteria for hearing loss were identical to those described in experiment 1.
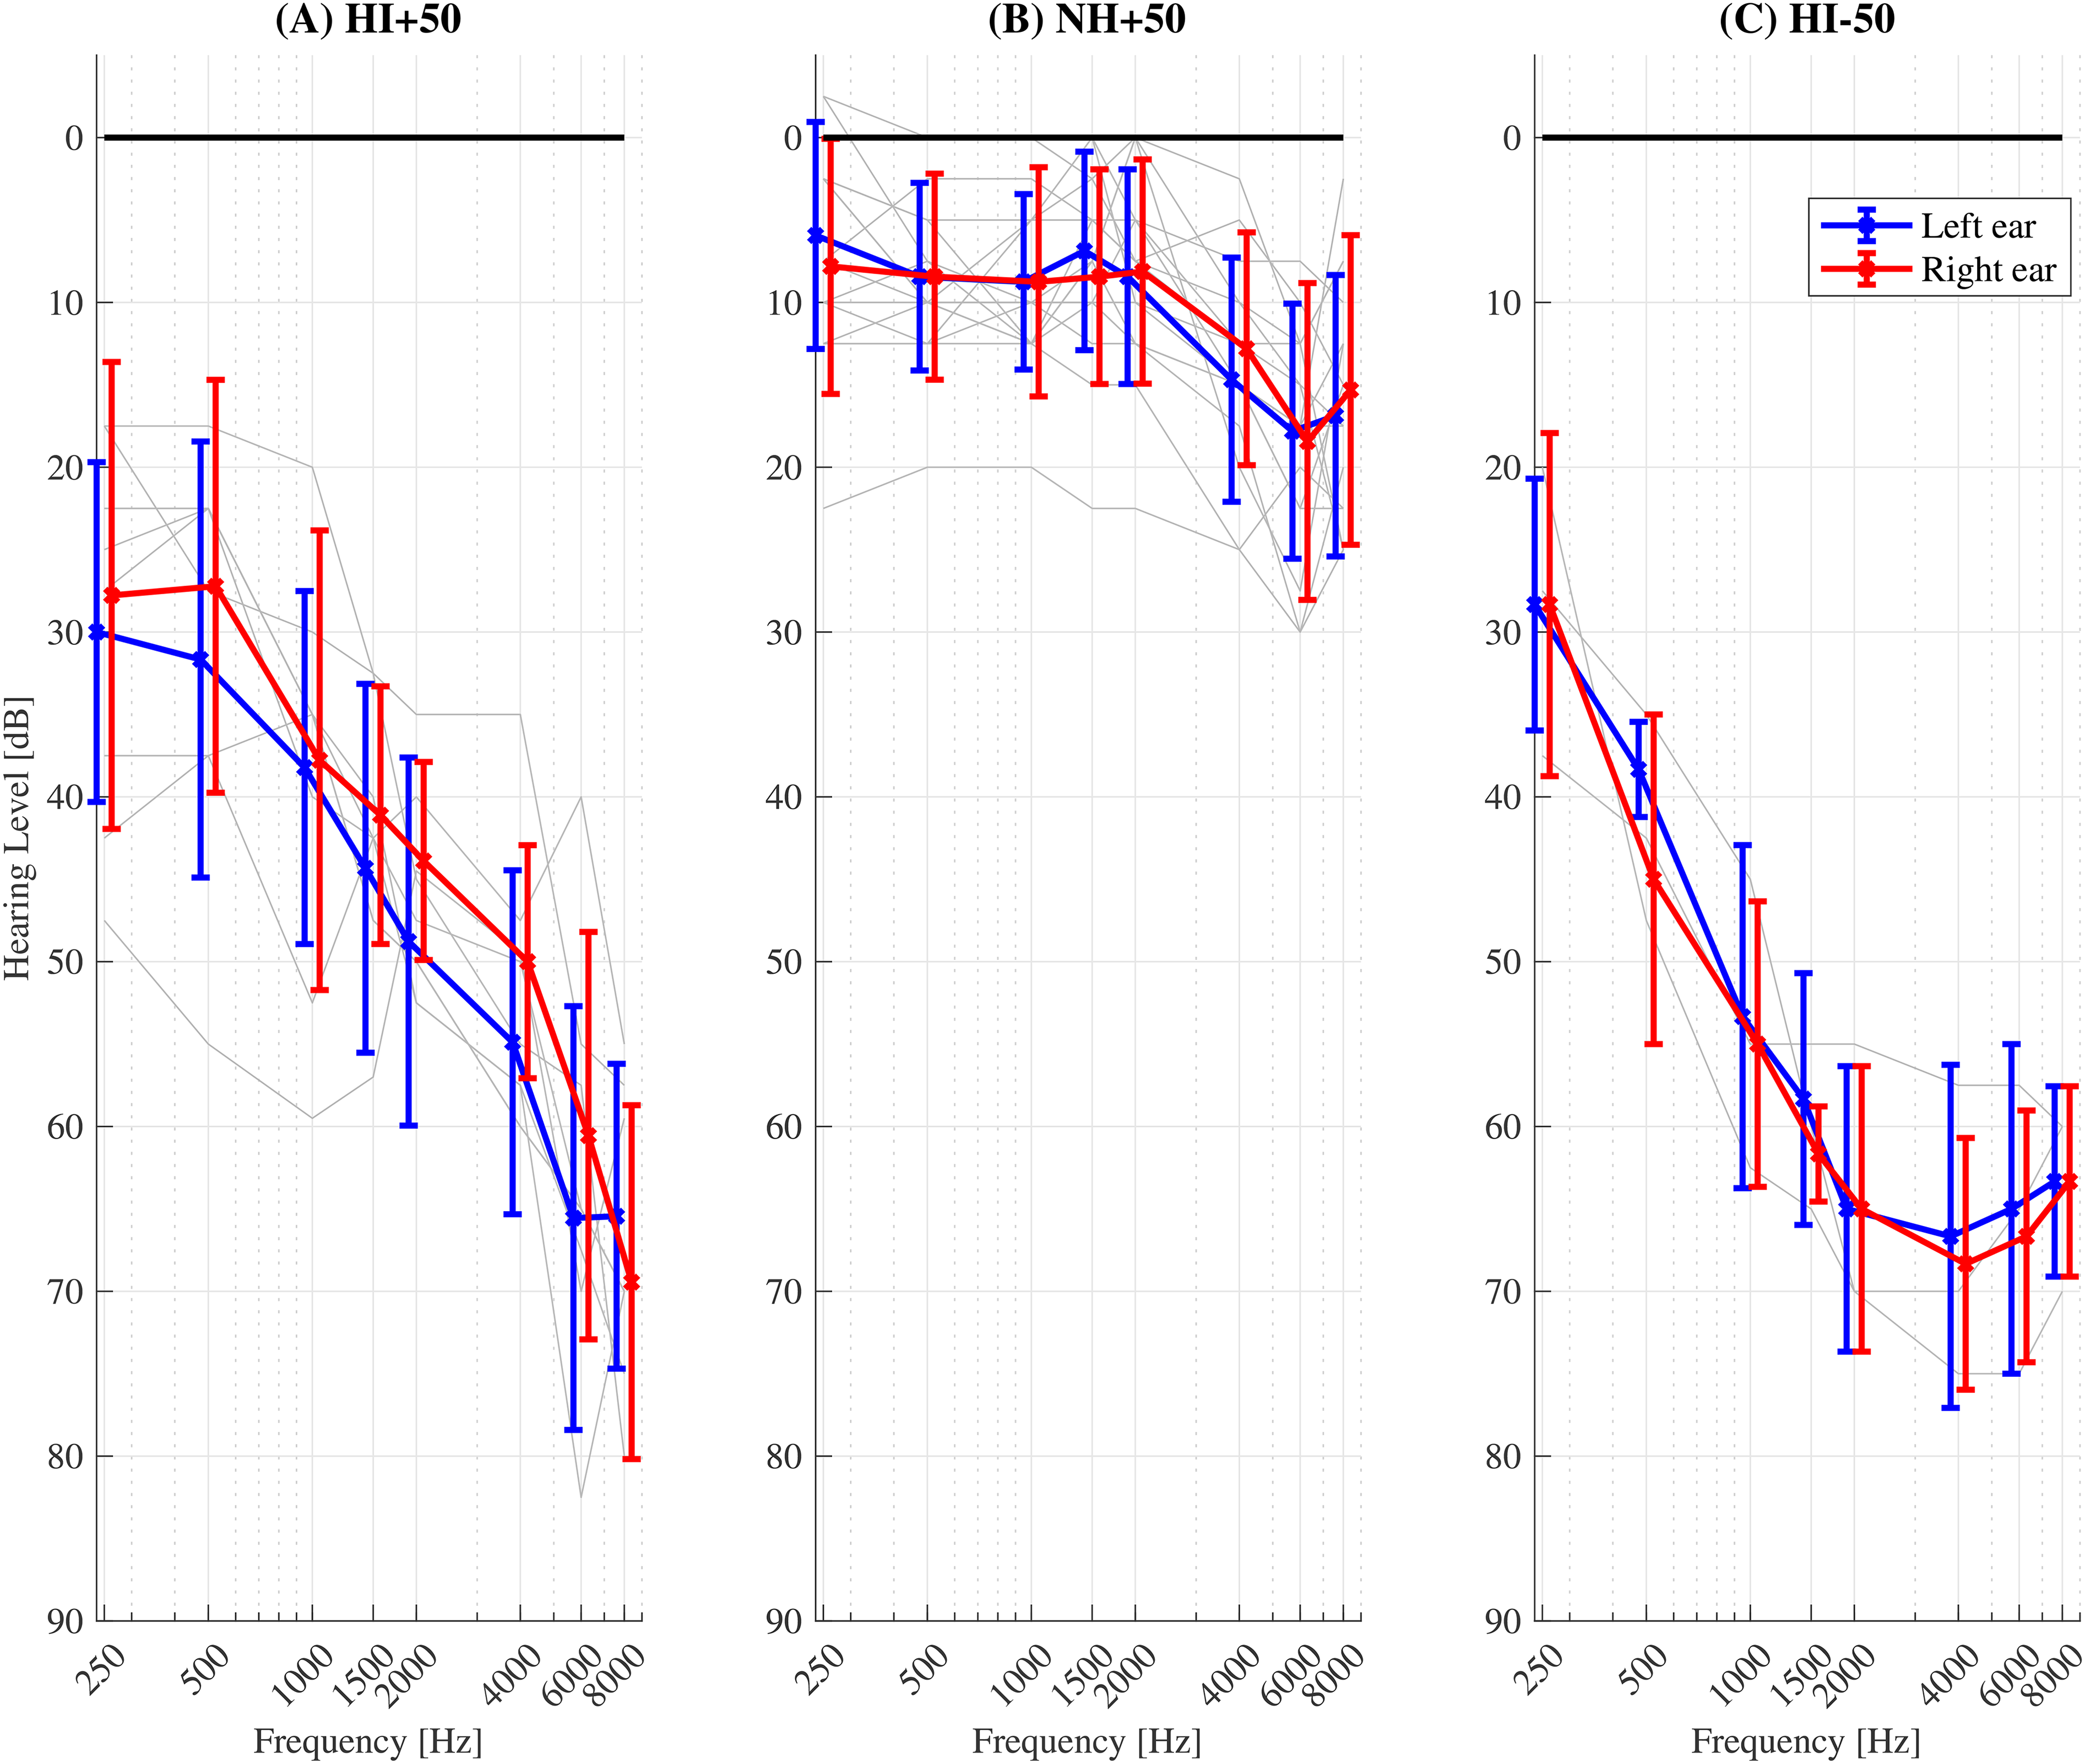
Pure tone audiometric thresholds for the (
All listeners received compensation for their time and had prior experience with psychoacoustic procedures. All listeners provided informed consent and the experiment was approved by the Science-Ethics Committee for the Capital Region of Denmark (reference H-16036391).
Data Analysis
Due to the relatively small sample size of the HI-50 group, these listeners were omitted from statistical analyses. Therefore, the effect of age was tested on the differences between the NH-50 and NH + 50 listener groups’ results, and the effect of hearing loss was tested on the differences between the NH + 50 and HI + 50 listener groups’ results. All t-tests were conducted using Bonferroni adjusted alpha values. The significance levels were consistent throughout this study: n.s: p ≥ 0.05, *p < 0.05, **p < 0.01, ***p < 0.001.
Results
Experiment 1: Sound Texture Identification

Average sound texture identification performance. The red open markers indicate the HI listeners’ performance measured in this study and the blue filled markers indicate the NH listeners’ performance taken from McDermott and Simoncelli (2011). Significance of differences (t-tests with Bonferroni corrections) between pairs of synthesis conditions is shown as color-coded lines and asterisks. Error bars represent the standard error of the mean. The black dotted line shows chance level (20%).
The largest performance improvements, for both listener groups, occurred between synthesis conditions 1 to 5. Post hoc t-tests were conducted to compare the pairwise differences between all experimental conditions (Bonferroni corrected alpha = 0.0014) for each listener group and revealed significant (p < 0.05) performance improvements between synthesis conditions 2–3, and 4–5 (NH listeners), and 1–2, 2–3, and 4–5 (HI listeners). For conditions 5 to 8, each additional statistic class resulted in performance increases that were modest and insignificant for both listener groups. Only the HI listeners’ performance increased significantly from condition 8 (synthetic sound textures) to condition 9 (real-world sound textures).
The highest identification performance for both listener groups occurred for the real-world sound texture (condition 9). As for all synthesized sound textures, the performance of the HI listeners was below that of the NH listeners, indicating an inherent deficiency due to hearing loss (beyond pure-tone sensitivity loss) and age that cannot be explained by any distortion resulting from the analysis/synthesis process.
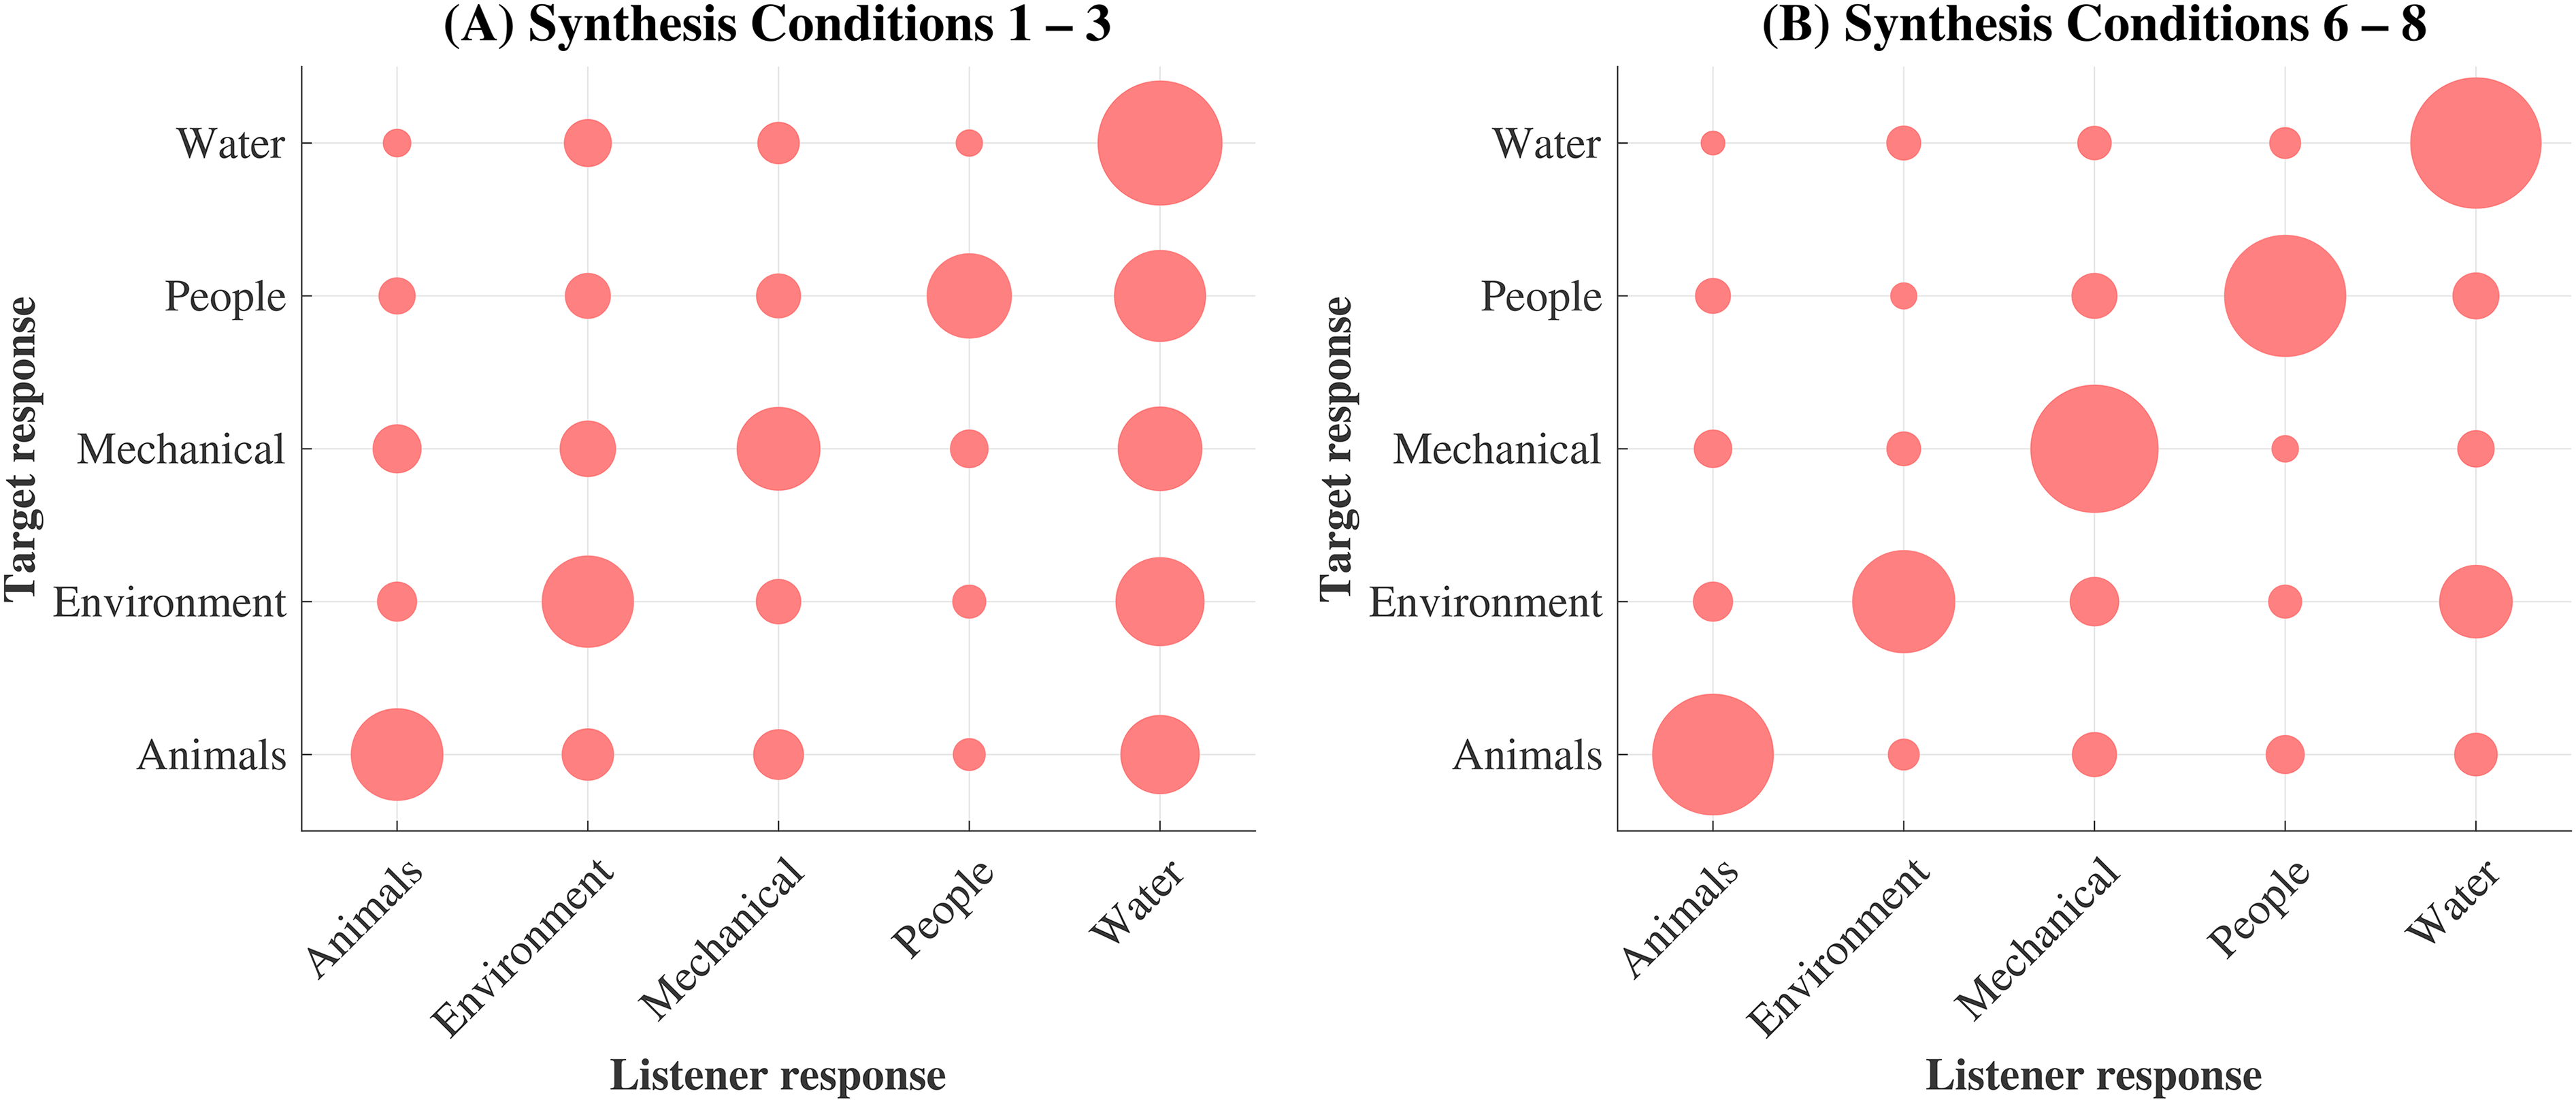
Older HI listeners’ confusion patterns. The abscissa represents the listeners’ responses for the different sound texture classes; the ordinate represents the target (correct) response. The area of the filled circles is proportional to the percentage of responses averaged across all listeners for each response-target pair. The different panels show the trends for two subsets of the data, indicating: (

(
In summary, the results indicated that both listener groups were perceptually sensitive to time-averaged statistics. However, the HI listeners’ overall identification performance was lower than reported for the NH listeners.
Experiment 2: Sound Texture Discrimination
The sound texture discrimination results (
Conversely, the exemplar discrimination results (
The HI + 50 listeners’ peak mean performance occurred at both 209 (78.9%) and 91 ms (78.2%) and was lower at 40 ms (65.8%), while for the NH + 50 listeners, peak performance occurred at 209 ms (70.1%), and decreased at both 91 ms (63.9%) and 40 ms (61.9%). The standard error increased consistently across both older listener groups’ responses as the excerpt duration decreased from 2500 ms (HI + 50 = 3.4%; NH + 50 = 2.7%) to 40 ms (HI + 50 = 4.2%; NH + 50 = 3.7%). The HI + 50 listeners scored higher than the NH + 50 listeners at all excerpt durations, with greatest differences found at 91 ms and 209 ms: HI + 50 scored 14.3% and 8.8% higher than NH + 50, respectively.

Differences in texture (
The duration-dependent effect of age is apparent in
Texture discrimination performance was found to be robust to both age and sensorineural hearing loss, whereas exemplar discrimination performance – in particular at the shorter excerpt durations – was significantly affected by age. Furthermore, the older HI listeners’ exemplar discrimination performance was better than the older NH listeners – a finding that was also more pronounced at the shorter excerpt durations.
Discussion
This study investigated the effects of sensorineural hearing loss and age on the perception of sound textures. Two experiments, originally described in McDermott and Simoncelli (2011) and McDermott et al. (2013), were conducted using different listener profiles.
Experiment 1 comprised a sound texture identification task conducted on mostly older HI listeners whose results indicated three findings similar to those previously reported for younger NH listeners: (i) listeners were perceptually sensitive to time-averaged statistics, (ii) their performance improved as the statistics of the synthetic sound texture approached those of the real-world equivalent, and (iii) largest performance improvements occurred when correlations between frequency channels were included in the synthesis stage. The HI listeners, however, showed an overall performance deficit compared to the previously reported NH listeners for all synthesis conditions. Thus, while the sound texture statistics were perceptually important to both listener groups for correct identification, the NH listeners were able to identify sound textures with a higher level of accuracy for all synthetic and real-world conditions.
In the second experiment, two different sound texture discrimination tasks were conducted on four listener groups categorized by both age (younger/older than 50 years) and sensorineural hearing loss (NH/HI). In sound texture discrimination, the listeners’ ability to hear differences between two different sound textures was measured, while in exemplar discrimination, the listeners’ ability to hear differences between two unique excerpts of the same sound texture was measured. All listener groups’ sound texture discrimination performance improved as the excerpt duration increased, and performance was accompanied by a decrease in the variability of the responses. In exemplar discrimination, the younger listeners improved monotonically as the excerpt duration decreased, indicating accurate perception of the fine-grain differences between sound textures down to durations as short as 40 ms – an ability not significantly affected by sensorineural hearing loss. The older listeners, on the other hand, reached much lower performance levels than both younger listener groups over a narrower range of short excerpt durations, indicating an overall poorer representation of the sounds’ fine-grain structure. The variability of the older listeners’ responses increased with decreasing excerpt duration, which suggests that many older listeners, with or without sensorineural hearing loss, were severely limited in their ability to perform the task. Furthermore, the older HI listeners performed better than the older NH listeners at all measured excerpt durations.
The results from this study indicate that listeners’ sensitivity to the time-averaged statistic representations of sound textures is robust to the effects of both age and sensorineural hearing loss. Although the older HI listeners were less able to accurately identify sound textures when synthesized with few statistics, high performance was nonetheless achieved as the number of statistics imposed during the synthesis stage increased, or when presented with the real-world sound texture. Furthermore, sound texture discrimination performance was unaffected by hearing loss. This is consistent with other studies (Ballas & Barnes, 1988; Harris et al., 2017) using environmental sounds in which accurate perception was observed in older listeners with normal hearing or (relative to this study) very mild hearing loss, but only when the task complexity was low and the stimulus quality was high (e.g., Gygi and Shafiro, 2013). The finding here might therefore be, at least partially, attributed to the simplicity of the experimental tasks.
Two interesting observations were that (i) the HI listeners performed worse than the NH listeners in texture identification, including the real-world textures, and (ii) the older HI listeners performed better than the older NH listeners in exemplar discrimination. Observation (i) suggests that the statistical representation of sound textures in HI listeners may differ from that in NH listeners, and is reflected in perception. Changes to the sound texture synthesis model which reflect aspects of hearing loss (e.g., broader auditory filters) have previously been shown to alter the statistical representation of sound textures, and to be perceptually discriminable (McWalter & Dau, 2015). These changes in the statistical representation may be reflected by an increase in the variability of the measured statistics of the sound texture: i.e., statistics measured across an impaired auditory system may not converge at the same rate or to the same degree as those measured across an unimpaired auditory system. McWalter and McDermott (2018) reported that young NH listeners integrate sound texture statistics over a time window on the order a few seconds. It is possible that older HI listeners require a longer integration window. Sound textures whose statistics are represented with greater variability may then pose HI listeners with greater difficulty in tasks such as identification where an accurate representation of the sound texture is necessary, while in texture discrimination, where differences between two representations are required for good performance, the effect may be less detrimental to HI listeners’ ability to perform the task.
Observation (ii) implies that the older HI listeners were better than the older NH listeners at discerning the fine temporal details of sound textures. There is evidence that HI listeners perform better than NH listeners in intensity discrimination (Jerger, 1962) and first-order amplitude modulation detection thresholds (Füllgrabe et al., 2003), possibly due to a loss of cochlear compression resulting in an expansion of the listener's internal representation of the signal's temporal envelope. This may in turn offer HI listeners with additional discrimination cues.
Alternatively, observation (ii) may reflect differences between the older HI and older NH listeners’ experience with psychoacoustic experiments. Due to their hearing loss, the older HI listeners have participated in numerous psychoacoustic experiments in the past, while the older NH listeners were less experienced. Exemplar discrimination relies on the listener's ability to focus on very short sound excerpts and make judgements on often quite subtle differences. In contrast, texture discrimination is a simpler task in that it relies on making judgements in response to longer excerpts of sounds. Therefore, the fact that the older HI listeners scored higher in exemplar discrimination than the older NH listeners, while texture discrimination performance was equal, may rather be explained by experience than hearing loss.
The results from exemplar discrimination showed that, despite demonstrating robust statistical representations of sound textures, the older listeners’ ability to access the fine temporal details of sound textures was severely limited. Factors such as task complexity, signal quality and loss of high frequency sensitivity, which have been shown to negatively affect older listeners’ perception of environmental sounds (Dick et al., 2015; Gygi & Shafiro, 2013), do not explain the findings in this study: the task was simple, the textures were synthesized with the full set of statistics, and the experiments were conducted in quiet with audibility compensation up to 8 kHz. Non-auditory cognitive decline has been linked to deficits in auditory processing tasks (for a review, see Aydelott et al., 2010). For example, Füllgrabe et al. (2015) conducted various cognitive tests on both younger and older NH listeners, and also measured their speech in noise performance. Cognitive abilities were positively correlated with speech in noise performance, and tended to be lower in the older listeners. Pichora-Fuller (2003) found that cognitive stressors, such as memory load, may exacerbate older listeners’ ability to understand spoken language. A more recent study (Strelcyk et al., 2019) measured older HI listeners’ sensitivity to interaural phase and time differences as well as their cognitive abilities (Trail Making Test) and reported a strong correlation between the auditory and non-auditory test scores.
Additionally, the older listeners’ poorer performance in the exemplar discrimination task may be linked to an age-related decline in temporal resolution. Evidence from psychophysical studies typically support the view that auditory temporal processing deteriorates with age, resulting in a loss of sensitivity to the temporal fine structure (Füllgrabe et al., 2015; Füllgrabe & Moore, 2018; Hopkins & Moore, 2011). Neural deafferentation and temporal asynchrony of neural activity have been discussed as age-related pathologies (Makary et al., 2011; Pichora-Fuller & Schneider, 1991, 1992; Schneider, 1997) which distort the temporal encoding of acoustic stimuli and their internal neural representation at cochlear and/or retro-cochlear levels of processing (Lopez-Poveda & Barrios, 2013). Typically, models have been employed to simulate neural deafferentation and asynchrony, and the effects on listeners’ perception have been measured. For example, Pichora-Fuller et al. (2007) simulated temporal asynchrony by temporally jittering speech signals, and reported a significant reduction in word identification performance when younger adults were presented with jittered speech as opposed to the clean speech. Marmel et al. (2015) used stochastic undersampling to model the effects of neural deafferentation and found that listeners’ duration discrimination performance systematically decreased with undersampling. However, a more recent study (Oxenham, 2016) based on signal detection theory suggests that even a synapse loss of 50% is unlikely to result in any measurable effect in perceptual tasks, such as signal detection in quiet and discrimination of intensity, frequency and interaural time differences.
Further work is required to explore the underlying factors that may account for the observed effects of sensorineural hearing loss and age on sound texture identification and on the discrimination of short texture excerpts. Firstly, more data on young HI listeners’ sound texture identification and discrimination performance would be beneficial to help extricate the two effects. Likewise, data on older NH listeners’ sound texture identification performance would provide a fully balanced data set. With respect to hearing loss, one line of enquiry would be to test if changes to the auditory model which reflect aspects of hearing loss result in a more variable representation (increased variability of the measured statistics) of the sound texture. To test if the poor exemplar discrimination performance of the older listeners is confined to short excerpts of sound textures, or is observed for a broader range of sounds, the exemplar discrimination experiment could be repeated with brief excerpts of other sounds, such as speech. Additionally, more complex listening tests, such as using sound textures to mask target signals, may expose further differences between the listener profiles and offer more ecologically valid insights into sound texture perception. Regarding the effect of age, further work may involve incorporating models of neural degeneration as well as correlations between measures of temporal resolution and individual listeners’ exemplar discrimination performance.
Footnotes
Acknowledgments
Special thanks to Richard McWalter and Tobias May for offering their insights and fruitful discussions during this study, and to Josh McDermott for kindly providing the raw data from the control studies. This work was carried out at the Oticon Centre of Excellence for Hearing and Speech Sciences (CHeSS) supported by the William Demant foundation. The work was also supported by the Novo Nordisk Foundation synergy Grant NNF17OC0027872 (UHeal).
Declaration of Conflicting Interests
The author(s) declared no potential conflicts of interest with respect to the research, authorship, and/or publication of this article.
Funding
The author(s) disclosed receipt of the following financial support for the research, authorship, and/or publication of this article: This work was supported by the Novo Nordisk Foundation synergy Grant (UHeal) (grant number NNF17OC0027872 ).