
Abstract
Speech audiometry in noise based on sentence tests is an important diagnostic tool to assess listeners’ speech recognition threshold (SRT), i.e., the signal-to-noise ratio corresponding to 50% intelligibility. The clinical standard measurement procedure requires a professional experimenter to record and evaluate the response (expert-conducted speech audiometry). The use of automatic speech recognition enables self-conducted measurements with an easy-to-use speech-based interface. This article compares self-conducted SRT measurements using smart speakers with expert-conducted laboratory measurements. With smart speakers, there is no control over the absolute presentation level, potential errors from the automated response logging, and room acoustics. We investigate the differences between highly controlled measurements in the laboratory and smart speaker-based tests for young normal-hearing (NH) listeners as well as for elderly NH, mildly and moderately hearing-impaired listeners in low, medium, and highly reverberant room acoustics. For the smart speaker setup, we observe an overall bias in the SRT result that depends on the hearing loss. The bias ranges from +0.7 dB for elderly moderately hearing-impaired listeners to +2.2 dB for young NH listeners. The intrasubject standard deviation is close to the clinical standard deviation (0.57/0.69 dB for the young/elderly NH compared with 0.5 dB observed for clinical tests and 0.93/1.09 dB for the mild/moderate hearing-impaired listeners compared with 0.9 dB). For detecting a clinically elevated SRT, the speech-based test achieves an area under the curve value of 0.95 and therefore seems promising for complementing clinical measurements.
Speech intelligibility, especially in noisy conditions, is a crucial factor of successful social interaction and is often limited for hearing-impaired (HI) listeners, which potentially reduces their quality of life. Early supply with hearing aids can ease this limitation (Arlinger, 2003) but requires an early and reliable diagnosis of hearing loss. However, hearing aid adoption rates are low, especially for mild-to-moderate hearing loss, and typically 1 to 7 years pass between becoming aware of a hearing loss and being provided with hearing aids (EuroTrack Germany 2018).
A reliable measurement tool with a high accuracy for quantifying speech intelligibility in noise is internationally available through matrix sentence tests (Kollmeier et al., 2015). Due to the closed-vocabulary construction of this test with a vocabulary size of 50 words, it allows for an unsupervised measurement with a graphical user interface (the so-called closed response format). Nevertheless, a graphical interface excludes subjects who cannot read, such as children, visually impaired, and illiterate people. As an example, 12% of the population aged between 18 and 64 years in Germany is functionally illiterate (Grotlüschen et al., 2019). Furthermore, finding the correct words in a 50-word matrix might increase the effort for the subject to conduct the measurement, which could increase the influence of cognitive skills on the result. For elderly subjects, it is often not possible to conduct the measurement with a graphical user interface in a reasonable time (Brand et al., 2004; Brand & Wagener, 2017).
To overcome these limitations, we explore systems based on human–machine interaction using a speech interface. A similar approach was used for the automatically conducting the Dutch LIST sentence test with the goal of quantifying intelligibility of patients with cochlear implants (Deprez et al., 2013). In our own previous work, we developed a speech-controlled automated matrix (SAMT) test that uses automatic speech recognition (ASR) for response logging. The system has been evaluated in a clinical setting with well-controlled acoustics settings in the laboratory (Ooster et al., 2018): This system was built to be used in a sound-isolated hearing booth where it is possible to record clean audio from the subjects’ responses. With an ASR system fine-tuned for the vocabulary of the matrix sentence test, very low error rates below 1% deletion errors and 3% insertion errors could be achieved using responses from 20 normal-hearing (NH) subjects and 7 mildly HI subjects. With such low error rates, the measurement reliability using ASR was not significantly different from the clinical test. Furthermore, detailed Monte–Carlo simulations of the measurement procedure and potential ASR errors showed that up to 7% deletion errors and 15% insertion are acceptable for an accurate measurement (i.e., in the range of the normal test–retest accuracy of the test when it is conducted by a human supervisor).
Speech-controlled automated matrix test uses an ASR-based setup for clinical environments, but it has not been designed for use at home. One example of a speech-in-noise test which already has been successfully implemented for screening purposes via telephone or headphones is the digit triplet test (De Sousa et al., 2020; Smits et al., 2006, 2013; Vlaming et al., 2011; Zokoll et al., 2012), which is also available as a smartphone-based measurement (Potgieter et al., 2016). The limitation to digits enables automated telephone testing since the subjects’ responses can be logged using the keypad of the telephone. However, it also limits the ecological validity of the test results as the words are not phonetically balanced and the linguistic variety is small.
Smart speakers, i.e., voice-controlled audio devices connected to a virtual assistant such as Amazon’s Echo, Apple’s HomePod, or Google Home also have the potential of increasing the accessibility of speech intelligibility tests by performing self-measurements at home, since they provide a good audio quality and have a built-in dialogue management system including an ASR component. There have been several approaches to use smart home systems for medical purposes, for example, to provide acoustic cues to support dementia patients’ memory (Boumpa et al., 2019) or to support elderly people in their physical therapy (Vora et al., 2017). The Apple ResearchKit (Apple Inc., 2016) features a speech-in-noise test that is similar to our approach but has not been compared with a standard audiological test in a clinical setting.
In this article, we present a smart speaker application for measuring the speech recognition threshold (SRT), i.e., the signal-to-noise ratio corresponding to 50% intelligibility, with the matrix sentence test. 1 Due to the increasing availability of smart speakers, an accurate screening procedure for hearing deficits could potentially lower the threshold for conducting tests for a large number of users and therefore have a positive effect on early provision of assistive hearing devices. In a previous pilot study, the smart speaker-based measurement was evaluated in a single office room with six young, NH listeners, where a similar performance to clinical laboratory results was found (Ooster et al., 2019). However, the reliability for HI subjects was not part of the previous study although this aspect is crucial for speech audiometry. Furthermore, in a real use case, the acoustic conditions in which the test is conducted can exhibit large variability which could also influence reliability.
To explore automated at-home hearing screening for such use cases, this study therefore compares clinical SRT measurements with SRTs obtained with a smart speaker application. Specifically, we analyze the errors and the resulting measurement reliability from the ASR system of a smart speaker in comparison to a calibrated clinical setup conducted by an expert; we also investigate potential decision thresholds for providing simple feedback to the user. These analyses are conducted for users with different degrees of hearing loss (HL) (ranging from young normal hearing to elderly, moderately HI listeners), performing the test in different acoustic conditions with the aim of quantifying the interaction of test accuracy, user group, and environment. Room acoustics are taken into account by simulating three different acoustic environments with different reverberation times which is realized through a room acoustic simulator.
Methods
This section presents an overview of the underlying principles of the matrix sentence test that are used in the smart speaker measurement as well as in the clinical reference measurement. We describe the implementation of this test as an application for the smart speaker and conclude with a description of the evaluation measurements as well as the data analysis performed on the measurement results.
Matrix Sentence Test
The speech audiometric test used in this study is the German matrix sentence test OLSA (short for its German name: OLdenburger SAtztest, English: Oldenburg sentence test; Wagener et al., 1999). The words of the stimulus sentences are randomly selected from a 5-by-10 word matrix in order to create sentences with the structure Name Verb Numeral Adjective Object. The stimulus material is arranged in lists of sentences with the aim of providing phonetically balanced listening tasks with similar intelligibility. This design choice results in a low test-to-retest standard deviation of 0.9 dB for HI subjects (Wagener & Brand, 2005) and 0.5 dB for NH subjects (Brand & Kollmeier, 2002). The NH reference values are
The Smart Speaker Application
An overview of the elements of the smart speaker application for the automated SRT measurement is shown in Figure 1 (adopted from Ooster et al., 2019). The setup differs from established clinical setups in several ways: (a) It uses synthesized speech instead of the original speech test recordings (which are protected by copyright), (b) when used at home, the sound is presented via the speaker in a reverberant environment, (c) the presented audio files are stored with lossy audio formats, and (d) the listener’s response is transcribed via ASR and not logged by an audiometrist. The application was implemented with the Alexa Skill Developer Kit in Python (Amazon Inc., 2018, version 1.10.2) and executed on an Amazon Echo loudspeaker (second generation). When the measurement application is started, the listener hears an instruction about the general measurement procedure and the structure of the hearing test. These instructions are based on the guidelines for the clinical application of the matrix sentence test (HörTech gGmbH, 2019). Since the subjects who participated in this study had no previous experience with smart speakers, they were told that the smart speaker is only listening when its optical indicator is active. During the measurement, the dialogue manager of the smart speaker uses the so-called intents. These define the intended actions a user wants to take with their spoken command and are defined by lexical patterns within our application that are matched to the ASR transcript. These intents trigger the next action when they are detected by the ASR component. The core intent of the measurement application is the response to a matrix stimulus sentence. The lexical patterns to invoke this intent are based on real responses obtained in previous work (Ooster et al., 2018), and the ASR engine of the smart speaker generalizes to variants of these responses. Based on this intent, the matrix test keywords in the subject’s response are collected, and the SNR for the next presentation is adapted based on the resulting score.
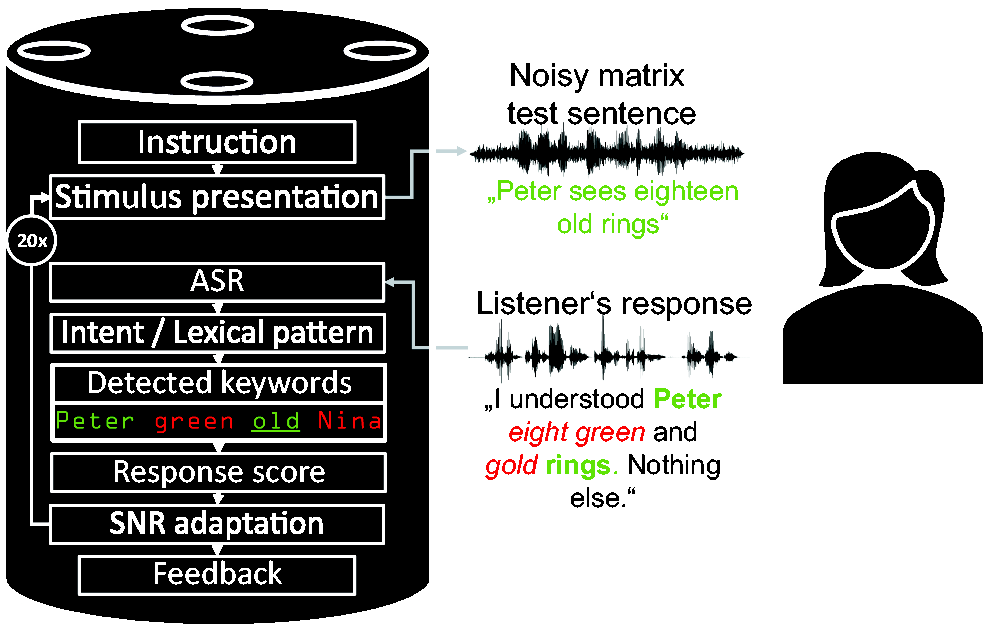
Overview of the Smart Speaker Measurement Application.
We used a synthesized version of the sentences from the female German matrix sentence test, which was evaluated in a previous study (Nuesse et al., 2019). In that study, the same 150 sentences from the original female stimulus speaker (Wagener et al., 2014) were synthesized, and the commercial synthesis provided by the Acapela Group was found to produce the best results (in terms of naturalness as well as SRT results when compared with the original speaker). After checking the SNR of the smart speaker output by re-recording stimuli with known SNR and analyzing them, all synthesized sentences were premixed with the speech-shaped noise at steps of 0.1 dB and converted to the MP3 data format (MPEG version 2, 48 kbps, 16 kHz) as required for playback through the smart speaker. The noise signal was generated in the same way as for the original test by superimposing the synthesized speech material.
Evaluation Measurements
The goal of the evaluation measurements is to investigate two major factors that could influence the measurement reliability of speech audiometry conducted with a smart speaker: The first is the degree of hearing loss since the measurement application on the smart speaker should produce valid test results for all users. The second is the influence of different room acoustics that might considerably vary for at-home measurements.
Subject Groups
The listener groups differ by their degree of hearing loss, and the listeners’ age was also taken into account to explore age-related effects. In total, four subject groups were considered: Groups 1 to 3 covered age-matched elderly listeners categorized according to their Pure Tone Average (PTA) criterion from 0.5 to 4 kHz (Mathers et al., 2001): (a) normal hearing (
Statistics of the Four Subject Groups Who Participated in the Evaluation.

Note. PTA = Pure Tone Average.
All subjects were paid for participating in this study. The audiogram of the better hearing ear for each of the subjects is shown in Figure 2. The hearing loss was symmetrical (

Individual Audiograms of the Better Hearing Ear of Our Subjects (Gray Lines) Together With the Average Audiogram for the Respective Subject Group (Black Lines). Note the different y-axis for the young normal-hearing listeners. The two dashed lines in the moderately hearing-impaired panel describe the audiogram from two subjects which had to be discarded from data analysis as explained in the Results section.
Test Conditions
The smart speaker measurements were conducted in a room referred to as Communication Acoustic Simulator (CAS) at the Hörzentrum Oldenburg. This room has a size of 12 m by 7 m by 2.8 m and uses 16 distributed microphones and 24 loudspeakers (12 flat wall-speakers and 12 two-way ceiling speakers) and a sound-regenerative Variable Room Acoustics System with a programmable microphone-to-speaker transfer function matrix to simulate different room acoustics. The subjects were seated at the center of the CAS with the smart speaker in front of them at a distance of 2 m. Before the actual measurement, the subjects were asked to adjust the volume of the speaker to a comfortable level with high intelligibility of the speech assistant’s voice; subjects were also allowed to change the volume of the speaker during the measurement.
To account for different acoustic conditions, rooms with different reverberation times T30 were simulated: Living Room (
The clinical reference measurements were performed in a soundproof room at the Hörzentrum Oldenburg using speech signals from the original German female matrix sentence test speaker (Wagener et al., 2014). After D/A conversion (converter ADI-8 Pro by RME, Haimhausen, Germany), the speech and speech-shaped noise signals were amplified (HB7 by Tucker-Davis) and both presented to the subjects from the frontal direction via a loudspeaker (Mackie HR 824 by LOUD technologies). The distance between the subject and the loudspeaker was 1.4 m. The level of the speech-shaped noise was calibrated to 65 dB SPL in the absence of the listener using a measurement microphone (type 4189 by Brüel and Kjær) at the position of the listener and a sound level meter (Modular Precision Sound Analyzer; model 2260 by Brüel and Kjær). The speech test was performed using the Oldenburg Measurement Applications (HörTech; version 2.0.1.0). Responses of the speech intelligibility test were given orally by the listeners and marked by the (human) experimenter on a touch screen not visible to the listener.
Before conducting the main measurements, the audiogram was recorded with an audiometer (Aurical by Natus) with Sennheiser HDA200 headphones in a sound isolated booth using the ascending method.
Measurement Procedure
The subjects were invited for two measurement sessions each with nine SRT measurement lists with 20 presented matrix sentences, as described in Table 2. The first two measurement lists from each session were used as training due to the strong training effect of up to 2 dB in the first two measurement lists, which results from the limited vocabulary of the stimulus material of only 50 different words (Wagener et al., 1999). To make training more efficient, the first ten sentences of the first list of each session were presented without additional noise, so that each subject heard and understood each possible word of the matrix test at least once before the adaptive procedure started. After the respective training, each subject conducted two measurement lists in each of the three room settings, resulting in twelve measurement lists in total with the smart speaker application as well as two clinical reference measurement lists (one at the end of each of the two measurement sessions). Whenever the room acoustic settings were changed, the subjects heard four random sentences at different SNRs so they could adapt to the new room characteristics and could adjust the speaker volume if needed.
Measurement Sequence During One of the Two Sessions for Each Subject.

Note. While the reference measurement with the clinical setup was always performed at the end of each session, the order of the room characteristics of the CAS during the smart speaker measurement was randomly chosen for each subject, i.e., each setting (Living Room/Poor Classroom/Concert Hall) correspond to A, B, or C. CAS = Communication Acoustic Simulator.
The young NH subjects only conducted one measurement session with four measurement lists (plus two training lists and the clinical reference) with the Living Room settings, since the results from the elderly subjects showed only a minor influence of the room acoustic settings on the measurement results.
At the end of each measurement session, all recorded audio files in the cloud of the smart speaker were deleted to avoid speaker adaptation of the ASR system. During the ASR-based measurements, a human supervisor recorded the subjects’ responses to obtain the ground truth of responses (assuming that the experienced human supervisor produced no errors when logging the reported words). This human transcript was later used to determine ASR errors as reported in the next section.
Data Analysis
The data from the measurements are evaluated in three different ways: First—in order to evaluate the SRT measurement reliability of the smart speaker-based measurement system—the SRT results from the measurements with the smart speaker (
SRT Measurement Accuracy
The main measures of reliability in this study are the intrasubject standard deviation and the bias between
Performance of the ASR System
The ASR transcription errors are estimated by comparing the transcript from the ASR system with the labels generated in parallel to the measurement by the human supervisor. Errors are quantified by two measures, the Score Insertion Rate (SIR) and the Score Deletion Rate (SDR), which only take into account the errors that could actually have an influence on the SRT scoring (either by inserting or deleting a matrix word). Out-of-vocabulary words are ignored with this metric (as they are in the clinical measurement). The SDR and the SIR that quantify the performance of the ASR system are defined by

SRT Decision Threshold for Providing User Feedback
To evaluate the performance of a decision threshold in terms of sensitivity and specificity, a potential value for a boundary is compared with three different reference decision criteria: (a) A deviation of the reference SRT measured with the clinical setup more than 1.96 standard deviations above the mean NH SRT, i.e., results outside the 95% percentile (which is the common approach for analyzing the result with the clinical setup), (b) a non-NH PTA (> 25 dB HL) based on the World Health Organization rules (Mathers et al., 2001), and (c) an audiogram-based indication for a hearing aid, which is in Germany given by a hearing loss of at least 30 dB in one of the audiogram frequencies between 500 Hz and 4 kHz (Gemeinsamer Bundesausschuss der Ärzte und Krankenkassen, 2012). In addition, the Youden-Index is derived which describes the ability of a decision threshold to separate the respective groups of data when sensitivity and specificity are equally weighted. To quantify how well the measure
Results
SRT Measurement Accuracy
Figure 3 describes the SRT measurement accuracy with the smart speaker application compared with clinically acquired reference estimates. This figure shows the difference in the SRT outcome obtained with the smart speaker application to the reference measurement against the average of these two values for all of the subjects. The data from two moderately HI subjects have been removed from the analysis since their spread of SRT results was exceptionally high (intrasubject standard deviation of 3.46 dB) and they reached SRTs above 10 dB. For the first excluded subject, the ASR errors were very high (

Bland–Altman Plot for Visualizing the Agreement Between Automated and Regular Test Conduction. The figure compares SRT differences between smart speaker and clinical measurement (measured in the same session) to the average of these two values. Data are shown for different subject groups (labeled with different shapes) and room characteristics (differentiated by color). In addition, the average difference between the two measuring methods (gray solid line) and the 95% percentiles (gray dashed lines) are shown. The young-NH subjects only conducted experiments in the living room condition. SRT = speech recognition threshold; NH = normal-hearing; HL = hearing loss.

Bias and Intrasubject Standard Deviations for All Elderly, Age-Matched Subjects for Different Room Configurations. The bias relates to the difference between clinical and automated measurements. A positive bias refers to a lower (better) SRT in the clinical measurement. SNR =signal-to-noise ratio.

Bias and Intrasubject Standard Deviations in the Living Room-Settings for the Different Subject Groups. Since the young NH subject group only conducted one measurement session with one reference measurement, the intrasubject standard deviation for this subject group in the reference setup cannot be estimated. NH = normal-hearing; HL = hearing loss; SNR = signal-to-noise ratio.
Performance of the ASR System
The ASR performance of the smart speaker for all subjects is shown in Figure 6. The SIR is quite low with an overall average of 1.9% (
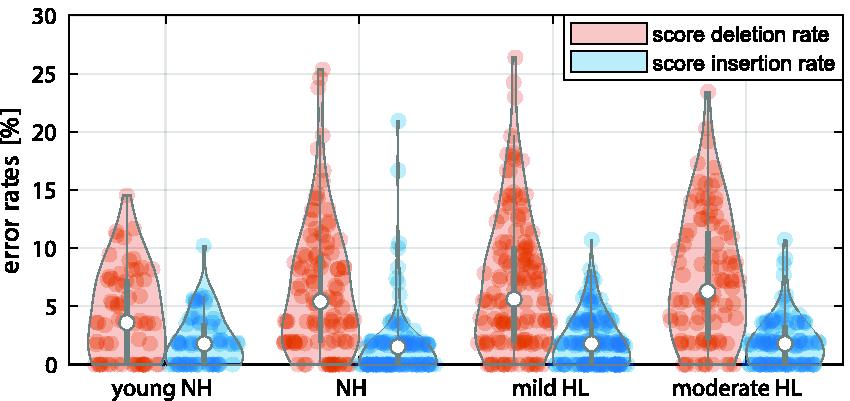
Violin Plot of the ASR System’s Performance From the Smart Speaker. The individual data points denote error rates of single measurement lists, each with 20 presented sentences; the width of the violin denotes the normalized histogram of the error rates. The median value and the interquartile range are denoted by white dots and the gray line, respectively. NH = normal-hearing; HL = hearing loss.
Furthermore, no significant difference was found in the SIR for different acoustic scenarios (two-sample t test, Bonferroni-adjusted,
SRT Decision Thresholds for User Feedback
Figure 7 compares a potential decision threshold based on the
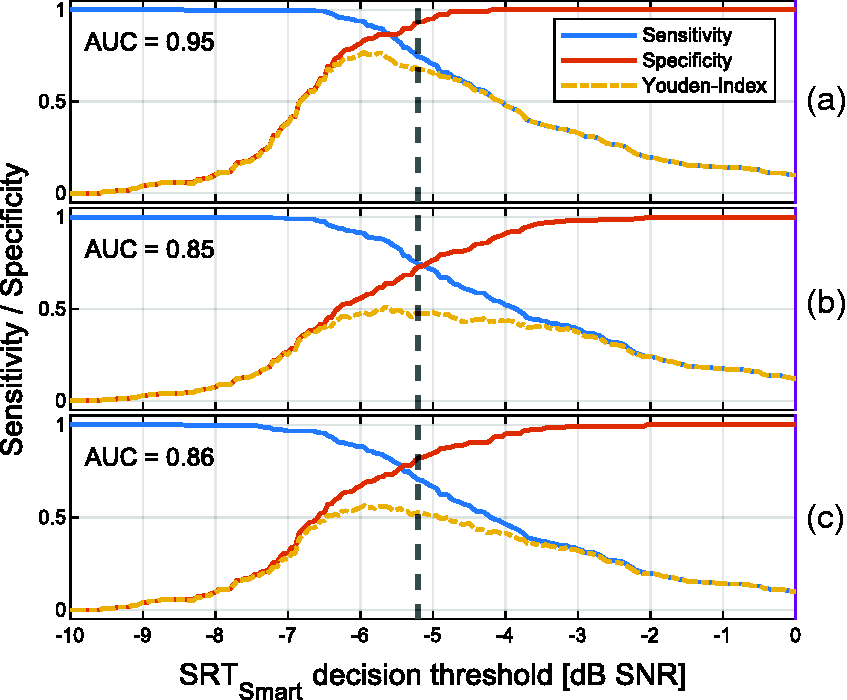
Sensitivity and Specificity for Analyzing How Well a Potential
Discussion
In this study, we investigated the SRT measurement reliability with a smart speaker-based application in three different acoustic conditions and with four different subject groups. First, we discuss the influence that errors made by the ASR system have on the measurement reliability. This is followed by the discussion of the overall SRT measurement reliability with the smart speaker application.
Effect of ASR Errors
In our previous study that investigated automated tests in a clinical setting (Ooster et al., 2018), we did not observe any significant decrease of the measurement reliability conditioned by the errors from the ASR system. Simulations regarding the overall influence of ASR errors on the SRT measurement accuracy in Ooster et al. (2018) matched well with the experimental findings. Even though these simulations are only based on NH SRT distributions, they are in principle valid for the smart speaker system explored in this study as well, since the tests are structurally identical and the same SNR adaptation scheme was used. On the one hand, the insertion errors are generally low (with an SIR of
Even though extreme settings in the CAS were selected to evaluate the influence of different room acoustics, we did not observe strong differences in terms of ASR errors for different acoustic conditions (error rates for concert hall and poor classroom was the only significant difference in terms of SDR). We assume that the simulated acoustics resulted in a reduced diffuseness compared with real room acoustics, which could result in an underestimation of SRTs in that environment (i.e., SRT could appear as too good), although the simulated rooms appear to be very convincing.
For the best-performing group of young, NH listeners, average error rates up to 4% are obtained, which is quite high given the simple vocabulary. This can presumably be attributed to the missing fine tuning of the Alexa-based ASR back end and the overall challenging acoustic conditions with a distance of 2 m between subject and smart speaker. Compared with these younger subjects, the error rates for elderly listeners are significantly elevated (Figure 6). However, the degree of hearing-impairment does not affect the ASR component, i.e., there is no significant difference in the ASR errors between the different groups of hearing-impairment within the elderly listeners in our data. We speculate the experience in human–machine interaction to be the underlying reason for the contrast between young and old participants and for the generally elevated intrasubject standard deviations: For instance, longer pauses in responses triggered the end-point detection of the smart speaker, and the remainder of the response will be ignored, which in turn could result in an undesired SNR increase for the next test item. Experienced users of speech-based interfaces would probably adapt to the machine listener (as we already observed to some extent during the measurements of this study), and therefore our scoring results could represent a conservative estimate with respect to errors through user behavior. Long-term measurements with the same group of listeners should be conducted to test this hypothesis. Furthermore, we observed a few terminations of the measurement application when the next action was not triggered although the subject responded with words from the matrix sentence test, since the ASR system from the smart speaker did not recognize any of the words in the subject’s response correctly as matrix sentence words. This happened in about nine measurement lists from six different elderly listeners (one NH, four with mild HL, and one with moderate HL) among the overall 424 conducted measurement lists with the smart speaker. In that case, the subjects had to restart the measurement from the beginning.
Major companies that develop and sell smart speakers use distributed data processing, i.e., the ASR is performed in the cloud, in this case on servers from Amazon. These companies regularly update the ASR back end, over which developers and end users have no control. In theory, such an update could have a huge negative impact on the recognition of the matrix words, and the measurement accuracy described with the current setting could not be reached. However, changes to the back end are generally driven by the desire to increase the robustness and reliability of the system; it therefore seems unlikely to us that changes to the back end would reduce recognition performance; it appears to be more likely that future optimizations will improve ASR and therefore reduce the test bias and its standard deviation. Similarly, the smart speaker’s synthesized voice is used to describe the testing procedure to the listener, and developers also have no control over this component of the speech interface. For the actual test conduction described in this article, this does however not play a role since we used synthesized clean and noisy speech samples that were uploaded as part of the application, so this part remains unaltered even when the server-side synthesis is changed.
Bias and Reliability of SRT Measurements
The young NH subjects average SRTReference of (
For the smart speaker measurements, the presentation level is not calibrated to a specific level, and the individual noise and speech levels could not be controlled for at all (as explained in the Methods section), which seems not to be crucial and is in line with previous studies: Wagener and Brand (2005) did not measure a significant influence of the presentation level on the SRT result (for levels that are clearly above the hearing threshold).
Note that all measurement reliability results are based on the measurement list after two training lists and there can be a training effect of up to 2 dB in the first two measurement lists (Wagener et al., 1999). This training effect can be a drawback for a screening procedure, as it increases the required measurement time to reach the optimal result. However, training will always reduce the SRT, i.e., an SRT result below the decision threshold is already valid after the first measurement. If the result exceeds the threshold, the system will therefore recommend to repeat the measurement up two times, so test users will learn the matrix test vocabulary while they are performing the screening.
Deriving User Recommendations from SRT Values
The 95% percentile criterion derived from the young NH data is used to analyze the recommendation outcome of the smart speaker-based measurement. The corresponding threshold is compared with different reference criteria based on the reference SRT measured with the clinical setup or the audiogram (which is only indirectly related to the measured SRT).
Overall, the smart speaker measurement shows a good classification performance with an AUC of 0.85 for predicting a PTA > 25 dB HL and an AUC value of 0.86 for predicting a hearing aid indication (cf. Figure 7(b) and (c)). This is slightly higher than the observed prediction performance of the telephone-based German digit triplet test for which an AUC value of 0.82 was observed on 1903 listeners for predicting a PTA > 25 dB HL and an AUC value of 0.76 for predicting a hearing aid indication (von Gablenz et al., 2014). For the computer-based headphone conduction of the English digit triplet test, an AUC value of 0.95 was found for 20 NH and 20 HI listeners (Folmer et al., 2017) for predicting a PTA > 25 dB HL, whereas De Sousa et al. (2020) could increase the AUC from 0.78 with diotic stimuli in a smartphone-based headphone presentation to 0.94 with antiphasic stimuli on 145 listeners.
The prediction performance reported in this article can also be compared with other speech audiometric tests: Smits et al. (2004) found an AUC of 0.97 with the digit triplet test in comparison to the Plomp sentence test (Plomp & Mimpen, 1979) with 38 subjects tested with headphones, and von Gablenz et al. (2014) measured an AUC of 0.70 when comparing the digit triplet test over telephone to the Göttinger sentence test (Kollmeier & Wesselkamp, 1997) in a clinical setup. Therefore, the overall classification performance of the smart speaker-based measurement can be rated high with an AUC of 0.95 (cf. Figure 7(a)) for detecting a clinical elevated SRT.
Limitations of This Study
An important limitation of this study is that experiments were conducted in a laboratory environment with simulated room acoustics. Even though the small influence of the different simulated acoustics seems promising, future evaluations should take into account environments such as the private homes of the listeners with their respective real room acoustics for capturing the full variability of real-life scenarios. Furthermore, even though all the instructions for the test were given by the smart speaker application, a human supervisor was always present during the measurement which could have influenced the behavior of the listeners. The listeners who participated in this study were naive users of such a smart speaker. Experienced users potentially can profit from two training effects, i.e., adaptation of the speaker to its main user (which would decrease ASR errors) and secondly a training of the user, since long-term users of speech assistance presumably learn how to best interact with a virtual assistant (thereby avoiding incorrect end-point detection). Finally, the threshold defined in this article was obtained from measurements performed after training. For untrained listeners, the number of false positives should be higher compared with the presented values, and at the same time the number of false negatives should be lower. It is therefore important to note that the decision boundaries derived from our experiments are valid for trained listeners only. In the smart speaker application, this is considered by recommending a repetition of the test (which effectively trains the users).
Conclusions
This article introduced smart speaker-based speech audiometry with the matrix sentence test. We presented results for young and older listeners with different degrees of hearing loss in three different simulated room acoustic conditions. For the different simulated room acoustics, we observe only small differences in the measured SRTs and the performance of the smart speaker’s ASR system. The different listener groups showed a slightly decreased measurement reliability in terms of intrasubject standard deviation in comparison to results with the clinical version in the literature. The ASR performance is significantly worse for elderly listeners, which appears to be the main source of the reduced reliability. However, the main limitation for obtaining accurate SRT results is a varying bias between the listener groups, which ranges from + 0.7 dB for elderly moderately HI listeners up to + 2.2 dB for young NH listeners. Nevertheless, the data presented in this article support the conclusion that smart speaker-based speech audiometry can reliably detect a deviating SRT in a self-guided manner at home since the receiver operating characteristic analysis showed an AUC of 0.95 for detecting a deviating clinical SRT, where the 95% percentile threshold based on the young NH data results in 93% sensitivity and 74% specificity. The smart speaker-based speech audiometric testing therefore seems promising for complementing clinical tests with the advantage of at-home screenings.
Footnotes
Acknowledgments
The authors would like to thank Inga Holube and Theresa Nüsse for providing the synthesized matrix test stimulus sentences as well as Timmy Kröger and Dirk Eike Hoffner for their help with the conduction of the evaluation measurements. Data from a pilot study (covering responses from 15 listeners compared with 46 listeners presented here) have been presented at the ISAAR symposium 2019 in Nyborg (Ooster et al., 2020).
Declaration of Conflicting Interests
The authors declared no potential conflicts of interest with respect to the research, authorship, and/or publication of this article.
Funding
The authors disclosed receipt of the following financial support for the research, authorship, and/or publication of this article: This work was funded by the Deutsche Forschungsgemeinschaft (DFG, German Research Foundation) under Germany’s Excellence Strategy—EXC 2177/1 (Hearing4all)—Project ID 390895286 and the CRC TRR 31, Transfer Project T01.