
Abstract
The efferent system may control the gain of the cochlea and thereby influence frequency selectivity. This effect can be assessed using contralateral stimulation (CS) applied to the ear opposite to that used to assess frequency selectivity. The effect of CS may be stronger for musicians than for nonmusicians. To assess whether this was the case, psychophysical tuning curves (PTCs) were compared for 12 musicians and 12 nonmusicians. The PTCs were measured with and without a 60-dB sound pressure level (SPL) pink-noise CS, using signal frequencies of 2 and 4 kHz. The sharpness of the PTCs was quantified using the measure Q10, the signal frequency divided by the PTC bandwidth measured 10 dB above the level at the tip. Q10 values were lower in the presence of the CS, but this effect did not differ significantly for musicians and nonmusicians. The main effect of group (musicians vs. nonmusicians) on the Q10 values was not significant. Overall, these results do not support the idea that musicianship enhances contralateral efferent gain control as measured using the effect of CS on PTCs.
Musically trained subjects tend to perform better than nonmusicians on a variety of auditory tasks, especially pitch-related tasks (Fine & Moore, 1993; Kishon-Rabin et al., 2001; Micheyl et al., 2006; Soderquist, 1970; Tarnowska et al., 2019; Zendel & Alain, 2009). This probably depends at least partly on auditory processing at relatively high levels in the auditory pathway, especially the auditory cortex (Bianchi et al., 2017; Ellis et al., 2012; Herholz & Zatorre, 2012; Schlaug et al., 1995). However, there is some controversy about the extent to which musical training can affect aspects of auditory processing that are assumed to depend on more peripheral processes, such as frequency selectivity and efferent control of cochlear gain (Bidelman et al., 2014, 2016, 2017; Moore et al., 2019; Perrot & Collet, 2014).
The discrimination and detection of auditory stimuli presented to one ear can be affected by presentation of a noninformative stimulus to the other ear, that is, by contralateral stimulation (CS; Guinan, 2006, 2018; Perrot & Collet, 2014). This effect is believed to be mediated by activation of the medial olivocochlear (MOC) efferent system (Collet et al., 1990; Guinan, 2006, 2018). CS can result in suppression of otoacoustic emissions (OAEs; Kemp, 1978) and can change psychophysical tuning curves (PTCs) measured in simultaneous masking (Chistovich, 1957; Moore, 1978), making them slightly less sharp for signal frequencies of 2 and 4 kHz (Bidelman et al., 2016; Vinay & Moore, 2008; Wicher, 2013; Wicher & Moore, 2014). The effect is smaller and varies across studies for a signal frequency of 1 kHz (Vinay & Moore, 2008; Wicher, 2013; Wicher & Moore, 2014). However, one study showed an effect of CS on PTCs measured in forward masking for a signal frequency of 0.5 kHz but not for a signal frequency of 4 kHz (Aguilar et al., 2013). Note also that attention may influence the operation of the MOC system; the suppression of OAEs by CS is greater for frequencies on which attention is focussed than for nonattended frequencies (Maison et al., 2001).
Perrot and Collet (2014) reviewed studies comparing the effects of CS for musicians and nonmusicians. Several studies showed that the suppression of transient OAEs (TOAEs) by CS was greater for musicians than for nonmusicians (Brashears et al., 2003; Micheyl et al., 1995; Perrot et al., 1999). Bidelman et al. (2017) compared the effect of CS on distortion-product OAEs (DPOAEs) for classical musicians and nonmusicians. They reported that the CS (a broadband noise) reduced the level of DPOAEs for both musicians and nonmusicians, but the reduction was significant only for the musicians. Kumar et al. (2016) assessed the effect of CS on both TOAEs and DPOAEs for rock musicians and nonmusicians. For the TOAEs, the effect of the CS was larger for the musicians than for the nonmusicians for four out of the five center frequencies that were assessed. For the DPOAEs, the effect of the CS was larger for the musicians than for the nonmusicians for only two out of the five center frequencies, and none of the differences would have been significant if the significance level had been adjusted to allow for multiple comparisons. In any case, interpreting the results for rock musicians is complicated because the very high sound levels that they have typically been exposed to (which are higher than for classical musicians) can adversely affect the functioning of the cochlea. Overall, data obtained using OAEs broadly support the idea that the effect of CS is greater for musicians than for nonmusicians.
The present study assessed whether there were differences between musicians and nonmusicians in the effect of CS on a behavioral measure of frequency selectivity, namely PTCs. To do this, PTCs measured with and without CS using pink noise were compared for musicians and nonmusicians. The strength of contralateral efferent suppression was estimated using the change in sharpness of tuning of the PTCs produced by the CS.
It has been reported that the effect of CS on TOAEs is greater when the evoking stimulus is presented to the right ear and the CS is presented to the left ear than vice versa (Bidelman & Bhagat, 2015; Khalfa et al., 1998), although such an effect has not always been found (de Oliveira et al., 2011). The asymmetry, when present, appears to be similar for musicians and nonmusicians (Perrot et al., 1999), although Brashears et al. (2003) found a nonsignificant trend for the effect of the CS to be greater for musicians than for nonmusicians when the CS was presented to the left ear. We are not aware of any studies assessing the effects of ear of presentation of the CS on behavioral measures of frequency selectivity, or assessing whether any asymmetry differs for musicians and nonmusicians. A second aim of our study was to assess the effect of ear of presentation of the CS on PTCs and to compare it for musicians and nonmusicians.
It has been reported that musicians have sharper auditory filters than nonmusicians for a center frequency of 4 kHz, as assessed using PTCs (Bidelman et al., 2014, 2016). However, Moore et al. (2019) did not find any effect of musicianship on the sharpness of auditory filters centered at 4 kHz, as measured using three methods, including PTCs, and other studies have found no effect of musicianship on the sharpness of the auditory filter for lower center frequencies (Fine & Moore, 1993; Oxenham et al., 2003). Given the mixed nature of the outcomes, a third aim of this study was to compare the sharpness of PTCs for musicians and nonmusicians, using signal frequencies of 2 and 4 kHz.
In summary, the aims of this study were (a) to compare the effect of CS on the sharpness of PTCs for musicians and nonmusicians, (b) to assess whether there is any ear asymmetry in the effect of the CS and whether it differs for musicians and nonmusicians, and (c) to compare the sharpness of tuning of PTCs for musicians and nonmusicians.
Method
Selection of Subjects
There were 12 musicians (Group M: 10 female and 2 male) and 12 nonmusicians (Group NM: 6 female and 6 male). Subjects in Group M were students of the Ignacy Jan Paderewski Academy of Music in Poznań (11 subjects) or postgraduates in a music school (1 subject). Their ages ranged from 19 to 29 years (mean = 24.4 years, standard deviation [SD] = 1.7 years). One subject played the piano, and the rest were violin or/and viola players. They started formal music education no later than 8 years of age (mean = 6.5 years, SD = 0.7 years), and they were active musicians. The average duration of musical training was 17.3 years (SD = 2.2 years). Subjects in Group NM had never played any instrument (9 subjects) or had played as amateurs for less than 3 years, starting not earlier than 16 years of age and playing no longer than 2 hr per day during the period when they played (3 subjects). Their ages ranged from 19 to 29 years (mean = 24.6 years, SD = 3.4 years). There was no significant difference in age between the two groups.
Audiometric thresholds were measured using an Interacoustics (Middelfart, Germany) AC40 clinical audiometer with Telephonics (Huntington, NY, USA) TDH 39 P headphones, using the method recommended by the British Society of Audiology (2011). All subjects had audiometric thresholds better than 20 dB HL over the frequency range 500 to 4000 Hz. Audiometric thresholds averaged over the range 125 to 8000 Hz were 8 dB HL (SD = 6.4 dB) for Group M and 7.2 dB HL (SD = 6.3 dB) for Group NM. The audiometric thresholds did not differ significantly across the two groups. As a check that cochlear outer hair cell function was normal, DPOAEs were measured over the frequency range 1000 to 10000 Hz using an Interacoustics Titan system. The signal-to-noise ratio was greater than 6 dB for all subjects, indicating normal outer hair cell function (Robinette & Glattke, 2007). The Titan system was also used to measure tympanograms. All subjects had Type A tympanograms, indicating normal middle-ear function. No subjects reported any history of auditory processing disorder or other disorders that might affect auditory processing (e.g., dyslexia, attention deficits). Subjects were paid for their participation.
The study received ethical approval from the Ethical Committee of Adam Mickiewicz University (Approval No. 18/2016). All subjects gave written informed consent to participate.
Choice of the CS
The CS was a broadband (20 to 20000 Hz) pink noise with an overall level of 60 dB SPL. Broadband noise is more effective in activating the MOC efferent system than narrowband noise (Lilaonitkul & Guinan, 2009; Wicher & Moore, 2014). A pink noise was used rather than a white noise because for center frequencies above 1000 Hz, a pink noise produces roughly a constant level at the output of each auditory filter (Glasberg & Moore, 1990), whereas a white noise produces a level that increases with increasing center frequency. The level of the pink noise was chosen to be high enough to excite the MOC efferent system while not activating the middle-ear reflex (Liberman & Guinan, 1998). The CS used here has been shown to have significant effects on DPOAEs and on PTCs (Wicher & Moore, 2014).
Measurement of PTCs
We chose to use signal frequencies, fs, of 2 and 4 kHz, as previous research has shown that CS consistently results in a broadening of simultaneous-masking PTCs for these signal frequencies, whereas the effects for lower signal frequencies are absent or less consistent (Vinay & Moore, 2008; Wicher, 2013; Wicher & Moore, 2014). Also, Scharf et al. (1997) showed that frequency selectivity measured in simultaneous masking using the notched-noise method (Patterson, 1976) for a signal frequency of 1 kHz was not markedly different across the two ears of patients who had had the MOC system severed on one side to treat severe vertigo, suggesting that the efferent system does not markedly influence the frequency selectivity of the auditory system at 1 kHz.
PTCs were measured using the SWPTC software (Sek & Moore, 2011). This software implements a fast method employing a narrowband noise masker that is slowly swept in center frequency from a low to a high value, or vice versa. Stimuli were generated using a Dell (Round Rock, TX, USA) Inspiron 7000 series PC with Conexant (Irvine, CA, USA) SmartAudio sound card with 16 bit resolution and a sample rate of 44.1 kHz. Stimuli were presented via Sennheiser (Wedemark, Germany) HD600 headphones. The signal was a pulsed sinusoidal tone with 300-ms duration (including 20-ms rise–fall times) and an interval of 200 ms between pulses. The use of a pulsed signal helps the subject to “know what to listen for.” The signal was presented 15 dB above the absolute threshold estimated using a forced-choice method. The values of fs were 2 and 4 kHz.
The masker was a continuous narrowband noise with a bandwidth of 320 Hz. The bandwidth was chosen to reduce the salience of beats as a cue while limiting the masker bandwidth to be close to or less than the auditory filter bandwidth at the signal frequency (Kluk & Moore, 2004, 2005). The level of the noise required just to mask the signal was determined as a function of the masker center frequency, fc, using a procedure similar to that used in Békèsy audiometry (von Békésy, 1947). Initially, subjects were presented with several pulses of the signal without the masker to help them to “know what to listen for.” After these initial pulses, the masker was turned on. The starting level of the masker was 50 dB SPL. The subjects were instructed to press the space bar on the keyboard when the signal was audible and to release the space bar when the signal was inaudible. While the space bar was pressed, the level of the noise increased at a rate of 2 dB/s. While the space bar was released, the level decreased at the same rate. This rate was chosen to avoid more variable PTCs that can occur with higher rates of change in masker level (Sek et al., 2005). The value of fc was swept logarithmically from 0.5fs to 1.5fs (upward sweep) over a duration of 180 s.
Before starting the experiment proper, subjects received about 30 min of practice in performing the PTC task. For each subject, PTCs were measured for each ear separately, in the presence and absence of CS. For each condition (combination of selected ear, signal frequency, and presence/absence of CS), five PTCs were obtained within a test session. The different conditions were tested on different days in random order. The first PTC determined for each condition was treated as practice and excluded from analysis. Each of the four remaining PTCs for a given condition was fitted using a rounded-exponential function for each side of the PTC (Patterson & Nimmo-Smith, 1980; Sek & Moore, 2011), and the overall sharpness of the PTC was estimated from the fitted rounded-exponential functions, using the measure Q10, which is the signal frequency divided by the bandwidth measured 10 dB above the level at the tip.
Fast PTCs have a jagged shape, reflecting the increases and decreases in masker level as the subject releases and presses the space bar. Each PTC was initially smoothed by calculating the means of two successive turnpoints in masker level, referred to as the two-point moving average (TPMA). An initial estimate of the tip frequency was taken as the frequency at which the masker level was lowest, fmin, based on the TPMA. This initial estimate was used to determine which points fell on the low side and which points fell on the high side of the PTC. For the lower side of the PTC, the roex function was fitted to the TPMA over the frequency range 0.75fmin to fmin. For the upper side of the PTC, the roex function was fitted to the TPMA over the frequency range fmin to 1.3fmin. The fitting procedure gave estimates of parameters pl and pu that characterize the lower and upper slopes of the main passband of the filter. The Q10 values were calculated approximately (Hartmann, 1997; Patterson et al., 1982) as Q10 = pl × pu/[3.9 × (pl + pu)].
Results
Example PTCs, together with the roex functions fitted to each side, are shown in Figure 1. It can be seen that the roex functions captured the general shapes of the PTCs around their tips. Note that the roex functions were fitted over a frequency range that did not include the low-frequency tails of the PTCs. Note also that the tips of the PTCs fell slightly above the signal frequency. This often occurs when fc is swept from a low to a high frequency (Sek et al., 2005), as was done here. The tips of the PTCs are usually shifted downward when fc is swept from a high to a low frequency (Sek et al., 2005).

Typical Examples of Fast PTCs Together With the Roex Functions Fitted to Each Side. The black circles indicate the signal frequency and level. The examples on the left are taken from Group M, and those on the right are taken from Group NM. The signal frequency was 2000 Hz for the top row and 4000 Hz for the bottom row.
The four estimates of Q10 for each subject and each condition had an SD that ranged from 0.18 to 1.55 for Group M and from 0.13 to 1.41 for Group NM. The root-mean-square value of the SD across the four values was 0.30 for both groups. Hence, the typical SD of the mean of the four Q10 estimates was ⇃0.3 = 0.21. This indicates good consistency of the Q10 estimates within subjects.
The grand mean Q10 value across all conditions and groups was 4.61. The variance of the Q10 values within each group for a given condition averaged 0.33 for Group M and 0.31 for Group NM. This means that a typical value of the SD across subjects within each group for a given condition was ⇃0.32 = 0.57. Given that there were 12 subjects in each group, for a given condition, we had a power of 0.8 of detecting a difference between groups of 0.65, that is, about 14%, at p = .05.
Figure 2 shows the means and standard errors of the Q10 values of the PTCs for each condition and each group. A mixed analysis of variance was conducted on the Q10 values with between-subjects factor group (M or NM) and within-subjects factors signal frequency (fs), CS on/off, and ear of presentation of the PTC stimuli (L or R). The main effect of group was not significant, F(1, 22) = 1.85, p = .19. There was a significant effect of fs: F(1, 22) = 30.49, p < .001. The mean Q10 value was lower for fs = 2000 Hz (4.33) than for fs = 4000 Hz (4.88). There was a significant effect of the presence/absence of the CS: F(1, 22) = 43.83, p < .001. The mean Q10 value was lower when the CS was on (4.38) than when it was off (4.84). There was no significant effect of ear of presentation, F(1, 22) = 0.19, p = .67, and no interaction of ear of presentation with any other factor.
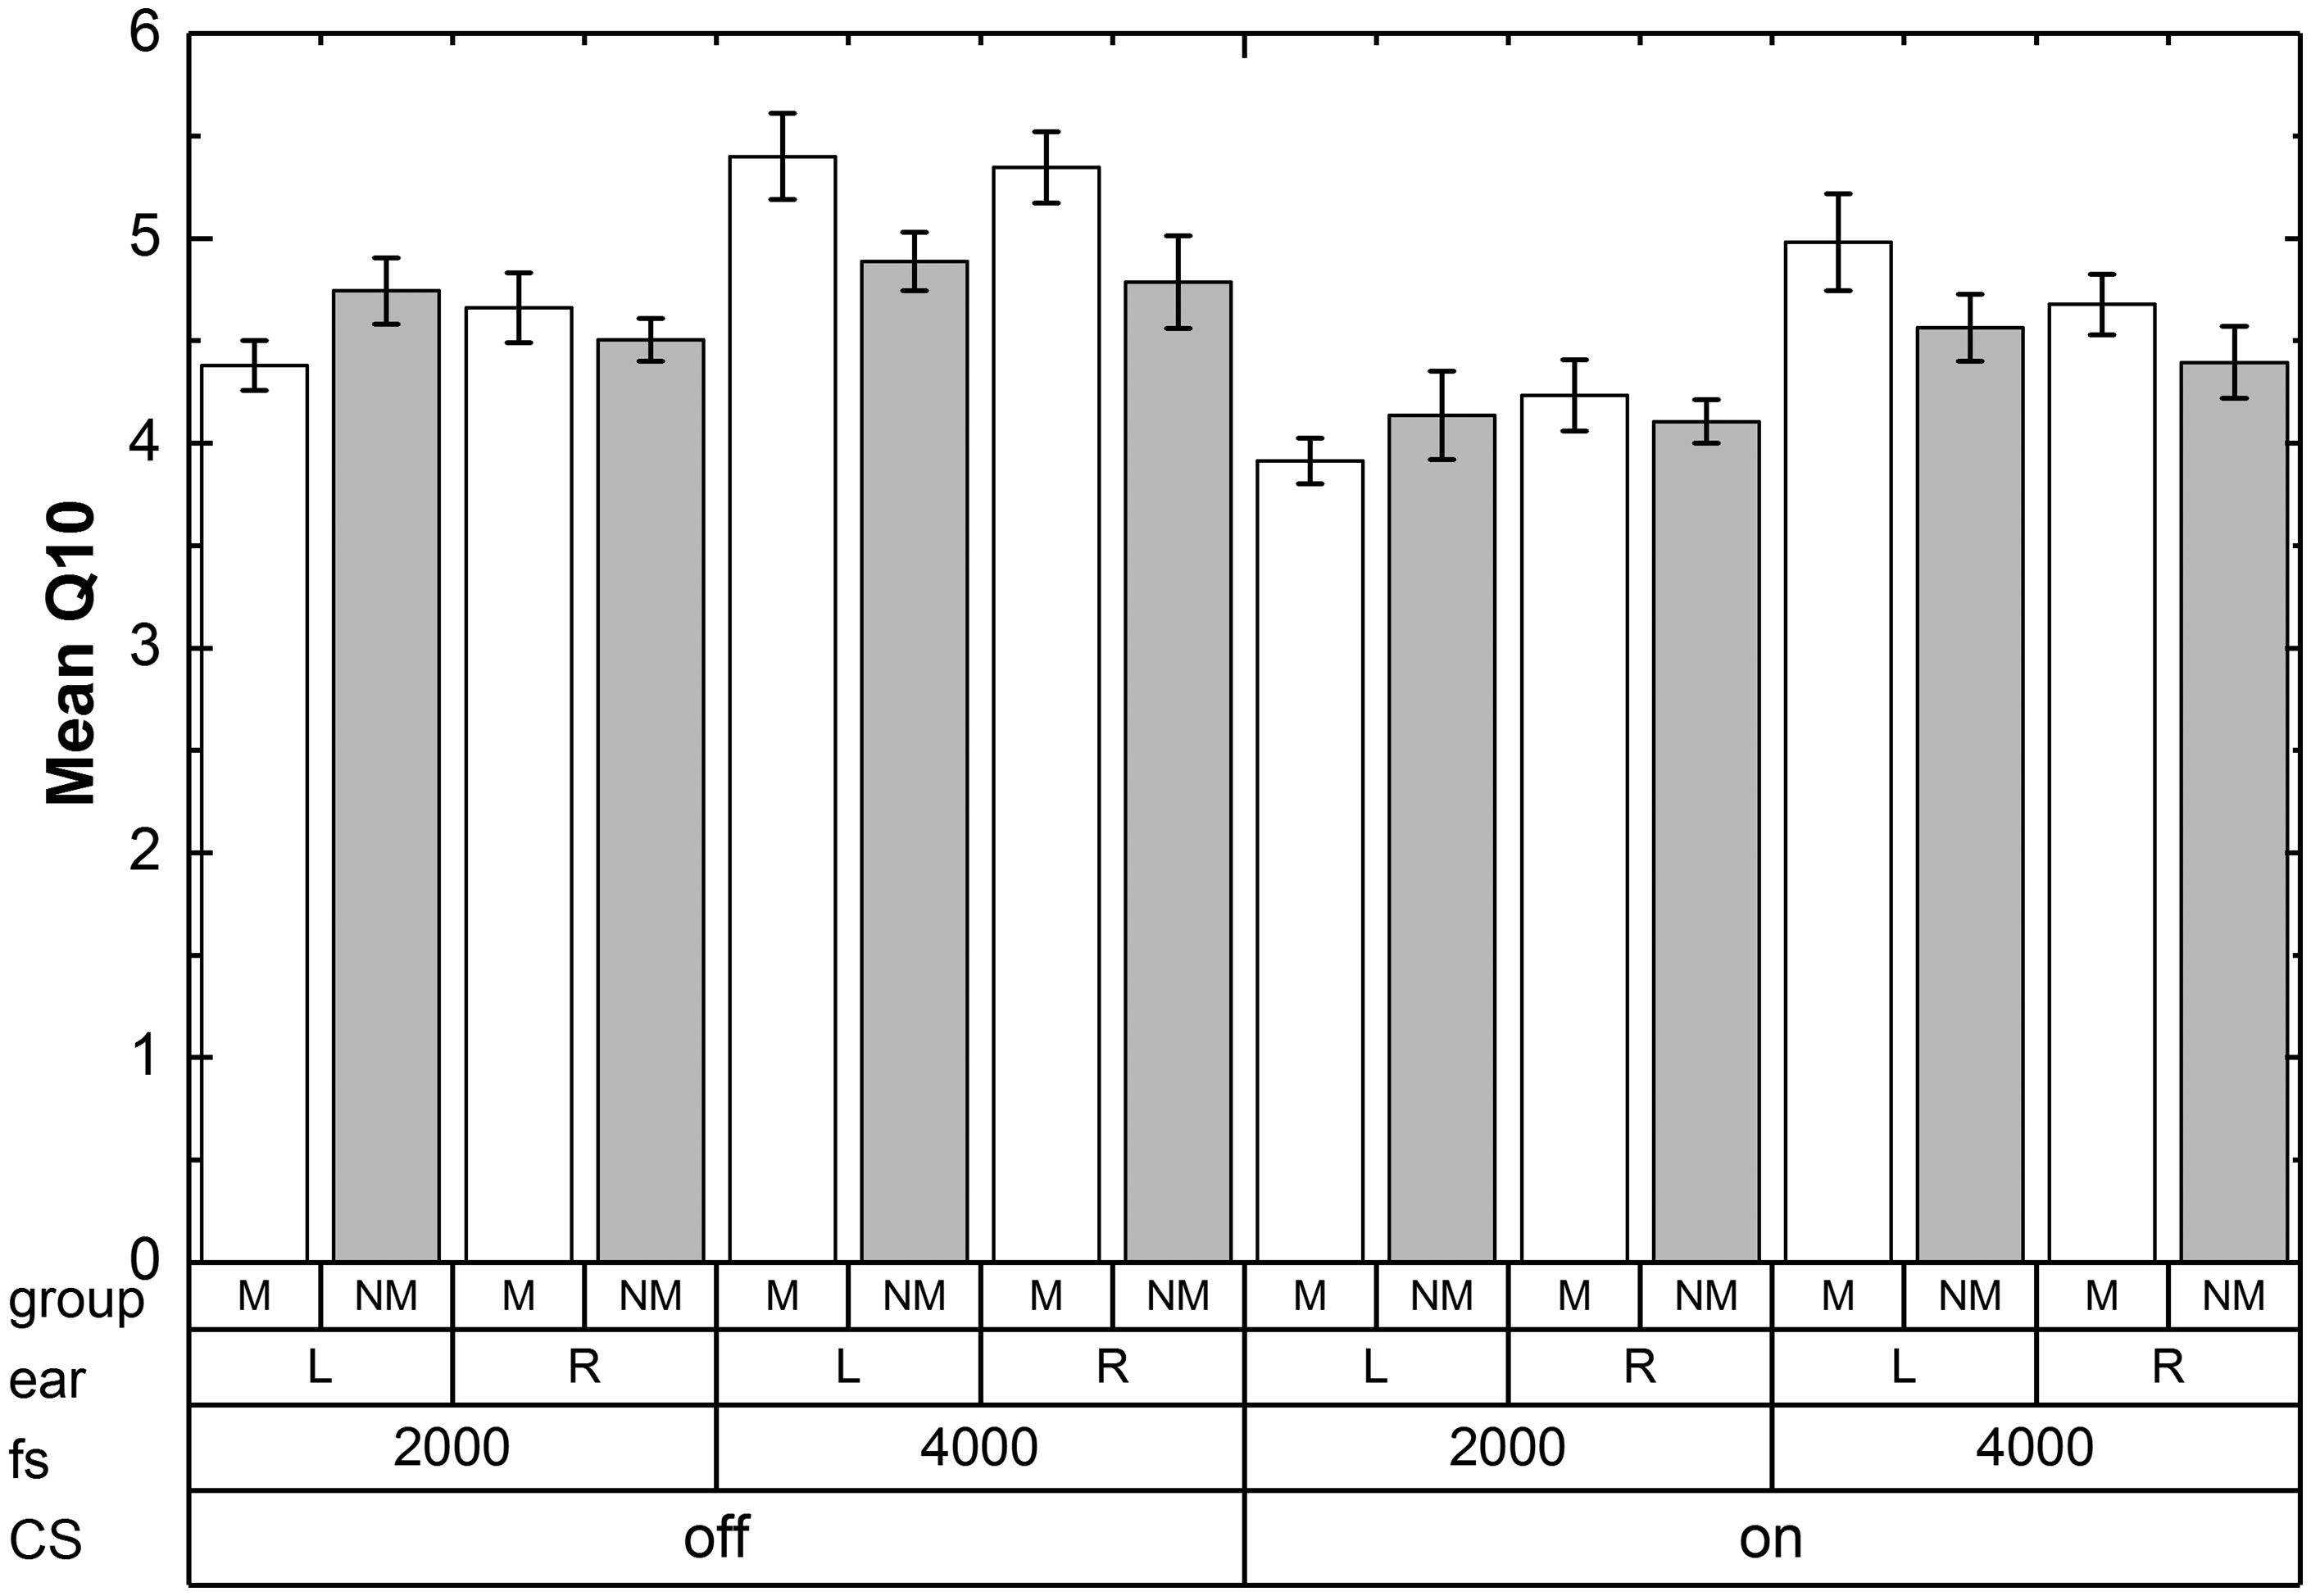
Means of the Q10 Values of the PTCs for Each Condition and Each Group. Open bars denote results for Group M, and shaded bars denote results for Group NM. The signal frequency is denoted as fs. Error bars indicate ±1 standard error of the mean.
There was a significant interaction of group and fs: F(1, 22) = 6.91, p = .015. To illustrate this interaction, the data were averaged across ear of presentation and plotted separately for each value of fs. For fs = 2000 Hz (Figure 3, top), the mean Q10 value was slightly lower for Group M than for Group NM (4.30 vs. 4.37), while for fs = 4000 Hz (Figure 3, bottom), the mean Q10 value was slightly higher for Group M than for Group NM (5.10 vs. 4.66). However, the differences between groups were small and accounted for only 7% of the variance in the data. No other interactions were significant. In particular, there was no significant interaction of group and the presence/absence of the CS, F(1, 22) = 0.21, p = .65. Thus, the effect of the CS did not differ for the two groups, as can be seen from Figures 2 and 3. The mean change in Q10 between CS off and CS on was 0.50 for Group M and 0.43 for Group NM.
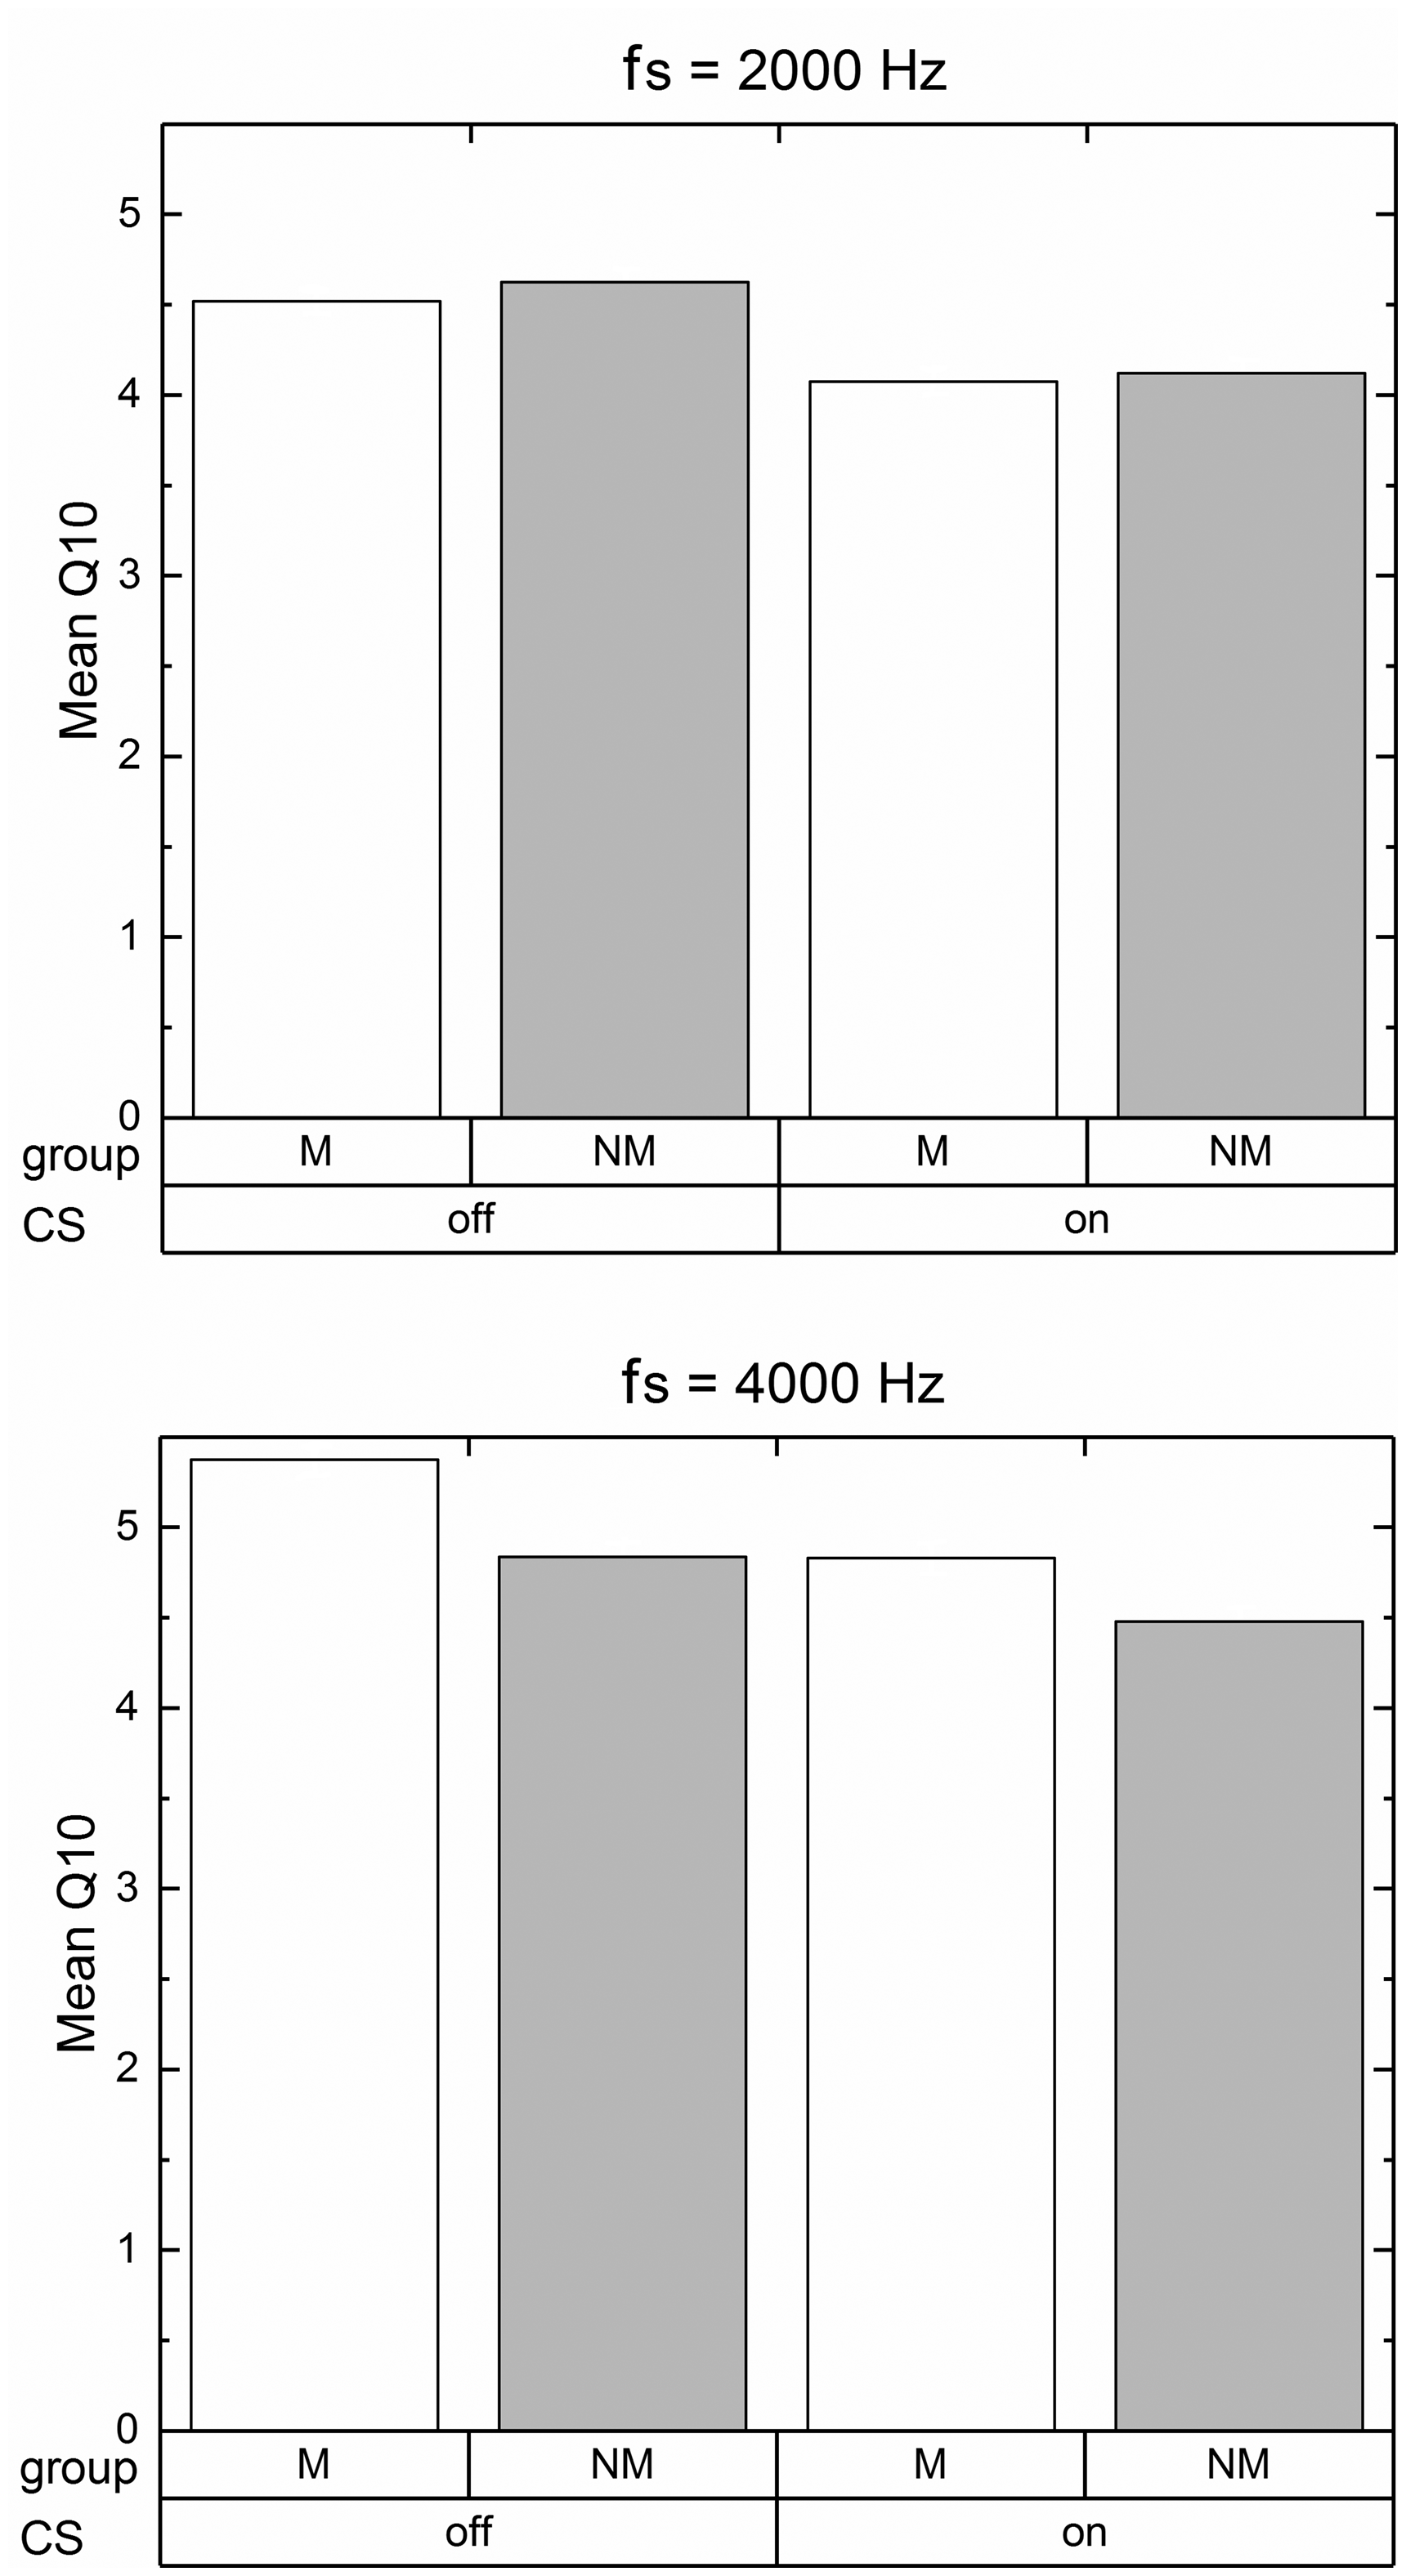
Means of the Q10 Values of the PTCs. The results were averaged across ear of presentation for the signal frequencies of 2000 Hz (top) and 4000 Hz (bottom).
Discussion
The Q10 values of the PTCs did not differ significantly overall for Groups M and NM. There was a significant interaction between center frequency and group membership, the mean Q10 value at 4 kHz being slightly greater for Group M than for Group NM (5.10 and 4.66, respectively). This trend is in the same direction as reported by Bidelman et al. (2014, 2016). The mean Q10 values found here at 4 kHz in the absence of CS (5.37 for Group M and 4.84 for Group NM) are similar in overall magnitude to those for the fast PTCs obtained by Bidelman et al. (2014), except that they found a slightly higher mean value for 10 musicians (about 6.0) and a slightly lower mean value for 9 nonmusicians (about 4.5). However, Bidelman et al. (2016) obtained a markedly higher mean Q10 value of about 10 for 14 musicians, while the mean Q10 for 13 nonmusicians was about 6. The mean Q10 values reported by Moore et al. (2019) were similar to those found here, their means being 5.5 for musicians and 5.3 for nonmusicians. Bidelman et al. (2016) reported a significant correlation between Q10 values and years of musical training (their musically trained subjects had a mean of 14.4 years of formal instruction on the principal instrument, with an SD of 3.6 years). For our Group M, there was no significant correlation between Q10 values and years of musical training (r = .0276, p = .932), but our subjects had a smaller range of years of musical experience: mean = 17.3 years, SD = 2.2 years. Overall, the results suggest that if there is a difference between musicians and nonmusicians in the Q10 values of fast PTCs, the difference is small compared with the variability within groups. Any small group differences that do exist may reflect differences in the ability to make optimal use of the available detection cues, as discussed by Moore et al. (2019).The mean Q10 of about 10 for musicians obtained by Bidelman et al. (2016) seems remarkably high. The highest individual Q10 value found in the present study was 6.6, and the highest value reported by Moore et al. (2019) was 7.0.
The origin of the difference across studies is not clear. All but one of the subjects in our Group M were violin or viola players. Bidelman et al. (2014, 2016) did not specify the instruments played by their subjects, but they were presumably more varied, as indicated by the term principal instruments. Our subjects overall had more musical training than theirs (mean = 17.3 years for our Group M, 10.4 years for Bidelman et al., 2014, and 14.4 years for Bidelman et al., 2016). Thus, the lack of effect of musicianship found here cannot be attributed to less musical training of our subjects. It is possible that musician-advantage effects, when they exist, are diminished by the deleterious effects of exposure to high-level sounds (Skoe et al., 2019) and that our subjects had more exposure because of their longer duration of musical training. However, if that were the case, the PTCs should have been broader for the left ear than for the right ear of our Group M because the sound exposure of violinists and viola players is greater for the left than for the right ears (Royster et al., 1991). In fact, there was no significant effect of ear for Group M, with or without the CS.
One possible reason for the difference across studies is related to the method of estimating Q10 values from the PTCs. We estimated Q10 values by fitting a rounded-exponential function to each side of the PTCs, after smoothing with a TPMA. This method took into account the shape of the PTC over a fairly wide frequency range, from 0.75fmin to fmin for the low side and from fmin to 1.3fmin for the high side, but excluding the low-frequency tail region of the PTCs. Thus, our method was relatively unaffected by minor irregularities in the PTCs. Also, our method captured the finding that individual differences in PTCs are usually somewhat greater for values of fc somewhat below and above the signal frequency than they are for values of fc close to the signal frequency. Bidelman et al. (2014, 2016) also used a TPMA to smooth the PTCs, but they did not specify exactly how the Q10 values were estimated. It seems likely that they simply estimated the width of the smoothed PTCs for a masker level 10 dB above the level at the tip and used this to calculate Q10. If so, their results would have been more affected than ours by minor irregularities in the PTCs.
Consider next the effects of CS on the PTCs. It should be noted that the ipsilateral efferent system was probably activated by the masker when its level was relatively high, that is, when fc was well above or below the signal frequency. This in itself might have led to a broadening of the PTCs, although it would be expected to have little effect around the tips of the PTCs, where both the signal level and masker level were low. The activation of the efferent system by the masker might also have reduced the effect of the CS. Also, in our study and most previous studies of the effects of CS on PTCs, the masker and signal were presented simultaneously, so the results may have been affected by suppression of the signal by the masker (Delgutte, 1990; Moore & Vickers, 1997). Hence, the effects of the CS may have been influenced by an effect of the CS on the suppression process. We are not aware of any studies that have assessed the effect of CS on suppression of a signal by a masker. Despite these complications, previous work using the same method has shown significant effects of CS on the sharpness of PTCs (Bidelman et al., 2017; Wicher, 2013), and our results also showed significant effects.
While the Q10 values of the PTCs were lower, that is, the PTCs were broader, in the presence than in the absence of the CS, there was no significant interaction between the presence/absence of the CS and group membership. In other words, the effect of the CS on the Q10 values did not differ for Groups M and NM. Thus, our results do not support the idea that the strength of the MOC reflex differed for Groups M and NM. This finding contrasts with the finding in several studies of an effect of musicianship on the strength of the efferent system as measured by the contralateral suppression of OAEs, as reviewed in the Introduction section. It may be the case that there is a difference in the strength of efferent suppression between musicians and nonmusicians, but the effect is too small to give measurable effects on the sharpness of PTCs. It is also possible that there was no effect of musicianship on the effect of the CS because the strength of the MOC reflex depends partly on attentional control (Maison et al., 2001). Attentional control may be greater for musicians than for nonmusicians, and this may offset any effect of greater MOC activation by CS.
Our results showed no significant effect of the ear of presentation of the CS on the change in sharpness of the PTCs produced by the CS. As described in the Introduction section, some studies showed a greater effect of CS on TOAEs when the CS was presented to the left ear than when it was presented to the right ear (Khalfa et al., 1998; Perrot et al., 1999), but such an asymmetry has not always been found (de Oliveira et al., 2011). Brashears et al. (2003) found a nonsignificant trend for the effect of the CS to be greater for musicians than for nonmusicians when the CS was presented to the left ear, but our results revealed no such trend. Overall, it appears that if there is any ear asymmetry in the effect of a CS, it is weak and does not differ markedly for nonmusicians and musicians.
Summary and Conclusions
The effects of CS on the sharpness of PTCs determined using signal frequencies of 2000 and 4000 Hz were compared for musicians and non musicians. The effect of ear of presentation was also assessed. The Q10 values of the PTCs were lower in the presence of the CS, but this effect did not differ significantly for musicians and nonmusicians. The main effect of group (musicians vs. nonmusicians) on the Q10 values of the PTCs was not significant. Overall, these results do not support the idea that musicianship enhances contralateral efferent gain control measured using PTCs.
The Q10 values of the PTCs did not show any effect of ear of presentation or any interaction with the presence/absence of the CS or with musicianship. Thus, our results do not support the idea that the strength of the MOC reflex depends on the ear of presentation.
Footnotes
Acknowledgments
The authors thank Prof. Aleksander Sęk for helpful comments and help in using the SWPTC software and Prof. Maciej Karpiński for organizational help. The authors also thank two reviewers for helpful comments on an earlier version of this article.
Declaration of Conflicting Interests
The authors declared no potential conflicts of interest with respect to the research, authorship, and/or publication of this article.
Funding
The authors disclosed receipt of the following financial support for the research, authorship, and/or publication of this article: The cost of the OA article processing was financed The authors disclosed receipt of the following financial support for the research, authorship, and/or publication of this article: from the Initiative of Excellence - Research University (05/IDUB/2019/94) project at Adam Mickiewicz University, Poznań, Poland.