
Abstract
Loudness context effects comprise differences in judgments of the loudness of a target stimulus depending on the presence of a preceding inducer tone. Interstimulus intervals (ISIs) between inducer tone and target tone of about 200 ms and above cause an induced loudness reduction (ILR) of the target tone. As the ILR increases, respectively, the perceived loudness of the target stimuli decreases with increasing ISI. This in turn means that identical stimuli in a different context have a differently perceived loudness. A correlation between specific characteristics in the electroencephalography responses and perceived loudness in an ILR experiment would therefore provide a neurophysiological indication of loudness processing beyond a neural representation of stimulus intensity only. To examine if such a correlation exists, we investigated cortical electroencephalography responses in a latency range from 75 to 510 ms during a psychoacoustical ILR experiment with different ISIs. With increasing ISI, the strength of the N1-P2 deflection of the respective electroencephalography response decreases similarly to the loudness perception of the target tone pulse. This indicates a representation based on loudness rather than on intensity at the corresponding processing stage.
Keywords
Introduction
Loudness is an auditory measure of perception and can essentially be defined as the perceived intensity of a sound. However, it has been well known for decades that besides intensity, other physical parameters such as spectral content and bandwidth or temporal properties like duration contribute to loudness perception (Moore, 2013; Stevens, 1957; Zwicker, 1958; Zwicker & Fastl, 1999). Although many loudness effects are linked to the physical properties of the stimulus, there are experiments indicating loudness differences for identical stimuli that were caused by changing contexts (for a review, see, e.g., Arieh & Marks, 2011). In psychophysics, the established common idea was that these contextual effects reflect relatively late judgment processes, that is, a bias in response, rather than changes in internal representation of the stimulus underlying the perception of sound intensity (Anderson, 1975; Stevens, 1958). However, more recent psychoacoustical research on contextual effects of loudness suggests that there is as well evidence for explicit changes in the internal representation of the stimulus underlying the perception of loudness (e.g., Algom & Marks, 1990; Schneider & Parker, 1990). Correlates between psychoacoustical measured effects of contextual loudness and neurophysiological responses would support the findings of these psychoacoustical studies if the latencies of the respective neurophysiological responses are too short to assume a relation to late judgment processes, or even too short to assume that consciously accessible processing stages are involved.
From the perspective of neurophysiological electroencephalography (EEG) measurements, several studies have shown that the change of sound intensity correlates with changes in the amplitudes of auditory evoked potentials (AEPs) related to brainstem activity (Bauer, Elmasian, & Galambos, 1974; Dau, Wegner, Mellert, & Kollmeier, 2000; Fobel & Dau, 2004; Junius & Dau, 2005; Serpanos, O’Malley, & Gravel, 1997) as well as in AEP related to activity in the auditory cortex (Hegerl, Gallinat, & Mrowinski, 1994; Hoppe, Rosanowski, Iro, & Eysholdt, 2001; Mulert, Juckel, Augustin, & Hegerl, 2002; Mariam et al., 2012; Näätänen & Picton, 1987; Potter et al., 2017). Generally, those studies treated the analysis of AEP that can be generated simply, using clicks or tone pulses.
When focusing on the relation of absolute intensity and AEP, most authors agree on the close relation of sound intensity in AEPs, but it remains rather unclear whether the observations are indicating only a correlation to intensity or a link to the perceived loudness. Relevant studies are contradictory (Babkoff, Pratt, & Kempinski, 1984; Darling & Price, 1990; Hoppe et al., 2001; Näätänen & Picton, 1987; Pratt & Sohmer, 1977; Serpanos et al., 1997; Silva & Epstein, 2010, 2012). Sound intensity is the factor with the greatest influence on loudness. Therefore, intensity and loudness show a close covariation. This makes it rather difficult to distinguish whether a neural response is better correlated with one or the other. Previous studies typically tried to detect compression effects in the neural response, to distinguish loudness from sound intensity (Behler & Uppenkamp, 2016; Castro, de Prat, & Zabala, 2008; Eeckhoutte, Wouters, & Francart, 2016; Emara & Kolkaila, 2010; Ménard, Gallégo, Berger-Vachon, Collet, & Thai-Van, 2008). However, it is not clear if a more compressed representation of the stimulus in the auditory pathway is necessarily indicating an earlier loudness processing, in particular when considering (a) that it can be assumed that a major part of the compression of the auditory dynamic range takes place in the cochlea and (b) the possibility of central expansion in loudness processing (see, e.g., Zhang & Zeng, 1997). In an ILR paradigm, typically identical stimuli (e.g., tone pulses) are judged as differently loud according to different contexts given by an inducer tone pulse presented beforehand at different ISIs. The cochlear processing of two physically identical reference stimuli, especially their compression, can be assumed to be almost the same even in different contexts, that is, for different ISIs (if the ISI is not too short). Therefore, any correlation between specific AEPs and the differently perceived loudness of identical reference stimuli in different contexts could provide an AEP based loudness indicator that has a different quality compared to loudness indicators that provide essentially correlations to the representation of stimulus intensity at different levels after cochlear compression.
In many psychoacoustical studies, loudness context effects have been addressed as the level difference (LI–LB) between the level LB of a comparison tone matched to be as equally loud as a preceding target tone of a different frequency without any inducer tone (baseline task) and the level LI matched in the presence of an additional inducer tone (typically at a higher level) preceding the target tone with a specific interstimulus interval (ISI). The presence of a more intense inducer at close temporal proximity (ISI less than 100 ms) and close in frequency typically enhances the loudness of a target tone (Marks, 1988), whereas ISIs longer than 200 ms lead to a so-called induced loudness reduction (ILR; Scharf, Buus, & Nieder, 2002). ILR can reach 10 dB or more (Arieh & Marks, 2003a; Nieder, Buus, Florentine, & Scharf, 2003) and the recovery process from ILR has a time scale of a minute (Marks, 1993) or even longer (Arieh, Kelly, Marks, & Pierce, 2005). To explain the temporal properties of these loudness-context effects, Arieh and Marks (2003a) suggested that the inducer tone starts two processes: an initial enhancement (or decrement) process with fast onset and decay and an ILR adaptation process with fast onset but slower decay.
According to Oberfeld (2007), the initial process of loudness enhancement can be seen as a rather centrally located merging process of inducer and target tone (see also Elmasian, Galambos, & Bernheim, 1980). Besides, loudness enhancement ILR is as well interpreted as a centrally based adaptation-like process (Arieh & Marks, 2003b). Mechanisms on lower processing stages can be widely excluded as the most relevant explanations for these loudness context effects. Stimulus interactions on cochlear level can be neglected, since cochlear processing such as peripheral ringing is thought to last only a few cycles of the filter’s center frequency. Loudness changes with increasing ISI should show the opposite trend to the observed ILR effect when assuming the same mechanisms as for classical forward-masking. Nieder et al. (2003) argue that medial efferents affecting cochlear tuning are unlikely, due to the mismatch of the respective time constants in psychoacoustics and efferent mechanisms and the general insensitivity of medial efferents to short stimuli of the order of 20 ms, which nevertheless produce significant ILR. Wang, Kreft, and Oxenham (2015) showed that loudness context effects are also present in cochlear implant (CI) users for whom the cochlea, and respectively any medial efferent feedback to the cochlea, is bypassed. This indicates as well that medial efferent effects play not a major role as underlying mechanism for loudness context effects, although they may affect the absolute outcome to some extent as indicated by Wang, Kreft, and Oxenham (2016). They observed loudness enhancement in CI users not seen in normal hearing subjects at comparable stimulus conditions which might be due to an overall loudness reduction caused by a medial efferent reflex in the normal hearing subjects. Overall, for the stimulus settings in this study, it is reasonable to assume that most peripheral and medial efferent effects should play no or only a minor role.
Which effects can be expected in cortical AEP when using stimulus configurations similar to ILR experiments? Previous EEG studies investigated the change of the cortical AEP for a series of tone pulses using the same frequency, but with varying stimulus onset asynchrony and ISI (Davis, Mast, Yoshie, & Zerlin, 1966; Lanting, Briley, Sumner, & Krumbholz, 2013; Nelson & Lassman, 1968), that is, they used stimulus configurations that are comparable to ILR experiments. These studies found a strong decrease of the neural response strength to the second and later tone pulses with respect to the first tone. This decrease of strength is referred to as repetition suppression. It can be assumed that it is consequence of an overloading-related reduction of synchronously firing neurons or specific neural circuits. In a further step, Lanting et al. (2013) found (for a stimulus condition that is comparable to the experiment in this study—their Experiment 1) that with increasing ISI, the repetition suppression decreased, that is, the related cortical AEPs increased again. Several studies that investigated the relationship of loudness and cortical AEPs suggest a positive correlation between both (Hegerl et al., 1994; Hoppe et al., 2001; Mariam et al., 2012; Mulert et al., 2002; Näätänen & Picton, 1987; Potter et al., 2017). The combination of these findings suggests that a decrease in repetition suppression, that is, an increase in EEG amplitude (with increasing ISI) goes hand in hand with a respective increase in loudness perception. At first glance, this appears to contradict the psychoacoustical results of Arieh and Marks (2003a). However, Lanting et al. (2013) used the same level for inducer and target tone while ILR can only be expected if a certain level difference between inducer and target tone is exceeded. Furthermore, they showed that the different cortical components have different adaptation properties. They suggested that mainly cortical components at later stages, particularly the vertex-positive deflection around 200 ms (P2), are involved in the decrease of the repetition suppression. It could be that response components other than P2 (e.g., N1) may reflect different aspects of loudness processing and therefore are less, or even oppositely, affected. One of the rare studies combining context effects of loudness and neural responses found that the amplitude of the N1 deflection represents an electrophysiological correlate of the effects of nonsimultaneous masking on intensity resolution (Oberfeld, 2010), which possibly also indicates a direct relation between the AEP deflection amplitudes and loudness enhancement at short ISIs (Oberfeld, 2008). However, the temporal properties of loudness enhancement and ILR are different, suggesting possibly different underlying mechanisms affecting the two processes. For longer ISIs (0.8–8 s), Lu et al. (1992) conducted magnetoencephalography (MEG) and psychoacoustic measurements at the same time. They found that the individual time constants of loudness-context effects, that is, loudness increase or decrease with increasing ISI, were closely correlated to the respective individual time constant of an increasing N1m peak. They interpreted the increase of N1m as the recovery of a neuronal circuit representing a memory trace 1 of the loudness of the first tone pulse. The memory trace initiated by the target tone (and serving as the reference for loudness comparisons) decays with increasing ISI and is more and more replaced by a long-term loudness reference given by the middle of the range of stimuli (central tendency). In summary, the literature provides clear evidence that differences in loudness due to context effects are mainly related to loudness processing on higher stages of the auditory pathway, while earlier processing stages—especially cochlear compression and medial efferent effects—are likely to play a minor role only. Furthermore, in comparison to purely intensity-related AEP correlates, neural responses that reflect those specific context-related differences in loudness would indicate a more complete, or at least a different, representation of loudness at the respective processing stages.
Within this context, the focus of this study lies on the relation between AEPs (including the N1 deflection) from EEG recordings and ILR at longer ISIs. In particular, this study looks for features in the cortical AEP responses that correlate directly with the loudness differences caused by ILR as a context effect. Therefore, we included the ILR paradigm directly in an EEG experiment, measuring a subset of the ISIs investigated by Arieh and Marks (2003a). The synchronous measurement of psychoacoustics and EEG provides two possible advantages: (a) The recorded EEG data are directly linked to the psychoacoustic outcome—no effects have to be considered due to different attention or physiological status of the subject, which may occur when performing EEG and psychoacoustic measurements at different times. (b) A possible enhancement of the neural activation, since recent studies recommended active listening tasks to enhance neural activation related to the investigated features (Bennington & Polich, 1999; Öhman & Lader, 1972; O’Sullivan, Shamma, & Lalor, 2015).
The features we investigated are the condition-related changes of strength and latency of the cortical components in the AEP. The cortical components that we consider are the vertex-negative deflection at around 100 ms (N1), the vertex-positive deflection around 200 ms (P2), and the vertex-negative deflection around 250 ms (N2). These selected components are popular candidates to represent cortical activation at different stages. We tested whether (a) the strength of cortical components increased with increasing loudness and (b) the latency of cortical components changed with loudness.
When the eliciting target stimuli in an ILR experiment are identical for the different ISI conditions, any loudness differences between conditions are independent of sound intensity. Therefore, a relationship between cortical AEPs and context-related loudness changes would provide an indicator covarying with perceived loudness and not intensity differences of the respective processing stage.
Later AEPs such as N2 may already also reflect cognitive control mechanisms (Folstein & Petten, 2008), whereas the N1-P2 deflection is assumed to be associated with sensory evoked potentials that are most probably not representing conscious processes such as attention or decision-making (Polich, 1993).
Therefore, a correlation between earlier cortical AEPs and the contextual loudness would provide some evidence that the neural representation of the stimulus loudness is adapted, rather than observing a bias in response only, whereas a correlation only with N2 or later AEPs would indicate the opposite.
Methods
Subjects
Twelve subjects, six males (S1, S3, S6, S7, S10, and S11) and six females (S2, S4, S5, S8, S9, and S12), with clinically normal hearing participated in the experiments. All had hearing thresholds ≤ 15 dB HL at standard audiometric frequencies between 125 and 8000 Hz. The subjects were right-handed, between 20 and 30 years old and were paid volunteers. 2
All experimental procedures were approved by the ethics committee of the University of Oldenburg.
Stimulation and Recording
In line with the experiment by Arieh and Marks (2003a), the stimuli used in the experiment were different sequences of tone pulses with an overall duration of 50 ms, including 5 ms cosine rise and decay. A sequence generally consisted of one 2500 Hz inducer tone at 80 dB SPL, one 2500 Hz target tone at 60 dB SPL and one 500 Hz comparison tone with adjustable sound level (Figure 1). Due to the frequency specificity of ILR, the inducer and target tone on the one hand and comparison tone on the other were presented at different frequencies. According to Marks and Warner (1991), the comparison tone should differ by at least one critical band from the frequency of inducer and target tone, to ensure that the inducer is affecting the target tone alone, rather than also causing an ILR of the comparison tone (see, e.g., Arieh & Marks, (2003a), Experiment 2). Four conditions were presented in pseudorandomized order and differed in the length of the ISI between inducer and target tone: (a) without an inducer tone (henceforth referred to as baseline condition), and with an inducer tone to the target tone at (b) 150, (c) 525, and (d) 1,650 ms. For all conditions, the ISI between target and comparison tone was 1,000 ms. Signal generation and conditioning including attenuation was performed digitally on a PC by a MATLAB R2006b (the Mathworks) based custom software. The stimuli were digital-to-analog converted at a sampling frequency of 44.1 kHz using a Fireface UCX (RME) as an external sound device and were presented diotically via ER 2 insert earphones (Etymotic Research) driven by an HB7 headphone buffer (Tucker Davies Technologies). The ER 2 insert earphones were calibrated using an IEC711 compatible ear simulator for insert phones (Brüel & Kjaer, Typ 4157). During calibration, the earphones were connected to the ear simulator via a foam tip plugged into the external-ear simulator (Brüel & Kjaer, Typ DB2012).

The stimulus sequences used to measure the time course of ILR. The inducer tone creates the context of the target tone. The time course of ILR was measured by varying the ISI between the inducer tone and the target tone. The comparison tone level was adjusted in an adaptive procedure to determine the loudness of the target tone.
The subject’s response to the psychoacoustic task was via a button-response box, which sent a response-specific trigger signal to the EEG recording system to be stored in the EEG data, and gave a correlated input to the stimulation PC controlling the psychoacoustic measurement procedure.
Four conditions were presented in pseudorandomized order and differed in the length of the ISI between inducer and target tone: (a) without an inducer tone (henceforth referred to as baseline condition), and with an inducer tone to the target tone at (b) 150, (c) 525, and (d) 1,650 ms. For all conditions, the ISI between target and comparison tone was 1,000 ms.
The psychoacoustic measurement was realized using the AFC software package, a tool designed to run psychoacoustic measurements in Matlab (Ewert, 2013). Similar to the study of Arieh and Marks (2003a), the four conditions (baseline and ISIs between target and comparison tone of 150, 525, and 1,650 ms) were measured in a randomized order. The loudness of the 2500-Hz target tone fixed at 60 dB SPL was estimated from the results for the measurement of two interleaved tracks, referred to as the ascending and descending track. The order of the presentation from the two tracks was randomized from trial to trial. After the presentation of each stimulus sequence, the listener’s task was to judge whether the target or comparison tone was louder by pressing the appropriate key (two-alternative forced choice, AFC). The level of the comparison tone in each track was adjusted according to the listener’s responses following an adaptive two-up, two-down (2up-2down) procedure, that is, the level of the comparison tone was increased after it was judged as softer than the target in two successive trials within one track, or the level was decreased if the comparison tone was judged as louder in two successive trials. This up-down rule converges to the target probability of 50% on the psychometric function. The step size of the sound level of the comparison tone changed adaptively within each track. After three reversals, 3 the step size decreased from 4 to 2 dB. The whole procedure ended after nine reversals in each track. Due to the adaptive procedure, the numbers of trials in each run varied. The average number of trials was 156, but varied between 77 and 210. Arieh and Marks (2003a) had measured at first the baseline condition in each subject, using start levels for the comparison tones of 40 and 80 dB SPL for the ascending and descending track, respectively. Then they measured the other conditions with start levels of 25 dB below and above the individual baselines of the test persons. In this study, we used start levels of 25 dB below and above the nominal target level of 60 dB SPL for the measurement of the various ISI conditions as well as for the baseline condition, in order to allow a randomized order for the measurement across all conditions (including the baseline condition).
Parallel to the loudness estimation procedure, EEG was recorded with a Biosemi-Active Two system using 64 channels, with the electrodes placed according to the international 10-20 system. Contact gel (Signa gel Electrode Gel, Parker) was used between electrodes and scalp. The electrode offset was not higher than 10 mV. The recordings were collected and digitalized on a second PC using the ActiView software (6.03, Biosemi) at 1024 Hz sampling frequency. Each session lasted 10 to 15 min. A 10-min break separated consecutive sessions.
Data Processing and Analysis
The psychoacoustic data from the adaptive loudness matches provided a series of loudness judgments that gradually converged to the value of equal loudness. The point of equal loudness between the target and reference was calculated by averaging the last six reversal points. Subsequently, the arithmetic mean was determined from the ascending and descending tracks. The listeners were instructed to ignore the inducer tone and judge whether the target or the comparison tone was louder.
All EEG data were processed offline using MATLAB. The average of all electrodes was used as the virtual reference electrode. For the evaluation of the cortical responses, a cluster of nine electrodes around the Fcz-electrode (Fcz, F1, F2, Fz, C1, C2, C3, C4, and Cz) was examined. Generally, diotical stimulation favors the recording at central electrodes. Furthermore, the findings of Lanting et al. (2013) regarding the topographic activation of the responses N1 and P2 to the target tone showed that some of the frontal electrodes were most appropriate to measure the AEP to the consecutive tone pulse. After applying high-pass filtering at 0.5 Hz to reduce the electrode drift and low-pass filtering at 8 Hz to reduce alpha-wave artifacts, 4 the data were down-sampled to 64 Hz sampling frequency. Further reduction of artifacts caused by eye movement was carried out using independent component analysis (MATLAB toolbox eeglab 4.4 b). For the two shorter ISI conditions (150 ms and 525 ms), there was a temporal overlap between the AEPs of the inducer and the target tone. Therefore, the response to the inducer tone from the longest ISI condition (1,650 ms) was subtracted from these conditions. Afterwards, the data were separated into epochs. The epochs were averaged using an iterated weighted averaging procedure (Riedel, Granzow, & Kollmeier, 2001) with two iterations. This procedure provided weights for each epoch according to its estimated amount of noise contamination.
Our study focused on the differences in amplitudes and latencies of the cortical components N1, P2, and N2 of the test conditions to the baseline condition. We used the peak-to-peak amplitude between the P2 and N1 deflections and between the N2 and P2 deflections as well as the mean amplitude over different time windows as representations of these components. Peak-to-peak amplitudes of the components were extracted by selecting the minimum amplitude for the negative components (N1 and N2) or the maximum for the positive component (P2), each within physiologically reasonable time windows. The respective time windows were chosen for N1 from 75 to 170 ms, for P2 from 170 to 310 ms, and for N2 from 200 to 510 ms. The width of these windows was chosen based on the measured temporal occurrence of the components in the mean EEG response to the target tone. The position of each peak was used as a representation of the latency of the respective cortical component.
Statistical Analysis
We aimed to test whether the trend of the evoked responses of the target tone was driven by a decrease of the repetition suppression or by the ILR, which would show an opposite trend. Therefore, we compared the order of the averaged AFC judgments for the different ISI conditions with the order of the strength of the cortical components. Assuming independent and identically distributed observations and normal distribution for the data, an analysis of variance for repeated measures (rmANOVA), including the Mauchly test for sphericity and a corresponding Greenhouse–Geisser correction, was carried out to examine whether the means of the prospective neural correlates across subjects differed with the conditions. This was also carried out for the sound levels derived from the AFC judgments. Furthermore, we compared the changes in the loudness matches to the changes in the EEG amplitudes within subjects. We used the approach of Bland and Altman (1995) for the calculation of correlation coefficients with repeated observations. This method allows study of the direct relationship between individual loudness matches and individual EEG responses by calculating the correlation within subjects.
Results
Figure 2 illustrates the results of the AFC judgments for the three ISI conditions. The difference between the adjusted comparison tone of the baseline condition (51.4 ± 2.3 dB) and the ISI conditions was shown. By increasing the ISI between the inducer tone and the target tone, the level of the adjusted comparison tone decreased. This implies a decrease in loudness of the target tone. The level difference between the ISI conditions 150 ms and 525 ms is about 4 dB, whereas it amounts to only 2.5 dB between 525 ms and 1,650 ms. The decreasing effect of the inducer tone on the loudness perception of the target tone was highly significant—rmANOVA: F(2, 22) = 8.789,

The level of the comparison tones was adjusted in equal loudness to the 60 dB target tone for the baseline condition and several ISI conditions. ΔL represents the level difference between the adjusted comparison tone level under the baseline condition and the comparison tone levels under ISI conditions. The error bars indicate the 95% confidence intervals across subjects. If ΔL > 0, the target tone of this ISI condition was perceived as louder than in the baseline condition, and vice versa.
The inducer tone also had a considerable effect on the EEG response of the target tone. The strength of cortical components of the target tone response among the ISI conditions was clearly reduced for all conditions compared with the baseline response (Figure 3), but across the ISI conditions, the mean amplitudes relative to the baseline condition of the different cortical components showed disparate behavior (Figure 4(a) and (b)). The mean amplitude difference of N1-P2 decreased significantly with increasing ISI—rmANOVA: F(2, 22) = 4.9,
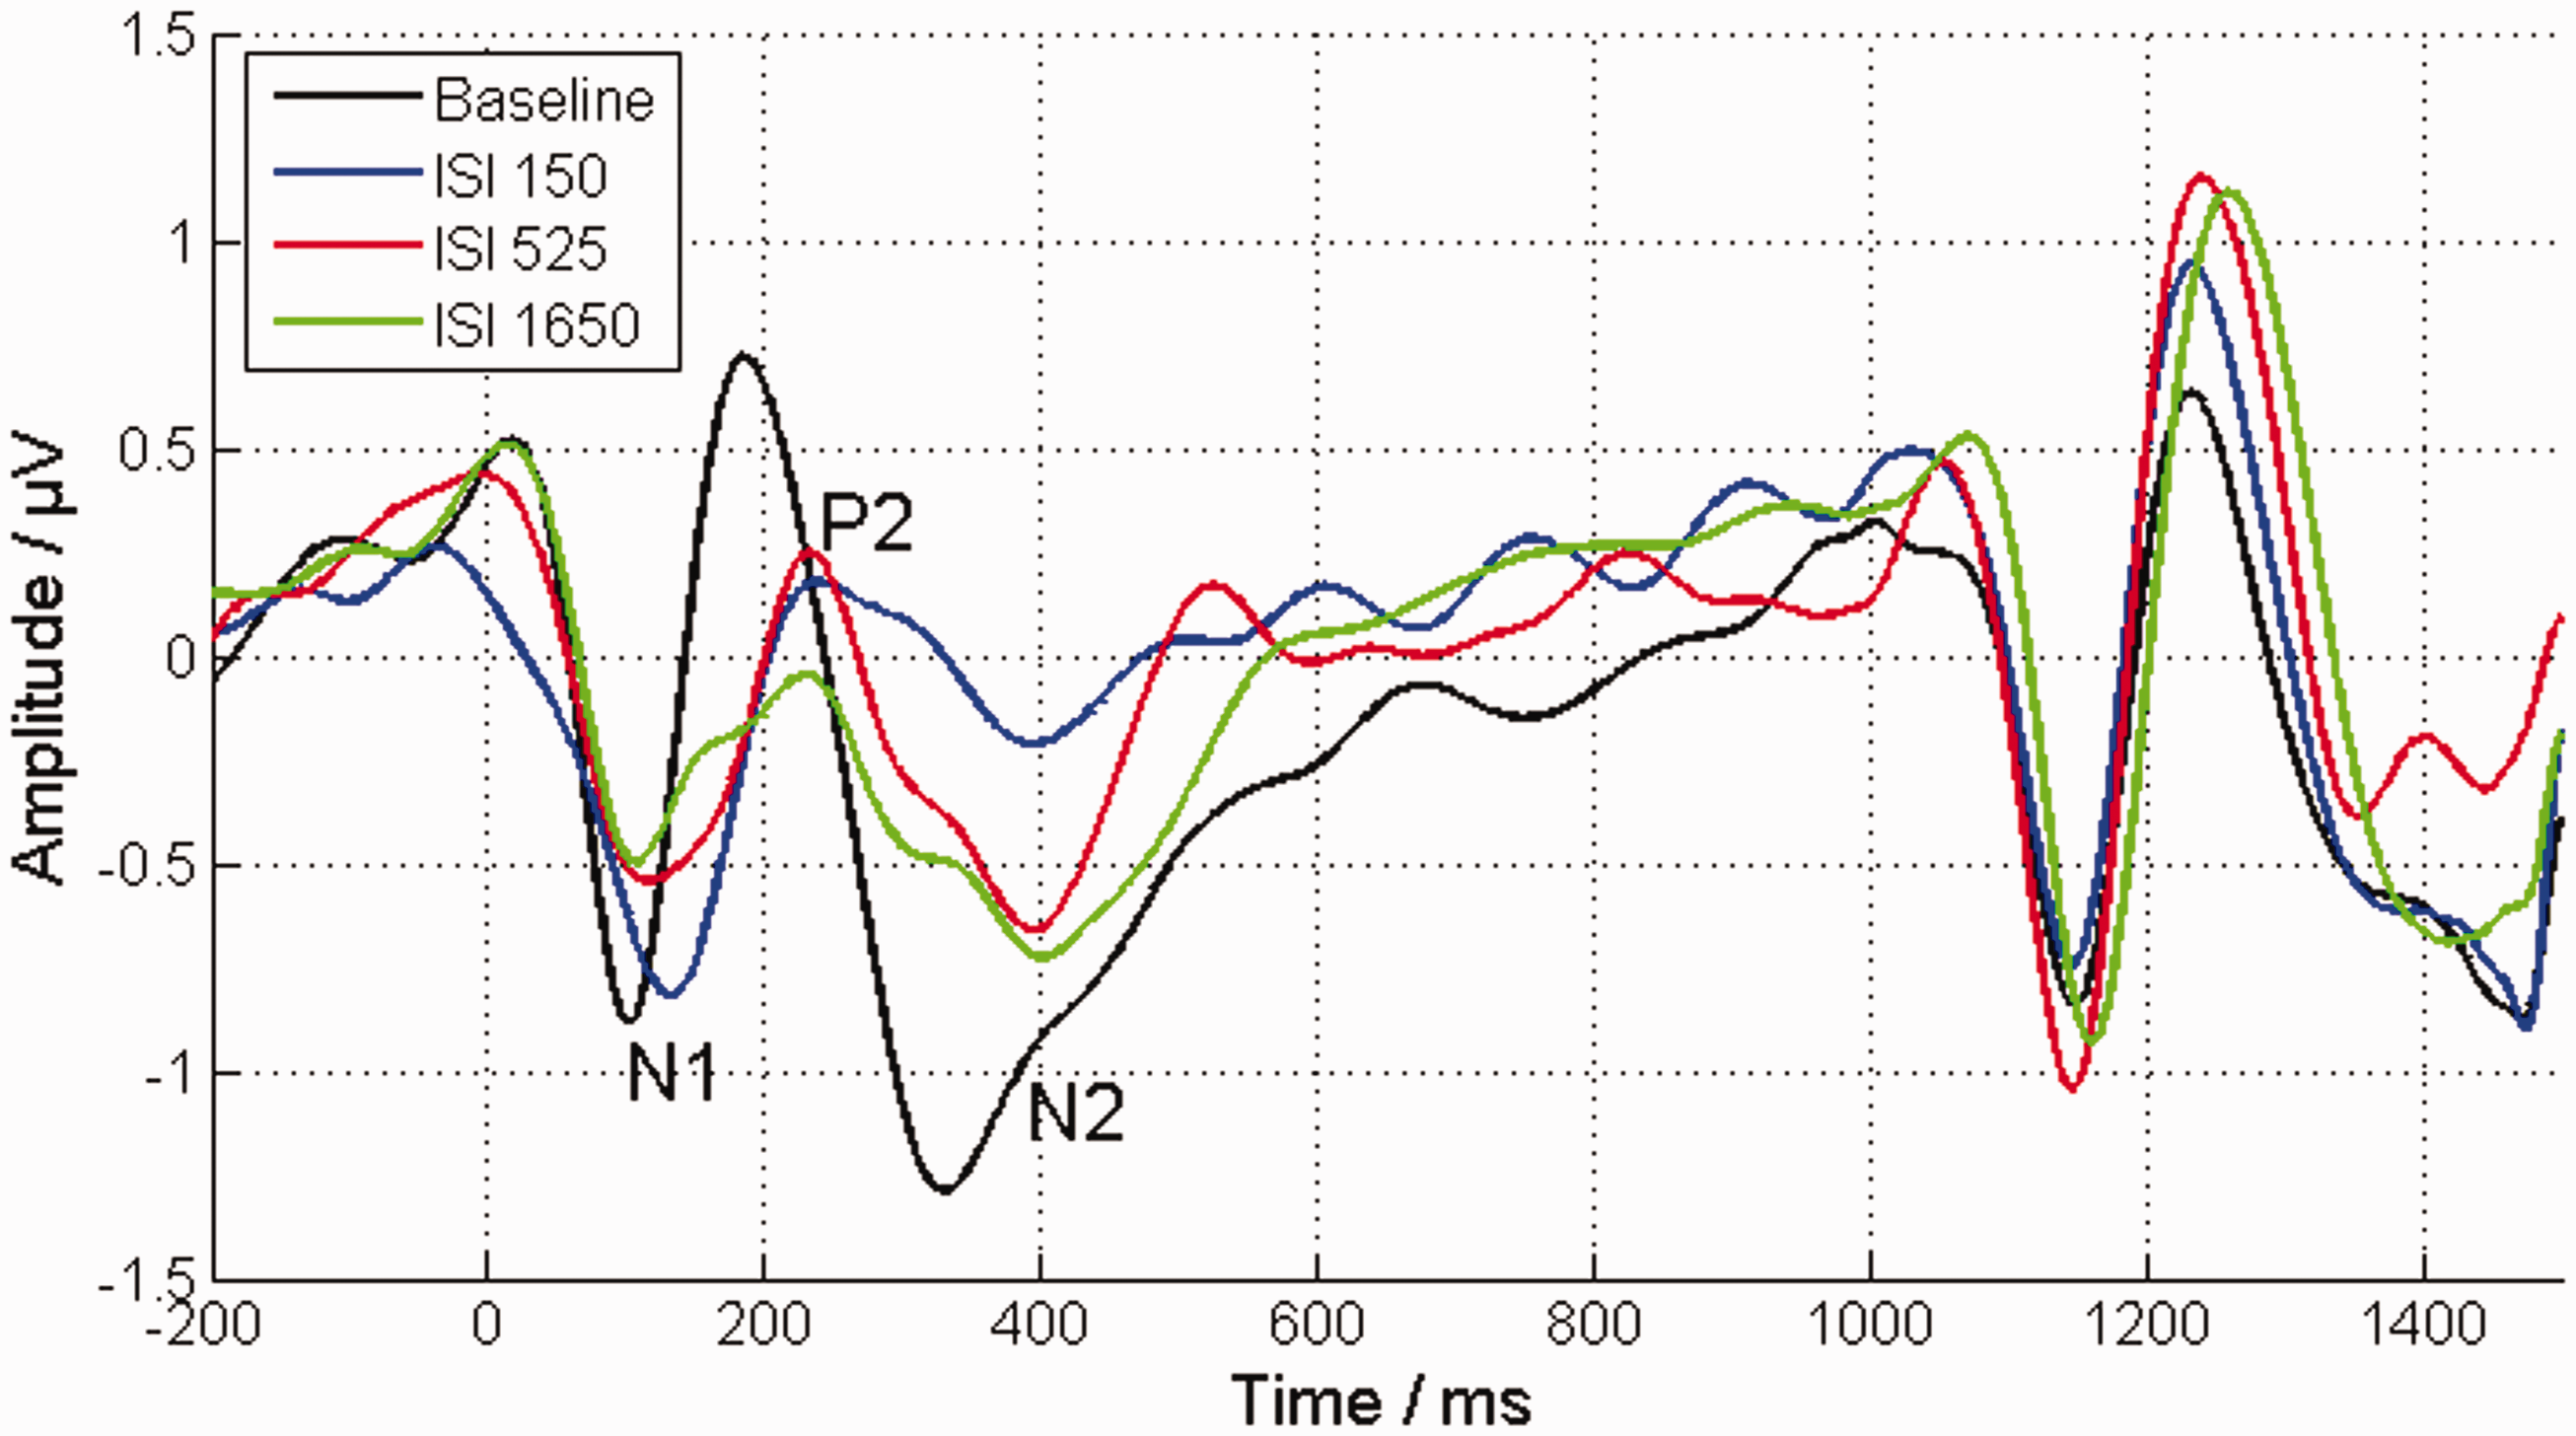
The averaged EEG response to the target tone (starting at 0 ms) and to the loudness-adjusted comparison tone (starting at 1,050 ms) for the different ISI conditions. The averaged EEG response to a 60 dB tone pulse and to a corresponding, adjusted, comparison tone in the absence of an inducer tone is represented by the black line (baseline condition). Both tone pulses have a similar cortical response, characterized by a pronounced N1 with a peak at 100 ms, a pronounced P2 with a peak 190 ms, and an N2 with a peak at 320 ms with an extended reload. All ISIs showed a reduced strength of the target tone response. Furthermore, the strength of their N1-P2 deflections showed a decrease with increasing ISI. ISI = interstimulus interval.

(a–d) Boxplots of the investigated features of the EEG response to the target tone for the three different ISI conditions. In the top panels, ΔA represents the amplitude differences of the N1-P2 (a) and N2-P2 (b) deflections between the condition with an inducer tone and the baseline without inducer tone. The amplitudes were extracted by using the mean amplitude method. In the bottom panels, the latencies of the N1 (c) and of the P2 (d) are displayed. The mean values across the subjects are marked by black triangles. ISI = interstimulus interval.
Cortical Features of the EEG-Response to the Target Tone in the Baseline Condition and in the Different ISI Conditions With Their Corresponding ANOVA Results.

Note. The N1-P2 and N2-P2 deflections were extracted by using two different approaches: peak-to-peak and mean amplitude. The amplitude differences were normalized by subtracting the baseline condition. Latencies were extracted at the position of the peaks of the N1 and P2 components. One-way ANOVA was performed across ISI conditions and 12 subjects. In the bottom part of the table, absolute latencies of the respective EEG responses are given without a baseline correction. rmANOVA = repeated measures analysis of variance; ISI = interstimulus interval.
Correlation analysis between individual loudness matches and individual EEG responses showed a significant correlation between N1-P2 amplitude and loudness matches (

Scatter plot of the individual EEG responses of the N1-P2 amplitude and the individual loudness matches with parallel lines fitted for each subject as suggested by Bland and Altman (1995). ΔL represents the level difference between the adjusted comparison tone level under the baseline condition and the comparison tone levels under ISI conditions. The different open symbols and colors represent the different subjects. The filled symbols in the middle of each colored (red, blue, gray) line are just markers indicating which line belongs to which data points (open symbols) with the same shape and color. The black line is the regression line for all data points after subtraction of the subjects’ individual offsets (as indicated by the colored lines).
Discussion
The ILR effect for loudness found by Arieh and Marks (2003a) was essentially reproduced for the three conditions in the psychoacoustical experiment. However, the measured level differences of the comparison tones between the conditions in our data are slightly lower than in Arieh and Marks’ study. Furthermore, the average data found here may even indicate a slight loudness enhancement for an ISI of 150 ms, which was not seen in Arieh and Marks (2003a) for the same signal configuration. These differences can have several reasons: One reason might be that the relative small number of subjects in this study and the high intersubject variability in this type of experiments especially for higher level inducer tones (e.g., Oberfeld, 2007) biasing the average outcome here. Another reason might be differences in signal presentation due to the use of different speakers. The strength of both ILR and loudness enhancement is clearly dependent both on the level difference as well as on the absolute level of inducer and target tone (Oberfeld, 2007). Differences across studies in the effective sound level at the eardrum can easily occur when using different headphones while presenting the sound at the same nominal sound pressure level (SPL). 5 The effective level deviation from their specific level condition due to different headphones and a respective calibration mismatch can potentially be another source for the observed differences in the context related loudness effects in this study. Since Arieh and Marks (2003a) discussed that their specific level configuration of inducer and target level may lead to cancellation of loudness enhancement and ILR processes at short ISIs and that this might be the reason for almost no loudness enhancement at short ISIs in their data. An effective level deviation from their specific level condition due to a respective calibration mismatch between different head- or earphones may explain even the observed loudness enhancement at an ISI of 150 ms in this study. A further reason for the differences with Arieh and Marks (2003a) could be the different starting levels of the comparison tones for the ascending and descending tracks when measuring the ISI conditions. They used 25 dB above and below the listener’s individual baseline, whereas in this study, 25 dB above and below the nominal target level had been used. In addition, Lu et al. (1992, see Introduction section) assumed that with increasing ISI, the remembered loudness of the target tone tends toward a long-term loudness. They argue that the long-term loudness is essentially determined by a kind of average level during the running test session. Thinking in these terms, the differences in ILR between the studies might also be related to differences in remembered long-term loudness. A different number of stimulus conditions or different temporal settings, such as different pause durations between trials and so on, may differ across studies and possibly affect the integration process for both the respective long-term loudness and loudness matches at long ISIs.
The amplitude of the P2-N2 deflection—as part of the cortical response to the target tone—increased with increasing duration of the ISI. This decrease of repetition suppression is in line with the expectations of previous studies (Davis et al., 1966; Lanting et al., 2013; Nelson & Lassman, 1968). However, comparing the loudness matches with the amplitudes of the P2-N2 deflection within subjects, no correlation was found. On the contrary, the amplitude of the N1-P2 deflection decreased with increasing duration of the ISI, which is in agreement with the psychoacoustically measured decrease in loudness. This effect was most evident when examining the mean amplitude, since the peak-to-peak amplitude only showed significant correlation when compared with the individual loudness matches. The N1-P2 mean amplitude of the target tone of the ISI at 150 ms is higher than in the baseline condition (Figure 4). This gives some indication that the N1-P2 deflection also reflects the effect of loudness enhancement. In addition, the correlation coefficient for the peak-to-peak amplitude was slightly lower than for the mean amplitude. This is probably due to the fact that peak extraction cannot take temporally wider deflections into account. The reduction of the N1-P2 deflection with decreasing loudness is in agreement with the findings by Hoppe et al. (2001) in CI users. For the different ISI, the target stimuli were identical in this study. That means that the changes in loudness, as well as in the coinciding N1-P2 deflection, as observed here, are not related to the physical stimulus intensity.
Compared to the strength of a normal cortical response reported in literature (1–2 µV for the deflections of individual components; Picton, Hillyard, Krausz, & Galambos, 1974, e.g., the response to the comparison tone), a strong reduction in the strength of the cortical response was observed for both N1-P2 and P2-N2 deflections. This generally coincides with the results of previous studies, in which a decrease of repetition suppression for the cortical AEPs was observed (Davis et al., 1966; Lanting et al., 2013; Nelson & Lassman, 1968). The N1-P2 deflection also shows this overall reduction 6 but no decrease of repetition suppression with increasing ISI. It might therefore be possible that the change in the underlying AEP component (related to the time course of ILR or loudness enhancement) is even larger than observed here, but that it is partially masked by the general trend of a decrease of repetition suppression. Nevertheless, the representation of the ILR effect in the N1-P2 deflection suggests that loudness is represented in the auditory cortex. This finding is in agreement with the results of some previous studies (Behler & Uppenkamp, 2016; Röhl & Uppenkamp, 2012; Thwaites et al., 2016). Behler and Uppenkamp (2016) showed in a functional magnetic resonance imaging study that the correlation between the blood oxygenation level dependent (BOLD) signal and loudness increases at higher stages in the auditory pathway. Maximum correlation was reached at the posterior medial Heschl’s gyrus. Similar observations were reported by Thwaites et al. (2016). They found in an MEG study several cortical components corresponding to the loudness of speech estimated by a loudness model. Using a cross-correlation analysis, they found four components with significant correlation at latencies of 45 ms, 100 ms, 165 ms, and 275 ms. The latest of these components provided a higher correlation with short-term loudness (i.e., low-pass filtered) than with the instantaneous loudness. Hence, they concluded that the latest component represented short-term loudness, which is seen as a more fully integrated representation of loudness in higher auditory stages in comparison to instantaneous loudness or purely sound level related correlates. For latencies between 75 ms and 310 ms, we found that N1-P2 deflection also correlates with contextual effects in loudness, suggesting that for these latencies and the associated neuronal processing stages, already a relatively largely integrated loudness representation (i.e., it already includes the representation of many different aspects of loudness) is given.
Overall, it can be assumed that loudness context effects are essentially processed at the cortical level, that is, at relatively high processing levels. However, it is not entirely clear whether the processing is essentially still part of the sensory stimulus processing or whether it is rather a shift of the response criteria and thus a processing on even higher levels in connection with conscious judgment processes (Algom & Marks, 1990; Arieh & Marks, 2003b; Schneider & Parker, 1990). Investigating the response times of neural processing can be useful to clarify this issue. For example, in Arieh and Marks (2003b), listeners had to detect weak tones in a classification task. They found that under conditions that produce loudness context effects, the listeners showed increased response times and higher error rates compared to control conditions. According to Luce (1986), a positive relation between response time and error rate is a strong indicator for a sensory, rather than for a decisional, change. That means, from the psychoacoustical point of view, that the effect of loudness context effects is—at least partially—a change in the sensory representation of the target tone rather than a response bias. From the neurophysiological aspect, the N1-P2 deflection is not expected to reflect processing stages that were already involved into decisional processes, but more in providing specific feature traces of the stimuli and perhaps to some extent complete stimulus representations (for a review, see Näätänen & Winkler, 1999). Under this premise, the relation found between N1-P2 deflection and the time course of loudness context effects provides neurophysiological evidence that loudness context effects causes a context-related change of the sensory-stimulus representation.
It should be noted that in the current EEG analysis, a low-pass filter was used with a relatively low cutoff frequency of 8 Hz, which reduced the amplitudes of the measured cortical components, especially affecting the P1 component. Similar to Hoppe et al. (2001), who used a cut off frequency at 10 Hz, this makes a quantitative analysis of the P1 amplitude almost impossible. Therefore, only the N1-P2 and P2-N2 deflections were examined here. This has two major drawbacks: (a) it significantly reduces the temporal resolution of the components; and (b) it impedes a separate consideration of the deflections. In particular, it would be interesting to investigate the N1 and P2 separately, since they represent different dipole sources (Crowley & Colrain, 2004). This filtering adjustment was necessary because of frequently observed alpha waves during the experiment, presumable induced by the effort of the AFC task processing. This is in agreement with the findings by Klimesch (1999), who showed that cognitive and memory performance was reflected by an increase of alpha activity. This has to be seen as a clear drawback of the synchronous measurement of AEP and psychoacoustic tasks.
Summary and Conclusion
Neural representation of loudness context effects in the EEG response was demonstrated by using an AFC paradigm during the EEG recordings. The strength of the N1-P2 deflection showed the same trend as the time course of loudness context effects, that is, a decrease with increasing ISI, whereas the P2-N2 deflection showed a recovery from repetition suppression indicated by a relative increase with increasing ISI. In the presence of an inducer tone at 80 dB SPL, both deflections for all ISI were clearly reduced compared to the baseline condition. The following conclusions are drawn:
Since the target stimuli for all ISI were identical, the N1-P2 deflection provides a correlation to loudness, rather than only to physical sound intensity. The correlation to context effects provides an indication that a relatively far-reaching integration of loudness representation is already given for the corresponding latency range and the associated processing stages. The finding that the correlation to loudness context effects is already reflected in the N1-P2 deflection provides neurophysiological evidence that context effects cause at least partially an adaption of the neural loudness representation of the stimulus and not (only) a shift in the decisional processes.
Footnotes
Acknowledgments
Declaration of Conflicting Interests
The authors declared no potential conflicts of interest with respect to the research, authorship, and/or publication of this article.
Funding
The authors disclosed receipt of the following financial support for the research, authorship, and/or publication of this article: This study was funded by the DFG (Cluster of Excellence 1077 “Hearing4all”) at the University of Oldenburg.