
Abstract
Recent studies have compared tinnitus suppression, or residual inhibition, between amplitude- and frequency-modulated (AM) sounds and noises or pure tones (PT). Results are indicative, yet inconclusive, of stronger tinnitus suppression of modulated sounds especially near the tinnitus frequency. Systematic comparison of AM sounds at the tinnitus frequency has not yet been studied in depth. The current study therefore aims at further advancing this line of research by contrasting tinnitus suppression profiles of AM and PT sounds at the matched tinnitus frequency (i.e., 10 and 40 Hz AM vs. PT). Participants with chronic, tonal tinnitus (n = 29) underwent comprehensive psychometric, audiometric, tinnitus matching, and acoustic stimulation procedures. Stimuli were presented for 3 minutes in two loudness regimes (60 dB sensation level [SL], minimum masking level [MML] + 6 dB, control sound: SL −6 dB) and amplitude modulated with 0, 10, or 40 Hz. Tinnitus loudness suppression was measured after the stimulation every 30 seconds. In addition, stimuli were rated regarding their valence and arousal. Results demonstrate only trends for better tinnitus suppression for the 10 Hz modulation and presentation level of 60 dB SL compared with PT, whereas nonsignificant results are reported for 40 Hz and MML + 6 dB, respectively. Furthermore, the 10 Hz AM at 60 dB SL and the 40 Hz AM at MML + 6 dB (trend) stimuli were better tolerated as elicited by valence ratings. We conclude that 10 Hz AM sounds at the tinnitus frequency may be useful to further elucidate the phenomenon of residual inhibition.
Introduction
Subjective tinnitus is defined as the perception of a phantom sound in the absence of any external objective physical source (Eggermont & Roberts, 2004) and is defined as chronic after continuous presence for 6 months (Mazurek, Olze, Haupt, & Szczepek, 2010). Chronic subjective tinnitus is highly prevalent with 10% to 15% of the population reporting continuous tinnitus perception and about 1% to 2% suffering immensely from the condition (Langguth, Kreuzer, Kleinjung, & De Ridder, 2013). The phenomenon is continuously gaining relevance as it coincides with a steadily aging demographic (Hoffman & Reed, 2004) and concomitant age-related hearing loss (presbycusis; Ferreira, Ramos Júnior, & Mendes, 2009), noisy occupational or leisure time environments (Sanchez et al., 2016; Shargorodsky, Curhan, & Farwell, 2010), and stress (Mazurek, Haupt, & Olze, 2012). Moreover, tinnitus is not only related to altered auditory functions like speech perception (Ivansic et al., 2017; Jagoda et al., 2018), sound source localization (Hyvärinen, Mendonça, Santala, Pulkki, & Aarnisalo, 2016), auditory attention (Cuny, Norena, El Massioui, & Chéry-Croze, 2004), and emotional attention processes (Trevis, McLachlan, & Wilson, 2016), but also to affective disorders like depression or anxiety (Langguth, 2012), insomnia (Croenlein et al., 2016), and lowered quality of life (Nondahl et al., 2007; Weidt et al., 2016).
In most cases, the perception of the phantom sound seems to develop after loss of cochlear hair cells or other peripheral alterations leading to maladaptive plasticity in the auditory pathway and brain. It is still debated if and how either objective (Eggermont & Roberts, 2004; Mazurek et al., 2010; Schaette & Kempter, 2006) or “hidden” hearing loss (Adjamian, Sereda, Zobay, Hall, & Palmer, 2012; Schaette & McAlpine, 2011; Weisz, Hartmann, Dohrmann, Schlee, & Norena, 2006) contribute to tinnitus generation. Models of tinnitus generation and maintenance are still being debated (Sedley, Friston, Gander, Kumar, & Griffiths, 2016) and are limited by an underlying inherent heterogeneity of the disorder (Landgrebe et al., 2012). Yet, consensus arose that both the peripheral auditory system as well as differential brain networks are involved and correlate with differential aspects of tinnitus (Adjamian, Sereda, & Hall, 2009; De Ridder, Elgoyhen, Romo, & Langguth, 2011; De Ridder et al., 2014; Eggermont & Roberts, 2004; Elgoyhen, Langguth, De Ridder, & Vanneste, 2015; Jastreboff, 1990; Schlee, Mueller, et al., 2009).
Up to today, there is no generally applicable cure for this phantom sound perception. Established interventions aim at alleviating the tinnitus sound or accompanying symptoms (Baguley, McFerran, & Hall, 2013). Within a consensus clinical management framework (Langguth et al., 2013), three avenues of symptom-oriented interventions are suggested: First, ideally accompanying other treatment options (Baguley et al., 2013), cognitive behavioral therapy is suggested to establish coping strategies (Cima et al., 2012). A further option involves differential approaches of neuromodulation and stimulation (Hoare, Adjamian, & Sereda, 2016; Soleimani, Jalali, & Hasandokht, 2016) with concurrently increased efficacy applying multisite montages (Lehner, Schecklmann, Greenlee, Rupprecht, & Langguth, 2016), individual protocols (Kreuzer et al., 2017), and possibly combined approaches (Shekhawat, Kobayashi, & Searchfield, 2015; Teismann et al., 2014). Finally, auditory stimulation was traditionally studied and evolved to exert efficacy in suppressing tinnitus in sound therapies (Feldmann, 1971; Hazell & Wood, 2009; Henry, Rheinsburg, & Zaugg, 2004; Terry, Jones, Davis, & Slater, 1983; Vernon, 1977). Recent technical advances and neuroscientific research could spawn some promising approaches of auditory retraining aimed at reversing maladaptive neural plasticity related to tinnitus (Adamchic et al., 2017; Okamoto, Stein, et al., 2015; Stracke, Stoll, & Pantev, 2010; Tass, Adamchic, Freund, von Stackelberg, & Hauptmann, 2012). Yet, whereas masking alongside counseling in tinnitus management has proven efficacy and may be clinically implemented (Baguley et al., 2013), there is still debate about clinical use of aforementioned retraining approaches (e.g., Wegger, Ovesen, & Larsen, 2017).
The present study joins the branch of auditory stimulation in tinnitus with a focus on residual inhibition (RI; Roberts, 2007) or, more specifically, tinnitus suppression effects with patterned (here: amplitude-modulated [AM]) sounds. Recent studies aimed to demonstrate more pronounced tinnitus suppression after stimulation with AM or frequency-modulated (FM) sounds compared with unmodulated sounds and noise with inconclusive results (Neff et al., 2017; Reavis et al., 2012; Tyler, Stocking, Secor, & Slattery, 2014). This putative effect is primarily observed with sounds in or around the tinnitus frequency (Schaette, König, Hornig, Gross, & Kempter, 2010; Roberts, Moffat, Baumann, Ward, & Bosnyak, 2008; Roberts, Moffat, & Bosnyak, 2006; Sockalingam, Dunphy, Nam, & Gulliver, 2009) while its exact mechanisms of action remain unclear. Concretely, it is not known if and how modulated sounds may produce stronger and longer tinnitus suppression or RI than constant noise or pure tone (PT) sounds. This is partly explicable by the fact that, in classical masking and RI, only unmodulated sounds and noise have been used (e.g., Roberts et al., 2006, 2008; Terry et al., 1983).
Alternatively or concomitantly, neural entrainment effects may account for normalization of tinnitus-specific neural oscillations (Neff et al., 2017; Reavis et al., 2012) and in comparable disorders (e.g., pain [Ecsy, Jones, & Brown, 2017]). Neural entrainment describes the phenomenon of synchronization of endogenous neural oscillations to patterned or rhythmic external stimuli (here: auditory [Draganova, Ross, Wollbrink, & Pantev, 2008; Picton, John, Dimitrijevic, & Purcell, 2003]). Furthermore, changes in neurophysiology (Kaltenbach & Godfrey, 2008) or chemistry (Sedley et al., 2015) throughout the auditory pathway and the brain may also play a role but would have to be specifically tested and modeled with the modulated stimulus class.
Generally, a resurrection of interest in RI is observable in tinnitus research, as echoed and welcomed in a recent study by Fournier et al. (2018) Yet, given the multitude of possible mechanisms of action, the ongoing research on causes and mechanisms, the underlying problem of heterogeneity of tinnitus, limited methods, and the gap between human and basic animal research, it is difficult to propose an all-encompassing model of the mechanism of action of AM stimulation at this point. Beyond that, data are scarce and largely absent in the case of prolonged stimulation for possible tinnitus treatment with the modulated stimulus class. Therefore, it is deemed necessary to proceed in small steps and iterate on the immediate subjective effects of the stimulus class. Ideally, primary parameters of modulation rate, presentation level, carrier sounds or frequency (range), duration, and tolerability should be evaluated in respective study designs.
Psychological aspects, especially tolerability of tinnitus RI and therapeutic sounds, should be investigated, as they seem to be affecting tinnitus loudness perception (Durai, O’Keeffe, & Searchfield, 2017) or sound therapy treatment outcomes (Searchfield, Durai, & Linford, 2017). Furthermore, differences in general sound or specific stimuli tolerability could be mediated by personality (Searchfield et al., 2017) and are generally influenced by neurobiological interactions between auditory systems of perception and limbic systems related to valence (Kraus & Canlon, 2012). To sum up, psychological and biological factors, besides well-definable physical stimulus parameters, contribute to the perception of sounds or suppression of tinnitus and should be taken into account when studying induced tinnitus suppression. Concretely, studies should assess tolerability of tested sound stimuli to better understand the mechanisms of action in RI or sound therapy in tinnitus.
Former studies observed the potential to temporarily suppress tinnitus with 40 Hz AM and FM sounds in fixed frequency bands (Reavis et al., 2012), with 40 Hz AM pitch-matched sounds in contrast to broadband noise (Tyler et al., 2014), or with 10 Hz AM sounds at the matched tinnitus frequency in our former study (Neff et al., 2017). In more detail, our former study tested an explorative set of three 10 Hz AM with PT (at tinnitus frequency and 108 Hz) or FM sounds as carrier sounds, two 10 Hz (notch) filter modulations around tinnitus frequency with pink noise and music as carrier sounds, and two control stimuli (PT at tinnitus frequency, pink noise) in respect to RI after 3 minutes of stimulation at 60 dB SL. Post hoc contrasts between the stimuli indicated stronger RI for the AM sound at the tinnitus frequency compared with pink noise, AM at 108 Hz, and the filter modulated music, as well as stronger RI for the AM or FM sound compared with pink noise and music. The results from our former and the aforementioned previous studies were especially inconclusive when contrasting AM to PT sounds with identical carrier sounds. This contrast is deemed paramount to better understand the RI potential of AM and PT sounds as merely the modulation (i.e., AM) is manipulated while the other stimuli parameter (i.e., carrier sound and loudness) are controlled. In these previous studies, either carrier sounds were not matched to the tinnitus frequency (Reavis et al., 2012), or the contrast was performed between PT and noise carrier sounds (Tyler et al., 2014), or a wide array of differential sounds was used with no significant difference between AM and PT sounds matched at the tinnitus frequency (Neff et al., 2017). Moreover, the modulation rate was different with 40 Hz for Reavis et al. (2012) and Tyler et al. (2014) whereas our former study applied 10 Hz. Besides that, many aspects of the designs and analysis strategies of the studies are not directly comparable further adding to the limited insights regarding differences between modulated and unmodulated PTs. Taken together, no former study was specifically designed to test this critical contrast of interest. The aim of this study is therefore to compare AM with PT sounds at the matched tinnitus frequency to further elucidate efficacy in tinnitus suppression of the AM stimulus class.
Concretely, we hypothesize that AM sounds (with 10 and 40 Hz modulation) at the tinnitus frequency may elicit better short-term tinnitus suppression than their unmodulated PT pendants. Secondarily, we want to test if and how different sound levels during acoustic stimulation may influence this contrast by presenting the stimuli at SL plus 60 dB (Neff et al., 2017) compared with presentation 6 dB above individual’s minimum masking level (MML). While we expect generally stronger tinnitus suppression for the SL stimuli due to the higher presentation loudness compared with the MML stimuli, we still hypothesize that the effect of better suppression of AM compared with unmodulated sound will become evident in both loudness regimes. In addition, aiming both at better understanding of RI profiles and at possible future acoustic interventions for tinnitus, subjective evaluation of tolerability of the stimuli is deemed as critical and was assessed by means of pictorial scales (manikins) of valence and arousal (Bradley & Lang, 1994). Given the broad use of these pictorial scales for emotional assessment, also for reactivity to sounds (Bradley & Lang 2000), these scales are deemed as suitable to test the tolerability of stimuli used in this study. Hence, we expect better tolerability (reflected by higher valence and lower arousal scores) for the AM compared with the PT sounds. To the best of our knowledge, the present study is the first study to directly compare AM and PT sounds matched to the tinnitus frequency (i.e., using the same PT carrier sound). Results could have implications for both the RI phenomenon as well as for possible future sound therapies.
Methods
Overview and Nomenclature of the Acoustic Stimuli.

Note. SL = sensation level; MML = minimum masking level.
Participants’ Characteristics and Tinnitus Parameters (n = 29).

Note. TQ = tinnitus Questionnaire (Goebel & Hiller, 1994); THI = tinnitus handicap inventory (Newman et al., 1996); Mini-HQ9 = mini hyperacusis inventory (Goebel et al., 2013); VAS = visual analog scale; MML = minimum masking level.
Nearest frequency of pure-tone audiometry to the matched tinnitus frequency.
Participants
Twenty-nine patients (9 females, between age 18 and 75 years) with chronic bilateral tonal tinnitus (>12 months since tinnitus onset) from the Interdisciplinary Tinnitus Clinic of Regensburg were included in this study. Patients with a history or presence of any severe and relevant somatic, neurological, or mental disorders were excluded. Further exclusion criteria were ongoing intake of any psychotropic medication or substance and the participation in other tinnitus studies or treatments. The study was approved by the local ethics committee (16-101-0061). After a comprehensive explanation of the procedures, risks, and benefits, all participants gave written informed consent.
Psychometry
Upon the actual experiment, participants filled in an online questionnaire comprising German adaptations of the Tinnitus Sample Case History Questionnaire for clinical and demographic data (Langguth et al., 2007), tinnitus questionnaire (Goebel & Hiller, 1994), tinnitus handicap inventory (Kleinjung et al., 2007), and a short version of the hyperacusis questionnaire (mini-HQ9 [Goebel, Berthold, Scheffold, & Bläsing, 2013]).
Audiometry
Hearing thresholds were measured in the frequency range from 125 Hz to 8 kHz in octave steps with semioctave steps between 0.5 and 1 (i.e., 0.75 kHz), 1 and 2 (i.e., 1.5 kHz), 2 and 4 (i.e., 3 kHz), and 4 and 8 kHz (i.e., 6 kHz), respectively (Madsen Midimate 622D; GN Otometrics, Denmark). Sennheiser HDA 2000 headphones (Sennheiser, Germany) were used for audiometry, subsequent tinnitus matching, and the actual acoustic stimulation procedure.
Tinnitus Matching
Tinnitus matching was performed applying a method of adjustment approach (Henry, Rheinsburg, & Ellingson, 2004) with a custom-tailored MAX program (MAX 7; Cycling ′74, USA) and a modular hardware controller (Palette Expert Kit; Palette; Canada). For the actual procedure, we adhered to the sequence of the tinnitus tester procedure (Roberts et al., 2008) without tinnitus likeliness ratings, tests for RI, and loudness matching of 1 kHz reference tones. An octave confusion test was included at the end of the procedure. Participants were accustomed to the device and subsequently trained for the procedure. Main parameters of interest assessed by the matching procedure were tinnitus loudness (in dB), tinnitus side (on a continuum between 0 [=left ear] to 127 [=right ear] with the value of 63 representing equally distributed bilateral tinnitus) and tinnitus frequency (in Hz). The frequency dial’s step size (i.e., endless dial) was slightly below a semitone, and its frequency range between 40 and 16000 Hz. During the actual matching procedure, participants self-reliantly adjusted all the parameters with no need to check with the study personnel or a computer screen (tinnitus parameters were indicated on the controller upon touching of the respective control units): First, a 500 Hz PT was set to a comfortable level. Following on that, participants proceeded with the matching of the frequency. Finally, the sound was adjusted in loudness to fit the perceived tinnitus loudness and localized in the stereo spectrum with the panning dial. Participants were then given the opportunity to rate the correspondence between matched sound and their tinnitus as well as the general usability of the matching equipment on a scale ranging from 1 to 10. The time of the self-reliant matching procedure was assessed by the study personnel, and the matching procedure was repeated after acoustic stimulation described in the next paragraph. In the case of multiple tinnitus sensations, participants were instructed to focus on their dominant tinnitus.
Acoustic Stimulation
Five amplitude modulated sounds (10 or 40 Hz modulation rates at 60 dB SL and MML + 6 dB presentation loudness, and a single, inaudible 10 Hz stimulus 6 dB below SL) and two unmodulated sounds (PTs at 60 dB SL and MML) were prepared in MATLAB (MATLAB R2015a; Mathworks, USA) with the matched tinnitus pitch acting as the frequency of the PT carrier sounds. SL was defined by the hearing threshold at the frequency neighboring (i.e., lower) to the matched tinnitus frequency (e.g., the hearing threshold of 3 kHz when tinnitus frequency was matched to 3.2 kHz). In the remainder of the manuscript, the stimuli are termed as follows (Table 1): AM1060 refers to the AM sound modulated with 10 Hz at 60 dB SL, AM10MML to the 10 Hz AM sound at 6 dB above MML, AM4060 to the 40 Hz AM sound at 60 dB SL, AM40MML to the 40 Hz AM sound at 6 dB above MML, P60 to the PT at 60 dB SL, PMML to the PT at 6 dB above MML, and finally AM10U to the undetectable 10 Hz AM sound 6 dB below SL. The sum total of seven acoustic stimuli with 3 minutes of duration each was produced for each participant individually. Details regarding how stimuli were created are indicated in the section “Sound Stimuli” and Figure 1 of our previous publication (stimuli in the current study correspond to the “AMTinnitus” stimulus in the former study; Neff et al., 2017). The stimuli presented were matched in peak amplitude between the PT and AM stimuli classes in both loudness regimes. As a consequence, AM stimuli had a slightly lower root mean square sound pressure level (<5.3 dB root mean square for the AM sounds) compared with the PT sounds; 80 dBA (peak) was the upper limit for the sound level of all stimuli, which were presented idiotically. Participants were reminded to interrupt the procedure whenever a sound was deemed uncomfortable. No particular instruction was given to focus their attention on either the sound or tinnitus. Presentation sequence of the seven stimuli was randomized for each participant. To assess the residual tinnitus suppression of the sounds, participants were instructed to rate the loudness of their tinnitus on a numeric rating scale in percentage, compared with the prestimulation loudness (i.e., normal or recuperated loudness), after each stimulation at time points 0, 30, 60, 90, 120, 150, and 180 seconds (Neff et al., 2017; Reavis et al., 2012). Furthermore, participants were asked to rate all stimuli in valence and arousal on pictorial manikin scales with nine steps (Bradley & Lang, 1994). Participants were thus shown scales with increasing arousal states, represented by different stages of an explosion in the manikin’s chest region, and increasing valence ratings, represented by a spectrum between sad and smiling faces. At the end of the stimulation procedure, participants again performed the tinnitus matching task and were finally dismissed.
Mean hearing thresholds and matched tinnitus of all participants. Hearing thresholds: Colored ribbons indicate one standard deviation interval for the two ears, respectively. Tinnitus matching: Cyan diamonds are indicative individual tinnitus pitch and loudness matches. Notably, 80 dB was the upper limit for tinnitus loudness matches.
Data Analysis
R (R version 3.3.3; R Foundation for Statistical Computing, Austria) was used to calculate statistics including descriptives, Pearson correlations, and paired samples t test to test the matching outcomes as well as the differences in evaluation of the stimuli. To investigate the main research question, namely the difference between modulated and unmodulated sounds at the tinnitus frequency, mixed effect models were computed with the nlme package (https://cran.r-project.org/web/packages/nlme/). After identifying an effect for position (i.e., the order of the presented seven stimuli), the final model consisted of fixed effects for condition (i.e., different acoustic stimuli), random effects for time and subjects, and an added term for position as a covariate, both modeled linearly and with a polynomial term for optimal model fit. The model was fitted using the maximum likelihood method unbiased for the fixed effects and appropriate for the given sample size. A priori contrasts of interest were defined between AM and PT conditions for both stimulation level regimes (i.e., 10 and 40 Hz AM vs. PT sounds at 60 dB SL and MML).
Given the weak effects of previous work (Neff et al., 2017; Reavis et al., 2012; Tyler et al., 2014) and adherence to statistical rigor, we report the results of two-tailed tests. Both corrected (Bonferroni adjustment for the number of contrasts) and uncorrected results are reported side by side, which enables readers to draw their own conclusions from the results presented while we focus our discussion of results on significant and trending (i.e., p < .1) corrected results. For the exploratory analysis of valence and arousal related to the stimuli, two-tailed tests were used given the lack of a directed hypothesis. Furthermore, Bonferroni adjustment was performed for the number of contrasts.
Results
Participants’ Characteristics and Audiometry
Participants’ characteristics, questionnaire scores, and main tinnitus matching parameters are listed in Table 2. Mean hearing thresholds did not differ between the two ears (left side: mean = 21.21, SD = 9.54; right side: mean = 20.96, SD = 11.03; t(28) = 0.36, p = .722). Eleven participants indicated their tinnitus location in both ears, three inside the head, six in both ears stronger in the left ear, four in both ears stronger in the right ear, one in the left ear, and four in the right ear.
Tinnitus Matching
Results of the matching procedure before acoustic stimulation are listed in Table 2 and plotted in the audiogram of Figure 1. Participants’ ratings of the matched sound and the matching procedure were high (matched sound: mean = 8.66, SD = 0.936; matching procedure: mean = 8.62, SD = 1.237 [range 1–10]). Notably, all participants were able to match their single (or in three cases: dominant) tonal tinnitus with subjectively satisfactory results. We double-checked the outlier matching of 298 Hz (see Table 2 and Figure 1 with the participant [i.e., with multiple upward octave shifts, oral discussion]) with no change in the resulting matched frequency. Average time spent for the first matching run was 382 seconds (SD = 207). Moreover, there were no significant differences of matching parameters, namely tinnitus frequency, loudness, and side, t(max) = −0.644, p(min) = .525, between the matching procedures before and after the actual stimulation. This further enhances confidence in the applied matching method, which is also reflected by high correlations between matching parameters of interest (tinnitus frequency: r = .826, p < .001; loudness: r = .833, p < .001; side: r = .937, p < .001).
Tinnitus Suppression
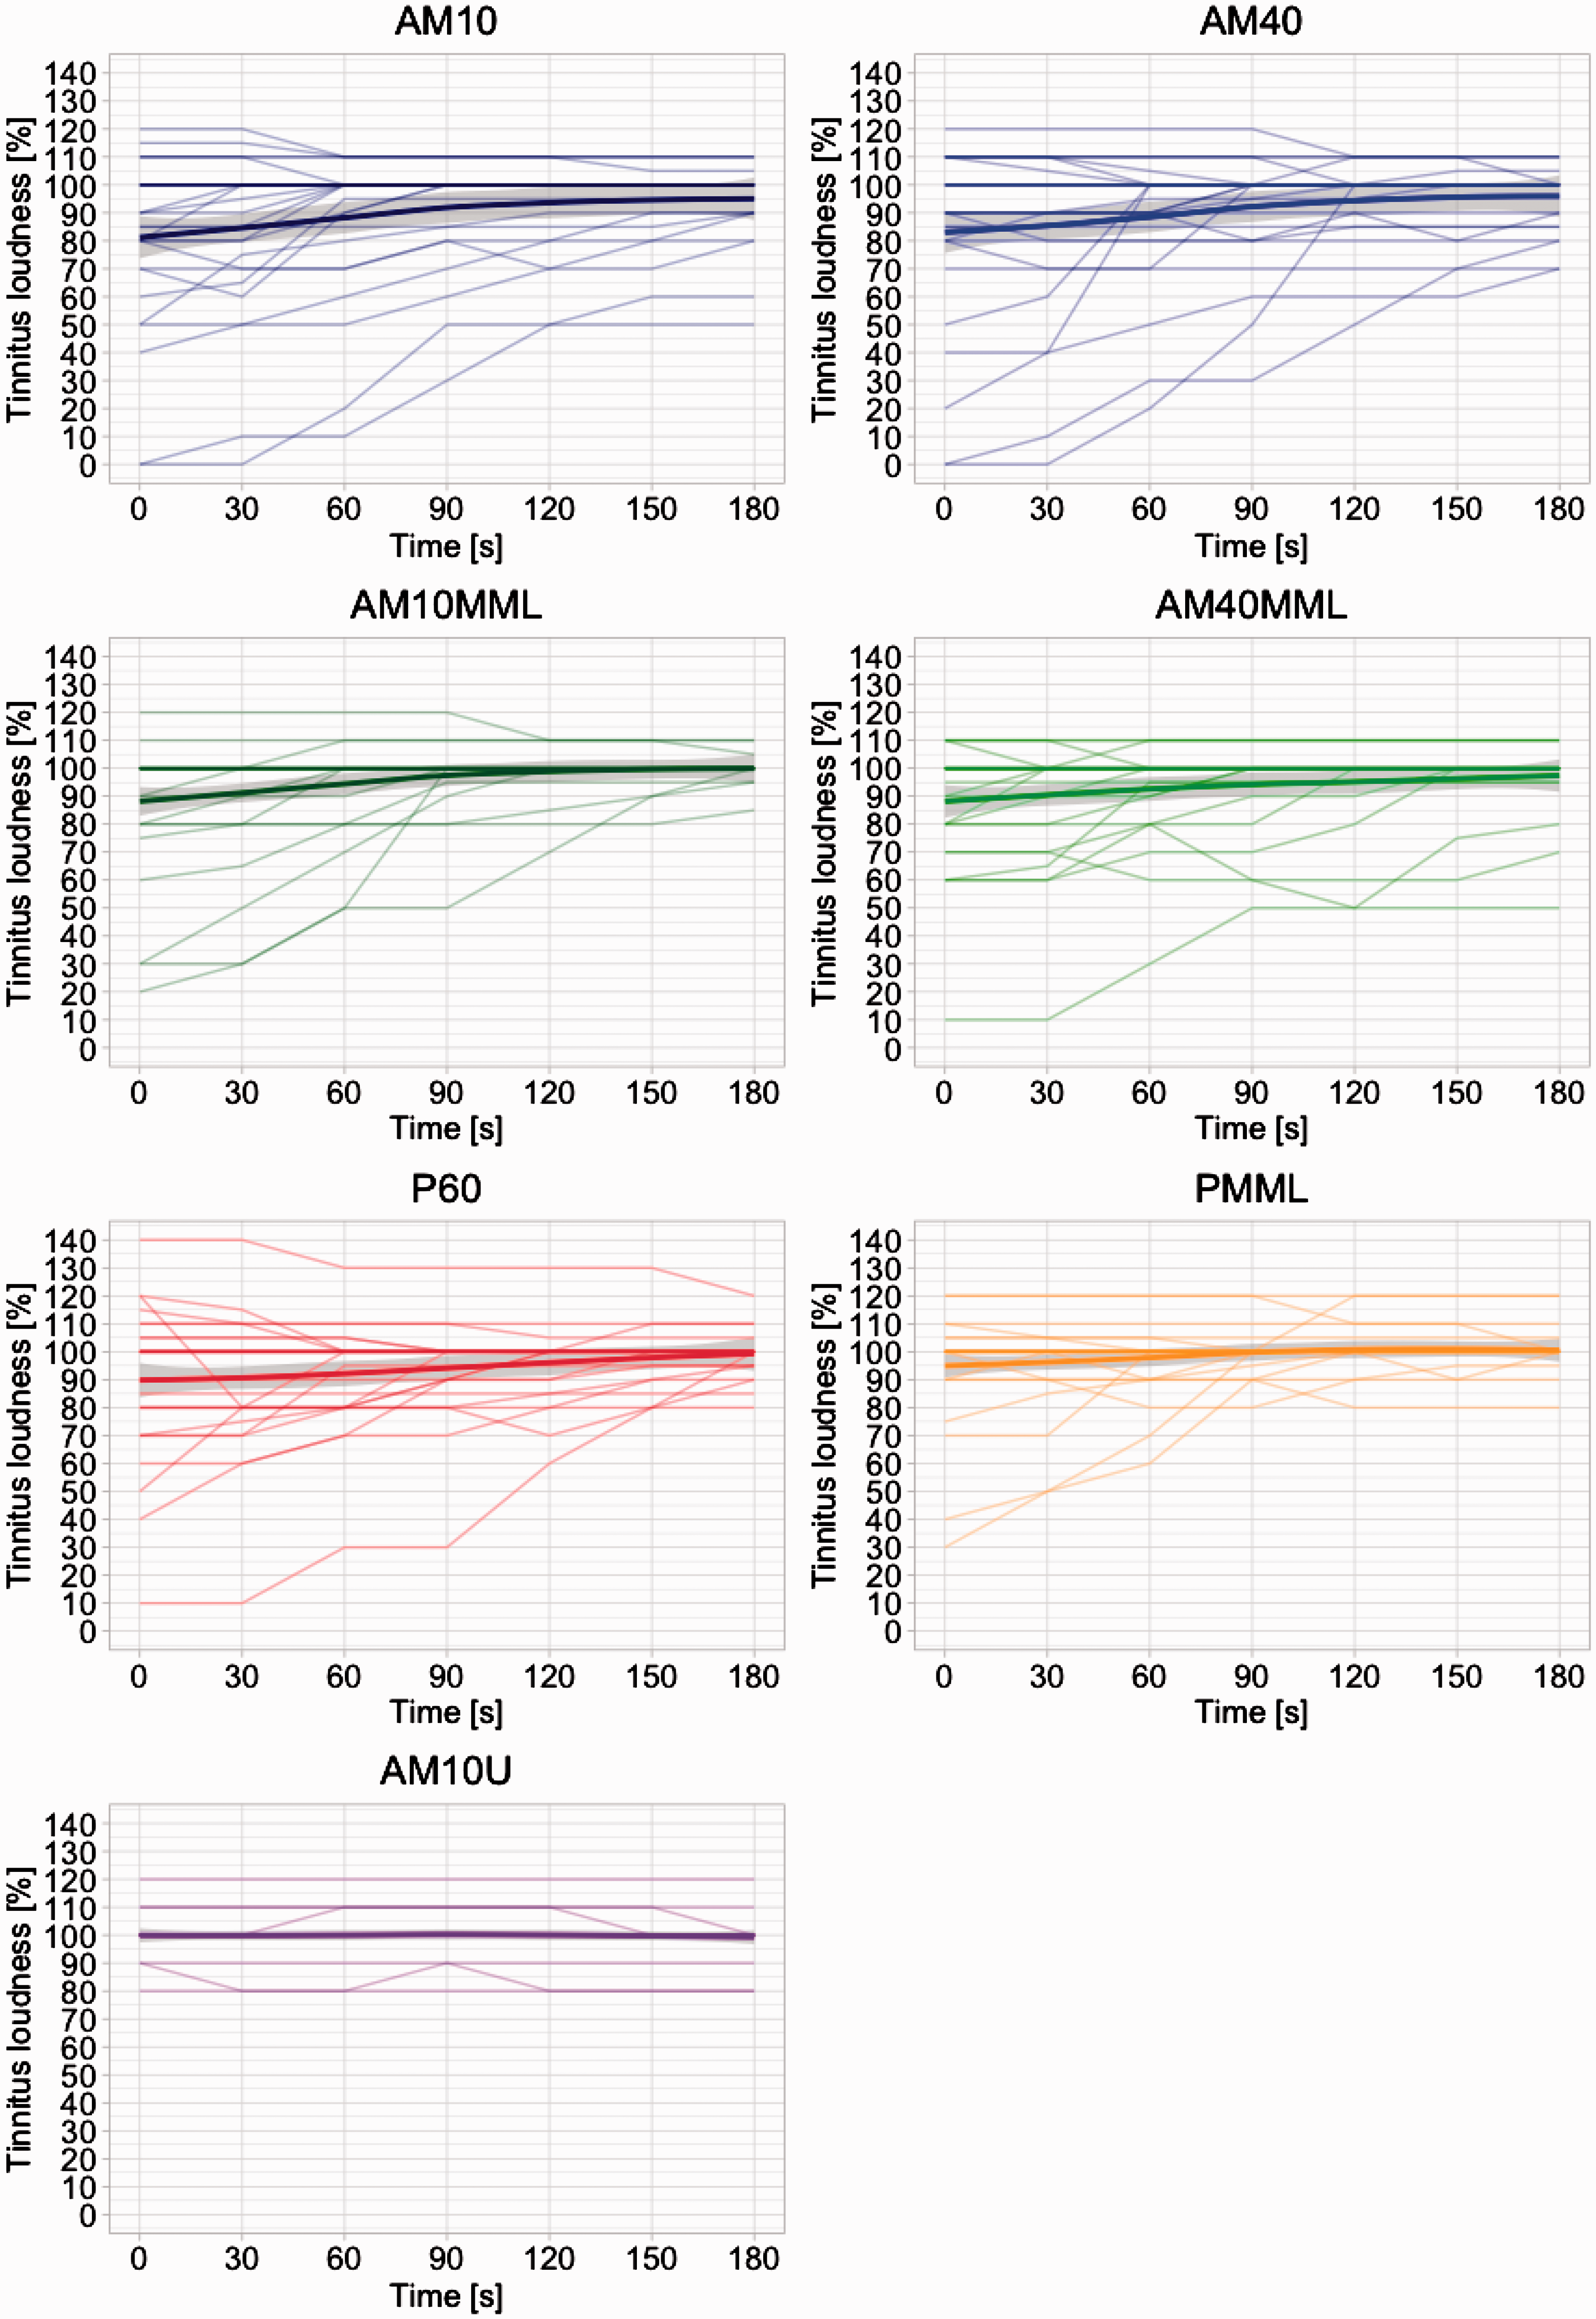
The mean tinnitus loudness suppression profile over time after stimulus offset is shown in Figure 2 and the single responses in Figure 3. Notably, tinnitus suppression is strongest 0 seconds after stimulus offset for all stimuli except AM10U and converges toward prestimulation loudness after 90 seconds toward 180 seconds. This pattern is typical for RI (Roberts, 2007), and only a few responses were indicative of temporarily increased tinnitus loudness (see Figures 3 and 4). AM sounds at 60 dB SL seem to exert the strongest suppression (AM1060 and AM4060) on average followed by their variations at MML and the PT at 60 dB SL. Finally, PMML and AM10U produced only slight or no average suppression, respectively. The results of the omnibus analysis of variance for the final model are listed in Table 3 and, in contrast to our previous study, indicative of a significant effect for position (i.e., the presentation order of the stimuli).
Mean tinnitus suppression after stimulus offset for all stimuli. Brackets indicate 95% confidence interval for each condition. Two-tailed tests of significance are reported (see Table 4). Generally, AM sounds tend to elicit slightly stronger or similar tinnitus suppression compared with PTs except the AM10U condition. Main contrasts of interest between AM and PT conditions for both stimulation levels show a trend toward more tinnitus suppression for AM1060 versus P60, t = 2.417, p(bonf) = .064, Table 4. Notably, this is only true for the main effect of condition and not the interaction of Condition × Time. Tinnitus suppression after stimulus offset for the single stimuli. Each line is representative of a single subject’s tinnitus loudness growth function after stimulus offset at 0 seconds. The mean response and the standard deviation (locally weighted scatterplot smoothing) are plotted as a thick line and a gray ribbon, respectively. Notably, the variability after stimulation offset is considerable while it converges over time as typical in RI (Roberts, 2007). Responder profiles of tinnitus suppression for all stimuli. Initial suppression after stimulus offset (t0) is plotted here. Suppression of >50% compared with prestimulus tinnitus loudness is considered “good” (green), “moderate” if <50% and ≥0% (light green), “same” if = 0%, and “worse” (i.e., residual excitation) if <0% (orange). Analysis of Variance of the Final Mixed Effects Model. Note. Poly = polynomial term. Degrees of freedom = 1,377. Notably, unlike in our previous study, an effect for position (order effect) was detected and had to be included as a covariate in the model (see Table 6 in the Supplemental Material for the interaction model). We observe significant effects for all main effects and the Interaction Condition × Time.


Within the mixed effects model, the contrasts of interest between AM1060/AM4060 and P60, and AM10MML/AM40MML and PMML, respectively, resulted in a trend for the main effect of condition of AM1060 versus P60 but not for AM4060 versus P60. This finding substantiates the observed tendencies in our previous article, partly confirms our hypotheses (trend in 1 of 4 contrasts), and is related to observations (Reavis et al., 2012; Tyler et al., 2014) that certain unmodulated sounds produce less tinnitus suppression than AM sounds. On the other hand, looking at stimulation levels near the tinnitus’ actual loudness (slightly below tinnitus loudness as in [Reavis et al., 2012] and 6 dB above MML in our study), no significant results can be observed for both 10 and 40 Hz contrasts.
As we identified an effect for position, we evaluated this position effect in an ancillary model seen in Table 6 (Supplemental material) to probe possible influences on the interpretation of the main results. In consequence, and in contrast to the prima facie impression of similar suppression curves of AM1060 and AM4060 in Figure 2, this may explain the null-finding of the contrasts AM4060 versus P60 in the final model with position as a covariate.
Tinnitus suppression in the responder profile (Figure 4) is defined as “good” if participants rated the tinnitus loudness to be at a level of 50% or less of the initial loudness, “slight” at a level of 55% up to 95%, “same” if unchanged (= 100%), and “worse” if loudness was temporarily increased at stimulation offset. Respective percentage values are plotted on the bars of each stimulus. The observed distributions further confirm that the observed tinnitus suppression, or RI potential of the AM stimulus class, is especially pronounced at high presentation levels.
Stimulus Evaluation
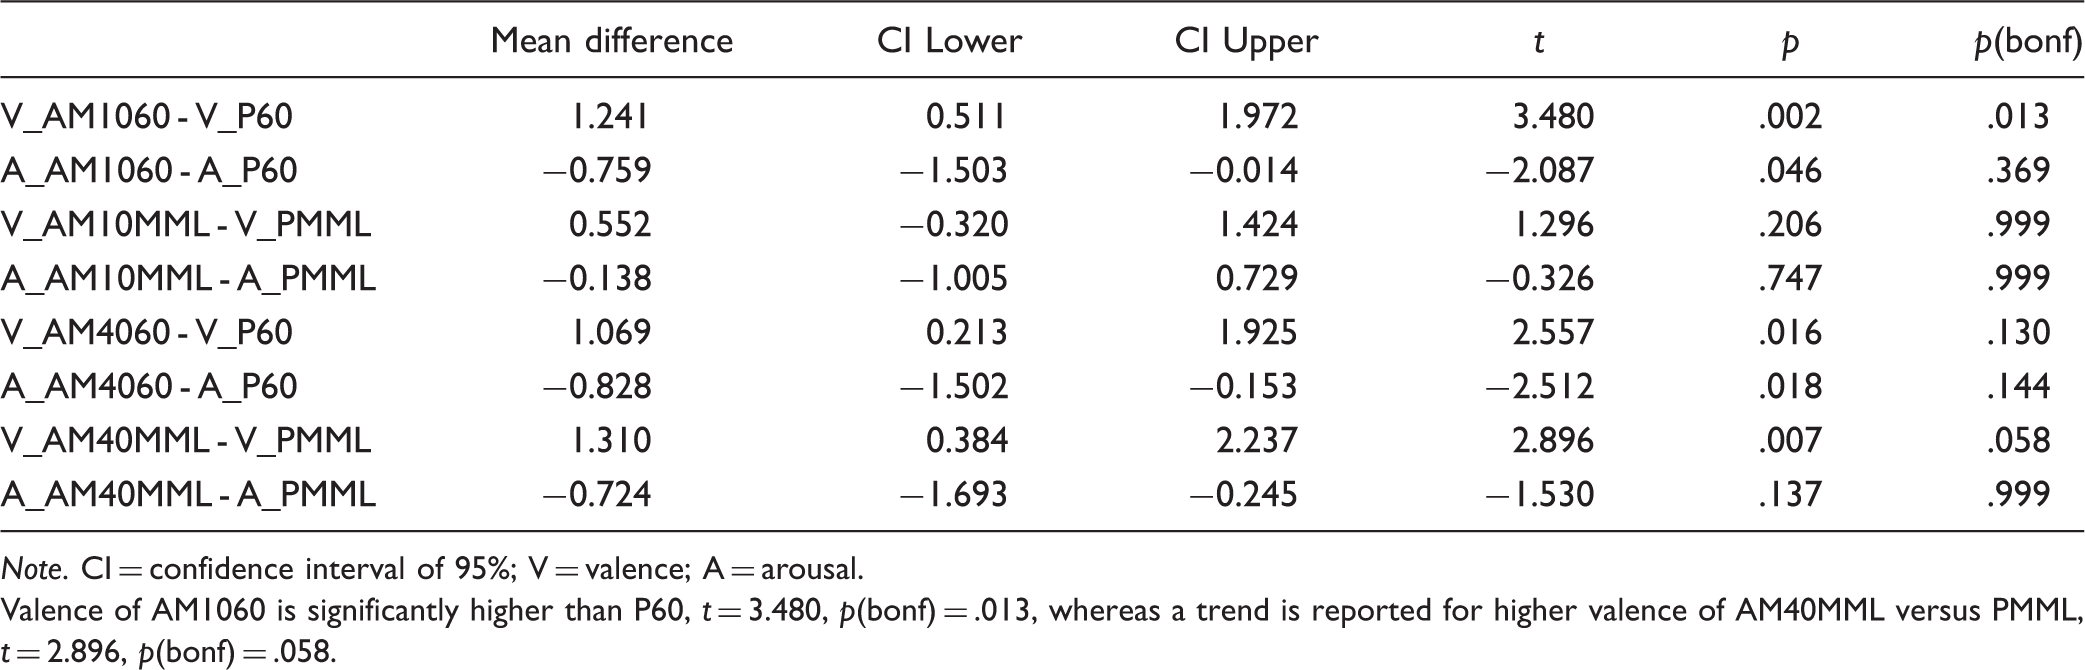
Valence and arousal scores for the entire set of stimuli are plotted in Figure 5, and statistical contrasts of interest are listed in Table 5. Of particular interest and partly according to our hypotheses, valence was rated significantly higher for AM1060 versus P60, t = 3.480, p(bonf) = .013, whereas only trends were observed AM40MML versus PMML, t = 2.896, p(bonf) = .058. Taken together, these results may imply a slightly better tolerability of the AM sounds compared with their PT pendants, while statistical differences were only observed for two out of four contrasts and not for arousal at corrected significance levels.
Valence and arousal rating for all stimuli. Brackets indicating 95% confidence interval for valence and arousal for each condition. P60 exhibits lowest tolerability mirrored by high arousal and low valence ratings. Results of the Contrasts of Interest in the Final Mixed Effects Model. Note. SE = standard error. Degrees of freedom = 1,377. Main contrasts of interest between AM and PT conditions for both stimulation levels show a trend of stronger tinnitus suppression for AM1060 versus P60, t = 2.417, p(bonf) = .064. Paired Differences of Valence and Arousal Between Stimuli Contrasts of Interest. Note. CI = confidence interval of 95%; V = valence; A = arousal. Valence of AM1060 is significantly higher than P60, t = 3.480, p(bonf) = .013, whereas a trend is reported for higher valence of AM40MML versus PMML, t = 2.896, p(bonf) = .058.

Discussion
The experimental study at hand examined the difference between AM and PT sounds at the tinnitus frequency regarding temporary tinnitus suppression. Specifically, we investigated whether AM sounds with modulation rates of 10 and 40 Hz (four sounds) induce stronger tinnitus suppression after stimulation than unmodulated PTs (two sounds) within two stimulation level regimes, namely 60 dB SL and 6 dB above MML (both at the tinnitus frequency). In an additional exploratory analysis, we compared both valence and arousal of the different stimuli between the two stimuli classes. The aim of this analysis was to further evaluate if AM sounds are suitable to induce residual tinnitus suppression, or RI, and beyond that, may qualify as possible principles for tinnitus sound therapy.
The results, taking into account the effect of position (i.e., presentation order of the stimuli), could not convincingly show (i.e., only producing a trend) that 10 Hz AM sounds in the matched tinnitus frequency produce stronger tinnitus suppression on average after stimulation than unmodulated PTs in the same frequency at stimulation level 60 dB above SL. Looking at different modulation rates (i.e., 40 Hz) and stimulation levels (i.e., 6 dB above MML), we can only report nonsignificant results at the corrected level. Generally, but especially in the case of the AM4060, this may be explained by an (unfortunate) order effect (see Tables 4 and 6). The absent significant effects of the same contrasts at the lowered stimulation level 6 dB above MML may be furthermore explained by the inherent increased sound energy in the stimuli at the 60 dB SL level. Yet, given the observed statistical trend and the considerably large array of similar sound stimuli (i.e., identical regarding their carrier frequency at the matched tinnitus frequency), these results may not come as a surprise but rather may be better elucidated in a sleeker experimental design where presentation level regimes are not mixed within one experiment or experimental block. We find this interpretation further plausible, as the narrow spectrum of different carrier sounds in the study at hand, in contrast to the wide array of carrier sounds in our former study (Neff et al., 2017), may have eased learning effects and therefore introduced the observed position effect. In conclusion, we only observed trends of better tinnitus suppression properties for 10 Hz AM sounds compared with their unmodulated pendants at 60 dB SL presentation level. These results are partly in line with previous inconclusive findings (Neff et al., 2017; Reavis et al., 2012; Tyler et al., 2014) in that they show a tendency of stronger residual tinnitus suppression than commonly used unmodulated sounds. Notably, the current study is the first one directly comparing AM and PT sounds with matched tinnitus tones as carriers.
The comparison between arousal and valence ratings between modulated and unmodulated stimuli is similar to the findings in tinnitus suppression, as AM1060 elicits significantly higher valence but not lower arousal (see Table 5). Different modulation rates and stimulation levels only produced a trend in differences of arousal and valence between conditions of interest, namely higher valence for AM40MML compared with PMML (Table 5). A former study (Terry & Jones, 1986) compared a variety of different tones and sounds. Their results did not show any specific difference between AM and PT, while filtered noises were generally less annoying than tones. As noise stimuli were not used in the current study, we cannot provide data on a contrast between tones and noise at this point.
Taken together, these results indicate that tolerability for AM sounds seems to be slightly better compared with PTs, especially in the ratings of valence. At the same time, the high valence ratings were usually accompanied by low arousal ratings further supporting better tolerability of the AM sounds. On the other hand, it cannot be disputed that the effect is not consistent across the different stimulation levels and modulation rates and almost totally absent in the case of arousal. The latter observation may be further explained by the assumption that arousal is a concept not directly accessible to one’s conscious evaluation, complicating the abstract task of judging a sound along this particular categorization system. Future studies should consider these shortcomings by elaborating on subjective evaluations of stimuli. Nevertheless, we still conclude that the stimulus class of AM sounds was well tolerated by participants, at least for the stimulation duration of 3 minutes.
A possible mechanism of action for the observed tinnitus suppression of the AM stimulus class beyond the respective body of knowledge in RI research (Roberts, 2007) may be neural (or cortical) entrainment which normalizes aberrant neural oscillations acting as putative correlates of tinnitus (Reavis et al., 2012) or other pathologies (e.g., in pain with alpha entrainment [Ecsy et al., 2017] or in schizophrenia with gamma entrainment [Voicikas, Niciute, Ruksenas, & Griskova-Bulanova, 2016]). A respective entrainment of neural oscillations may be especially relevant for specific frequency bands in tinnitus like alpha (Weisz, Moratti, Meinzer, Dohrmann, & Elbert, 2005) or gamma (Ashton et al., 2007; Sedley et al., 2012; Weisz, Dohrmann, & Elbert, 2007). Yet, the exact role of these frequency bands in the tinnitus pathology is still under debate. In any case, we agree with the considerations of Reavis et al. (2012) that modulated sounds, contrary to noise or PTs that mostly produce onset and offset auditory cortical activity, may produce sustained acoustically driven activity that may help restructure cortical firing patterns away from those that generate tinnitus. A comparable model has been postulated where prolonged tinnitus suppression or RI may be explained by inhibition of central synchrony via feedforward projections (Noreña & Eggermont, 2003; Roberts et al., 2010). AM sounds in the alpha band may also have an influence on tinnitus maintenance or attentional networks through a temporary up-modulation of alpha networks driven by the auditory stimulus. This up-modulation may then reinstantiate the shifted brain network homeostasis in tinnitus (e.g., the decay of wide-spread alpha networks, [related] increase of gamma networks [Schlee, Hartmann, Langguth, & Weisz, 2009]). Regarding possible alpha entrainment, we cannot rule out effects of general relaxation (Hartmann, Lorenz, Müller, Langguth, & Weisz, 2013) or mere attentional processes, as the alpha band is at the lower bound of the spectrum of entrainable oscillations (Joris, Schreiner, & Rees, 2004; Picton et al., 2003). At this point, we also embrace the possibility of similar effects produced by stimuli with modulation rates other than 10 or 40 Hz, particularly covering frequency bands higher than 40 Hz (e.g., 20–100 Hz electrical stimulation of the cochlea [Zeng et al., 2011]). Yet, with increasing modulation frequency (>40 Hz), modulated acoustic stimuli start to produce residual tones (Joris et al., 2004) and furthermore elicit less cortical entrainment (Picton et al., 2003).
Taking an all-embracing point of view given the various systems of the auditory hierarchy from the inner ear to the brain influenced by acoustic stimulation, it may be conceivable that the observed suppression effect of AM or generally modulated sounds is a conglomerate of altered activity in the auditory pathway, central auditory cortex, and widespread cortical network activation as sketched earlier. To continue this line of research, entrainment and RI effects should therefore be studied using electro- or magnetoencephalographic methods where direct causal relationships between cortical entrainment, RI, and tinnitus suppression can be tested. Beyond that, the influences of the putative entrainment mechanism and the mere RI effect of the carrier sound (here: matched tinnitus frequency) have to be differentiated to better understand the individual and joint mechanisms of action on tinnitus suppression.
Limitations
Unfortunately, five participants did not meet the criterion of bilateral tinnitus contrary to their declaration during recruitment and the informed consent procedure. At this point, we would like to point to a possible inaptitude of tinnitus sufferers to generate valid self-reports of tinnitus characteristics (Pryss et al., 2018) and also to fluctuations of the tinnitus percept over time (Probst et al., 2017). Certainly, this issue should be considered in future studies and respective audiometric features of tinnitus specifically tested at the recruitment or informed consent stage of the study’s proceedings. In this study, all participants were consequently stimulated idiotically to adhere to the study protocol.
More importantly, AM stimuli with pure-tone carriers naturally introduce sidebands alongside the carrier sound (Zwicker & Fastl, 2013), which in turn may generate off frequency patterns of activation and distortion products on the basilar membrane. These phenomena could produce a different and possibly greater afferent drive on the auditory system. The (increased) auditory input related to the sidebands may therefore explain the larger tinnitus suppression by the AM sounds in our results. As the study at hand does not allow for further insights on this issue, future studies could take this issue into account by increasing the number and range of tested modulation frequencies. In such a research design, sideband parameters could then be included and tested in statistical modeling of the tinnitus suppression as predictors or covariates.
Finally, the position effect emerging from the data and included in the final fitted model was detrimental on significance levels of the main contrasts of interest. Future studies should therefore consider smaller stimuli sets, a shorter stimulation duration per stimulus and more repetitions in a well-balanced randomized design.
Conclusion
Despite the mentioned limitations and inconclusive results as well as mechanisms of action, we conclude that AM sounds in the matched tinnitus frequency are effective in temporarily suppressing tinnitus. This conclusion is substantiated by similar or slightly stronger tinnitus suppression or RI effects of AM compared with PT sounds and slightly better tolerability of the AM stimulus class by tinnitus sufferers. Future work should focus on understanding the neurophysiological correlates of the observed suppression effects during and after the acoustic stimulation as well as on testing long-term effects of the approach. Given the efficacy, tolerability, and simplicity of use, we furthermore propose the studied stimulus class as a suitable principle to be tested for masking or long-term tinnitus sound therapy.
Footnotes
Declaration of Conflicting Interests
The authors declared no potential conflicts of interest with respect to the research, authorship, and/or publication of this article.
Funding
The authors disclosed receipt of the following financial support for the research, authorship, and/or publication of this article: This research was supported by the University Research Priority Program “Dynamics of Healthy Aging” of the University of Zürich, Swiss National Fund “Early Postdoc Mobility,” and TINNET - COST Action BM1306 “Better Understanding the Heterogeneity of Tinnitus to Improve and Develop New Treatments.”