
Abstract
The objective was to determine the effects of two frequency-lowering algorithms (frequency transposition, FT, and frequency compression, FC) on audibility, speech identification, and subjective benefit, for people with high-frequency hearing loss and extensive dead regions (DRs) in the cochlea. A single-blind randomized crossover design was used. FT and FC were compared with each other and with a control condition (denoted ‘Control’) without frequency lowering, using hearing aids that were otherwise identical. Data were collected after at least 6 weeks of experience with a condition. Outcome measures were audibility, scores for consonant identification, scores for word-final /s, z/ detection (S test), sentence-in-noise intelligibility, and a questionnaire assessing self-perceived benefit (Spatial and Qualities of Hearing Scale). Ten adults with steeply sloping high-frequency hearing loss and extensive DRs were tested. FT and FC improved the audibility of some high-frequency sounds for 7 and 9 participants out of 10, respectively. At the group level, performance for FT and FC did not differ significantly from that for Control for any of the outcome measures. However, the pattern of consonant confusions varied across conditions. Bayesian analysis of the confusion matrices revealed a trend for FT to lead to more consistent error patterns than FC and Control. Thus, FT may have the potential to give greater benefit than Control or FC following extended experience or training.
Introduction
A dead region (DR) is a region of the cochlea where the inner hair cells, synapses, or neurons are functioning so poorly that a tone that would normally be detected in that region is detected at an adjacent region (Moore, 2001, 2004). This is called off-place or off-frequency listening. DRs cannot be diagnosed reliably from the audiogram, but they are often associated with audiometric thresholds greater than 70 dB HL (Aazh & Moore, 2007; Vinay & Moore, 2007) and steeply sloping hearing loss (Markessis, Kapadia, Munro, & Moore, 2006; Moore, 2004; Preminger, Carpenter, & Ziegler, 2005), and they are most commonly present at high frequencies (Cox, Alexander, Johnson, & Rivera, 2011; Vinay & Moore, 2007). DRs are present for about one third of hearing-aid users or new referrals for hearing-aid fitting (Pepler, Munro, Lewis, & Kluk, 2014). In most cases, DRs are present in small areas of the cochlea, corresponding to only one or two test frequencies. Such restricted DRs appear to have no consequences for the fitting of hearing aids (Cox et al., 2011; Malicka, Munro, Baer, Baker, & Moore, 2013; Pepler, Lewis, & Munro, 2016). However, in 3% of cases, DRs are present at three or more consecutive audiometric frequencies (Pepler et al., 2014). These are defined as extensive DRs. For people with extensive high-frequency DRs, with edge frequency fe and no identifiable upper edge, there is usually no benefit from amplification of frequency components falling above about 1.7fe (Baer, Moore, & Kluk, 2002; Malicka et al., 2013; Moore, 2002; Vickers, Moore, & Baer, 2001).
Frequency-lowering hearing aids have been used to convey high-frequency information to listeners with high-frequency hearing loss (Auriemmo et al., 2009; Glista et al., 2009; Robinson, Stainsby, Baer, & Moore, 2009; Simpson, Hersbach, & McDermott, 2005). These hearing aids lower the frequencies of components within a source band to place them in a destination band of lower frequency. There are many ways of implementing frequency lowering (Alexander, 2013; Braida et al., 1979; Simpson, 2009). Two popular methods are frequency transposition (FT) and frequency compression (FC). These are illustrated in Figure 1. With FT, the source and destination bands have the same width, and the frequency of each component in the source band is reduced by a fixed amount in Hertz. The transposed sounds are usually superimposed on the frequency components originally present in the destination band. With FC, the shift of the frequency components in the source band increases with increasing frequency within the source band. FC uses a source band that is wider than the destination band, and the source and destination bands have the same lower edge frequency, which is defined as the starting frequency (SF). Frequency components below the SF are left unchanged, and frequency components above the SF are lowered.
Schematic representation of frequency transposition (FT, bottom left) and frequency compression (FC, bottom right). For FT, the source band (SB) and the destination band (DB) have the same width. For FC, the destination band is narrower than the source band.
Studies evaluating various FT systems (Alexander, Kopun, & Stelmachowicz, 2014; Auriemmo et al., 2009; Kuk, Keenan, Korhonen, & Lau, 2009; Miller, Bates, & Brennan, 2016; Robinson, Baer, & Moore, 2007; Robinson et al., 2009; Salorio-Corbetto, Baer, & Moore, 2017a) and FC systems (Bohnert, Nyffeler, & Keilmann, 2010; Ellis & Munro, 2015; Glista et al., 2009; Hillock-Dunn, Buss, Duncan, Roush, & Leibold, 2014; Hopkins, Khanom, Dickinson, & Munro, 2014; John et al., 2014; Kokx-Ryan et al., 2015; Picou, Marcrum, & Ricketts, 2015; Simpson et al., 2005; Simpson, Hersbach, & McDermott, 2006; Wolfe et al., 2010, 2011, 2015) have given mixed results. Some studies revealed benefits of FT or FC over conventional amplification, while others failed to show any benefit. This discrepancy could be partly due to the variety of experimental designs employed, as many of these studies were carried out in clinical contexts that constrained design options. As a consequence, some of the designs used could have introduced bias. For example, in some studies, the experimental condition with frequency lowering was always tested second (Auriemmo et al., 2009; Gifford, Dorman, Spahr, & McKarns, 2007; Kuk et al., 2009; Wolfe et al., 2011), or in an ‘A-B-A’ format where the control condition was used for two short periods at the beginning and end of the trial, and the experimental condition was used for a longer period in the middle of the trial (Ellis & Munro, 2015; Glista et al., 2009; Simpson et al., 2005, 2006). This could introduce learning and order biases. In other studies, training was used for the experimental condition but not for the control condition (Korhonen & Kuk, 2008; Kuk et al., 2009). This can introduce confounds (Füllgrabe, Baer, & Moore, 2010; Ling, 1968). Finally, in some studies, performance with frequency lowering was compared with performance with the participants’ own hearing aids (Bohnert et al., 2010; Miller-Hansen, Nelson, Widen, & Simon, 2003; Parent, Chmiel, & Jerger, 1997) or with no amplification (Miller-Hansen et al., 2003). Using the participants’ own hearing aids could lead to differences across conditions due to differences between microphones, receivers, and features of the hearing aids other than frequency lowering.
In addition, variability across studies can be partly ascribed to the characteristics of the participants. Most studies using participants with profound hearing loss at high frequencies failed to show any advantage of frequency lowering (Gifford, Dorman, Spahr, & Bacon, 2007; Hopkins et al., 2014; McDermott & Dean, 2000; Perreau, Bentler, & Tyler, 2013; Simpson et al., 2006). One possible reason for this is that the destination band included frequencies where hearing thresholds were high, limiting the ability to use the frequency-lowered information within the destination band. In addition, many of the participants with profound loss at high frequencies could have had DRs. As noted earlier, participants with extensive high-frequency DRs usually do not benefit from amplification of frequencies above 1.7fe. This has implications for the choice of the source and destination bands and for the potential benefit of frequency lowering. For example, one would not expect a benefit of frequency lowering if the destination band falls entirely above 1.7fe. In most studies of frequency lowering, tests for DRs were not carried out, and, when they were (Ellis & Munro, 2015; Glista, Scollie, & Sulkers, 2012; Glista et al., 2009), the settings of the frequency lowering were not based on the outcomes of the tests. To our knowledge, only Robinson et al. (2009) and Salorio-Corbetto et al. (2017a) selected the settings of the frequency lowering based on the characteristics of the DRs of the participants, and no previous studies have compared FC and FT directly in a field trial.
The goals of the present study were to evaluate and directly compare FT, FC, and a control condition without frequency lowering, denoted ‘Control’, using wearable hearing aids for participants with extensive high-frequency DRs. The hearing aids were otherwise identical across conditions. The FT algorithm was essentially the same as described by Robinson et al. (2007) and Robinson et al. (2009). However, unlike the studies of Robinson et al., the hearing aids used here incorporated multichannel amplitude compression, noise reduction, and feedback cancellation. In addition, Robinson et al. (2009) allowed their participants to switch between FT and a control condition with no FT via the multimemory capability of their hearing aids. This might have prevented the participants from learning to use the new speech cues conveyed by FT. Here, a crossover design was used to overcome this limitation and to avoid potential biases that could have influenced the outcomes of previous studies on frequency lowering, as described earlier. The destination bands were chosen to fall at low frequencies to increase the likelihood of the lowered components being audible and to avoid those components falling above 1.7fe. Conditional FT and FC were used; the frequency lowering occurred only when the short-term ratio of high-frequency to low-frequency energy was above a predefined value. This was done to reduce sound-quality degradation (Posen, Reed, & Braida, 1993; Robinson et al., 2007, 2009; Salorio-Corbetto, Baer, & Moore, 2017b) and to increase the audibility of the frequency-lowered information for users with steeply sloping hearing loss. Each participant wore the hearing aids using a given condition for at least 6 weeks before being evaluated and then switched to the next condition. The order of the three conditions was counterbalanced across participants. Outcome measures were consonant and speech recognition and word-final /s/ and /z/ detection. The patterns of consonant confusions were analyzed in order to understand how FT and FC affected the identification of consonants. A measure of self-perceived benefit was also included.
Methods
Participants and Hearing Assessment
Sixteen participants with bilateral extensive DRs were recruited from the laboratory database, and via private hearing-aid clinics, lip-reading classes, charities involved in hearing loss, and the audiology department at a local Hospital. Three of these participants failed to turn up for all of the initial assessment sessions, and 13 participants were enrolled in the study. Three of the 13 dropped out, as explained later, so results were obtained for 10 participants (3 women). Their median age was 70 years (range 47–78). Four participants (P2, P10, P14, and P17) had a history of acute or chronic exposure to loud sounds, and six (P3, P9, P12, P13, P14, and P15) had a history of familial hearing loss. One participant (P13) was unsure when his hearing loss started. The median duration of hearing loss for the other participants was 26 years (range 6–36 years). All but two participants (P3 and P13) wore hearing aids regularly. The median duration of hearing-aid use was 22 years (range 6–30 years). All participants were native speakers of British English. Seven had no indication of middle-ear dysfunction, as determined by otoscopic examination, tympanometry, and bone-conduction audiometry. Three had indications of middle-ear dysfunction. P10 had a tympanic membrane perforation in his left ear, and P12 had a tympanic membrane perforation in his right ear. P10 also had middle-ear dysfunction in his right ear, as suggested by an air-bone gap in audiometric thresholds at low frequencies, but no tympanic perforation was present and his results for tympanometry were normal. Audiometry for P17 revealed a large air-bone gap for the right ear, but results for tympanometry were normal. The left ear of P17 was tested, and the right ear was plugged during testing.
Basic Hearing Assessment
Air-Conduction Audiometric Thresholds of the Participants.

Note. Where the participant did not respond to the presentation of sound at the maximum level tested, this level is indicated followed by ‘N/R.’ The median and range of thresholds for each frequency across ears are indicated. To compute medians (Med.) and ranges, thresholds above the maximum level tested were assumed to be five decibels above that level. The outcomes of the TEN(HL) test are indicated by a symbol following the value of the hearing threshold. Two asterisks indicate a positive result. One asterisk indicates an inconclusive result. A hash symbol indicates that the test could not be carried out as the tone signals required had a level above the maximum possible.
Detection and Characterization of DRs
DRs were characterized using the same methods and equipment as described by Salorio-Corbetto et al. (2017a, 2017b). A DR at the base of the cochlea is characterized by its lower edge frequency, fe (Moore, 2001), defined by the value of the characteristic frequency of the functioning place in the cochlea just below the DR. To detect any DRs, the threshold equalizing noise, TEN(HL) test (Moore, Glasberg, & Stone, 2004) was conducted for frequencies between 0.5 and 4 kHz. The recommended presentation level of the TEN, measured in dB HL/ERBN, is at least 10 dB above the hearing threshold for the test frequency in quiet. However, many participants had a narrow dynamic range, which limited the maximum TEN levels that could be used. Therefore, in some cases, levels lower than the recommended level were used. However, in most cases, the TEN level was equal to or above the absolute threshold. Due to high thresholds, the test could not be performed at all frequencies in some cases.
Table 1 shows the outcome of the TEN(HL) test for each participant. There were three possible outcomes: (a) Positive (DR found): The masked threshold of the tone in the TEN was 10 dB or more above the absolute threshold and 10 dB or more above the TEN level, (b) Negative (no DR found): The masked threshold of the tone in the TEN was 10 dB or more above the absolute threshold and less than 8 dB above the TEN level, and (c) Inconclusive: The masked threshold was 8 dB above the TEN level or the recommended level could not be used so the masked threshold of the tone in the TEN was less than 10 dB above the absolute threshold. For inconclusive cases, where possible, the test was repeated using a higher level of the TEN (Moore, 2004).
The TEN(HL) test gives only an approximate estimate of fe (Kluk & Moore, 2006). The values of fe were estimated more accurately using fast psychophysical tuning curves (PTCs; Sek & Moore, 2011). The signal frequency was selected as described later, and the signal level was fixed at 10 dB SL. The masker was a narrowband noise whose center frequency was slowly swept from low to high (upward sweep) or vice versa (downward sweep). The masker level was increased when the participant pressed a key to indicate that the signal was audible and decreased when the participant released the key. For most participants, the masker level changed by 2 dB/s. However, for P14 (left ear) and P15 (right ear), a rate of 1.5 dB/s was used, as this led to more consistent results.
The frequency at which the masker level is lowest, that is, the tip of the PTC, is called the minimum masker frequency (MMF). When the signal frequency does not fall in a DR, the MMF falls close to the signal frequency. When the signal frequency falls in a basal DR, the MMF falls below the signal frequency. The value of the MMF gives an estimate of fe (Kluk & Moore, 2006).
First, an upward-sweep fast PTC was obtained for one or more frequencies where the outcome of the TEN(HL) test was negative. This was done to verify that the participant was able to carry out the task; the fast PTCs were expected to have MMFs close to the signal frequency in such cases. For subsequent PTCs, the frequency of the signal was increased in one-octave steps or up to the highest frequency for which the 10 dB SL signal was comfortably loud. Once a shifted MMF was obtained, an upward-sweep and a downward-sweep PTC were obtained for that signal frequency for most participants.
The MMF was estimated in the following way. First, the raw data were smoothed by taking a 4-point moving average. Then, spline interpolation was used to estimate the masker levels at a selected set of masker frequencies, and the levels were averaged across the upward and downward sweeps. The masker center frequency corresponding to the lowest level of the masker in the final average was taken as the estimate of the MMF. For P15’s right ear, most downward sweeps led to a flat PTCs without a tip. For that reason, the 4-point moving average of two runs obtained with an upward sweep was used for this ear. The MMF was taken as the estimate of fe.
Figure 2 shows the fast PTCs for all ears except P13 (right ear) and P17 (right ear); fast PTCs for these could not be obtained due to the very high output levels that would have been required. It should be noted that there was a high incidence of inconclusive results due to the severity of the high-frequency hearing losses of the participants. When testing at a given frequency could not be performed at all or was performed using suboptimal levels of the TEN, if a DR had been identified at lower frequencies and the hearing loss increased or remained the same as at lower frequencies, the DR was assumed to extend to all frequencies above fe. It was not possible to determine the upper edge of the DRs for any of the participants. According to these criteria, all participants had extensive high-frequency DRs, with fe values ranging from 0.4 to 2 kHz.
Fast PTCs for each ear. Participants are identified by P followed by a number and a subscript indicating the ear, right (R) or left (L).The signal frequency (fs)and level in each case are indicated by a star. The minimum masker frequency (MMF) is shown. The jagged line indicates the masker level as a function of masker center frequency. Two PTCs are plotted, one for an upward frequency sweep and one for a downward frequency sweep, except for P15R, as described in the text. The green line shows the smoothed curve derived from the two PTCs.
Experimental Design
The hearing aids were evaluated using a single-blind three-period, three-condition crossover design. Participants were blind to the condition that was being tested in order to avoid bias (Bentler, Niebuhr, Johnson, & Flamme, 2003; Dawes, Hopkins, & Munro, 2013). The order of conditions was varied across participants to control for carryover and learning effects. Participants were assigned to conditions using sampling without replacement, so that all possible orders of conditions were used. It was intended to use a balanced design with 12 participants (plus one “spare” to allow for a drop out) but, 3 participants dropped out, leaving 10, so the design was not fully balanced.
Each period of aid use for a given condition lasted for 6 to 9 weeks. Outcome measures were obtained during the last 2 weeks of each period. To check that hearing thresholds remained stable over the duration of the trial, audiometry was performed periodically. The threshold at a given frequency was considered stable if it was within 10 dB of the threshold measured at the start of the trial. No participant showed instability, except for P10 (right ear), who had a temporary conductive hearing loss at 0.125, 0.25, and 0.5 kHz due to an external ear canal infection. The infection started just before switching from FT to Control, after the tests had been carried out. A period of 10 days was allowed for the infection to clear before fitting for Control, at which time thresholds had returned to those measured at the start of the study.
Hearing-Aid Signal Processing and Fitting
The hearing aids were Phonak Exélia Art P behind the ear hearing aids, either in their original form or in modified versions described later. These hearing aids employ 20-channel, fast-acting, wide dynamic range compression with an attack time of 1 ms and a recovery time of 50 ms. They incorporate optional noise reduction processing, microphone directionality, and feedback cancellation. The original form of the hearing aids can provide broadband amplification or FC. The latter is achieved by an algorithm based on the Fast Fourier Transform called Sound Recover (Simpson et al., 2005). For Control, Sound Recover was switched off.
Frequency Compression
For FC, the frequency compression ratio (CR) could be between 1.3 and 4. A pilot study was carried out in order to select the source and destination bands, and indirectly, the values of SF and CR. The selection of the destination band was based on a balance between making the SF as high as possible to preserve sound quality, while avoiding destination bands that fell well above 1.7fe. Before starting the main experiment, four settings of the FC were evaluated in a pilot experiment to select the appropriate balance. The lower edges of the source and destination bands, the SF, were set to 0.75fe or fe. The upper edge of the destination band was set to 1.7fe. The choice of the upper edge of the source band was based on the ERBN-number scale, which has units Cams (Glasberg & Moore, 1990; Moore, 2012). This is a transformation of the frequency scale based on estimates of the equivalent rectangular bandwidth of the auditory filter for normal-hearing listeners. The equation relating ERBN number to frequency is as follows:

Frequency Transposition
Some of the hearing aids were modified by the manufacturer to allow FT. The FT was based on the signal processing described by Robinson et al. (2009). The source band extended from 2fe to 2.7fe, and the destination band extended from fe to 1.7fe. As for FC, the source and destination bands were chosen based on the higher value of fe across the two ears for each participant. An amplification factor (in dB) was applied to the transposed sounds prior to them being added to the sounds that were already present in the destination band so that they were audible and of a comfortable loudness. An appropriate choice of the amplification factor can help the user to discriminate confusable consonants such as /ʃ/, /s/, and /f/ (Robinson et al., 2007). A test based on the “Difference test” devised by Robinson et al. (2007) was used to select the value of the amplification factor for each participant before starting the period using FT. This test used a paired-comparison task with VCV stimuli consisting of the vowel /a/ and one of four fricative consonants /s, f, ʃ, θ/, for example, the pair asha-asa, presented at 65 dB(A). The participants rated the difference between the sounds on a scale from 0 to 10, where 0 meant ‘identical’ and 10 meant ‘very different’. The value of the amplification factor was varied across trials. Participants could ask for repeats and they were instructed to report any uncomfortably loud sounds. The order of the stimuli within each pair and the amplification factor used on each trial were selected randomly. Initially, amplification factors from 0 to 6 dB were used with a step size of 1.5 dB. However, because ratings varied minimally across amplification factors, the step size was increased to 3 dB after two of the participants had completed the task. Lists of stimuli were made consisting of 72 pairs for P6 and P10 (12 Permutations × 6 Amplification Factors) and 36 pairs for the remaining participants (12 Permutations × 3 Amplification Factors). Participants rated one or two lists, depending on the available time. P14 did not complete this task because of limited availability.
Figure 3 shows the mean ratings for each participant and each amplification factor. Overall, ratings were similar across the range of amplification factors. No participant reported any amplification factor as being uncomfortably loud. Because of the similarity of the ratings across amplification factors, the participants were asked to report the sound quality of the hearing aids in informal conversation with the examiner so that they had the opportunity to report any issues with the quality of their own voice and that of the examiner’s voice. The amplification factors were chosen to give the highest sound quality for each participant.
Mean ratings for the ‘Difference test.’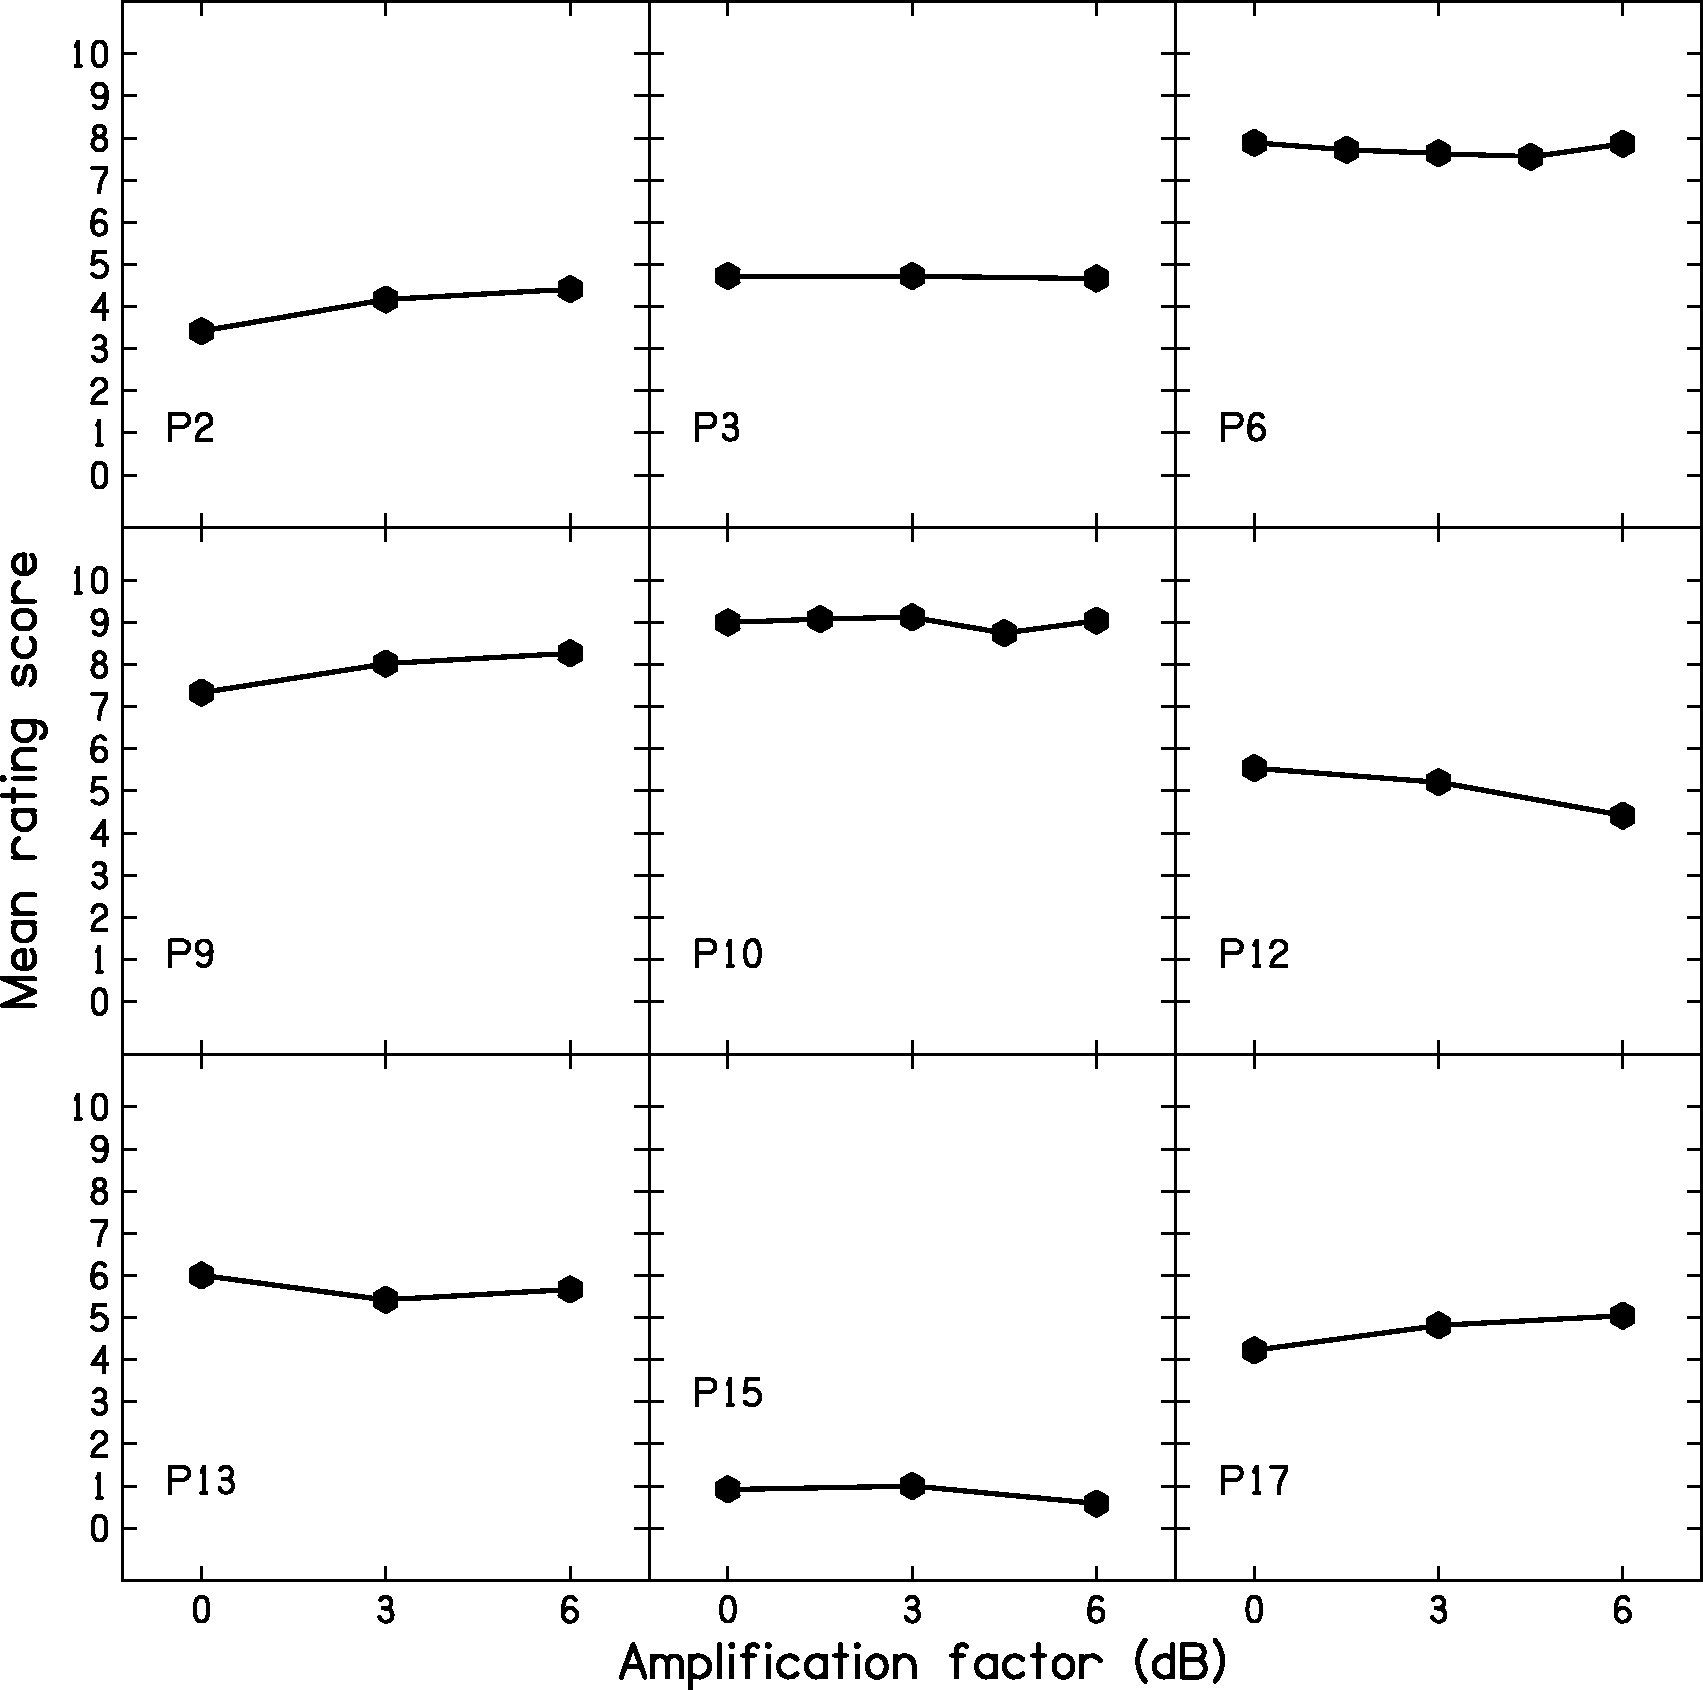
Conditional Behavior and Low-Pass Filtering
Unconditional lowering can reduce sound quality when the destination band includes frequencies below 1.5 kHz (Salorio-Corbetto et al., 2017b; Souza, Arehart, Kates, Croghan, & Gehani, 2013). To preserve sound quality and still be able to use destination bands placed below 1.5 kHz, the FT and FC were applied in a conditional manner (Posen et al., 1993; Robinson et al., 2009; Wolfe et al., 2017). Frequency lowering occurred only when the ratio of high-frequency to low-frequency energy was above a predetermined value. The frequency-lowering processing was implemented by spectral analysis of brief samples of the input, called frames. Conditional frequency lowering involved two main parameters: (a) The dividing point divided the frequency bins for a given frame into a low and a high range. The energy for all bins above the dividing point was summed and compared with the energy for all bins below the dividing point and (b) a threshold value for the ratio of high-frequency to low-frequency energy. The value of the dividing point was set to 2 kHz. The threshold ratio was set to 2, as used by Robinson et al. (2007) and Robinson et al. (2009). As a result, frequency lowering occurred mainly when consonants with substantial high-frequency energy were present. Spectrograms of processed VCVs recorded from a KEMAR dummy head (Burkhard & Sachs, 1975) were inspected to ensure that frequency lowering occurred for most stops and fricatives.
An additional parameter was a level threshold below which frequency lowering was disabled, which was intended to prevent frequency lowering of low-level high-frequency noise. This threshold was set to 40 dB SPL. Whether or not frequency lowering occurred, the signal was low-pass filtered at 1.7fe, as people with extensive DRs usually do not get benefit from amplification above this limit (Baer et al., 2002; Malicka et al., 2013; Vickers et al., 2001).
Hearing-Aid Fitting
All participants, except P13, who had no aidable hearing in his right ear, were fitted bilaterally. P17, whose right ear had a profound hearing loss, probably due to a combination of cochlear and middle-ear damage, was fitted bilaterally but all tests were carried out using his left hearing aid only, with an earplug in the right ear. Usually, custom earmolds with vents of appropriate diameter were used, and the feedback canceller was activated if required. In some cases, the participant’s own earmolds were used, for convenience. P10, P12, P13, and P15 wore their own earmolds. Participants were given a choice of colors for the cases of the hearing aids. Once they had made a choice, it was maintained for all conditions. Hearing aids were fitted using iPFG v2.5 a and SDWD2 software, developed by Phonak, via a Noah Link unit connected to a computer.
Frequency- and level-dependent gains were initially adjusted to match the real-ear aided gain (REAG) targets calculated using the CAM2A procedure (Moore & Füllgrabe, 2010; Moore, Glasberg, & Stone, 2010). The REAG was measured with an interacoustics affinity real-ear measurement device following the guidelines of the British Society of Audiology (2007). Maximum output levels were measured using an interacoustics affinity test box fitted with a 2-cc coupler, using a 90-dB SPL swept-tone input signal. They were set so that they did not exceed the participant’s uncomfortable loudness level. Comfort with the hearing aids in the presence of intense sounds was informally checked by presenting speech-shaped noise at 80 dB SPL and sudden noises (clapping and door bang) and asking participants to report any loudness discomfort. REAG targets for three input levels (50, 65, and 80 dB SPL) could usually be matched for frequencies up to 1.7fe at least for 65 - and 80-dB inputs (and sometimes higher for Control, although the targets for these frequencies were often not met). Recall that for conditions FC and FT, low-pass filtering was applied above 1.7fe.
For frequencies between 0.5 kHz and approximately 1.7fe, the root-mean-square deviation (RMSD) between the target and achieved gains, averaged across participants, was 5, 4, and 4 dB for the input levels of 50, 65, and 80 dB SPL, respectively. At the individual level, RMSDs were 5 dB or less, except for five participants (P2, P3, left ear of P10, P12, and P13) for the 50-dB SPL input level, for two participants (left ear of P10 and P12) for the 65-dB SPL input level, and for three participants (P10, P12, and P13) for the 80-dB SPL input level. In some cases (P12, P13, and P14), the larger RMSDs were a consequence of the reduction of gain as a result of fine tuning performed during the fitting session or in the first two weeks after fitting the initial condition.
Because it was not possible to implement FT and FC in the same hearing aid, three different prototypes were used for each of the participants’ aided ears. Care was taken to ensure that the frequency responses for the FC and FT conditions did not differ markedly from that for Control, apart from what would be expected from the frequency lowering. For FT, the across-participant average RMSDs from the control condition were 3, 2, and 2 dB for the input levels of 50, 65, and 80 dB SPL, respectively. Individual RMSDs were never higher than 5 dB. For FC, the average RMSDs from the control condition were 2, 3, and 3 dB for the input levels of 50, 65, and 80 dB SPL, respectively. RMSDs were 5 dB or less for all participants except for P9, for whom the RMSDs were 6 dB for each input level. For P9, the RMSD was affected by the low-pass filtering, which occurred at a slightly lower frequency for FC than for FT (because of the discrete possible values allowed in the fitting software). When the frequency affected by this (2000 Hz) was excluded, RMSDs for P9 were 2, 3, and 2 dB for the input levels of 50, 65, and 80 dB SPL, respectively.
FT and FC Settings for Each Participant.

Note. FT = frequency transposition; FC = frequency compression; LPF = low-pass filter; N/A = not applicable; AF = amplification factor; SF = starting frequency; CR = compression ratio. All frequencies are specified in kHz. The values of fe for the right (feR) and left (feL) ears are shown. If feR and feL differed, the higher value of fe was used to fit both hearing aids. The value of fe used to fit the hearing aid is referred to as feF. The low-pass filter (LPF) cutoff frequency was equal to 1.7 times feF. For FT, the frequency ranges of the source band (S) and the destination band (D) and the value of the amplification factor (AF, in dB) are shown. For FC, the values of the SF, the CR, and the upper edge of the source band (upper edge) are shown.
Each hearing aid included two programs: (a) Basic program for quiet situations, which used an omnidirectional microphone and feedback canceller, if required. (b) Program for noisy situations, which used a fixed directional microphone and a noise-reduction algorithm set to ‘mild’ strength. For P6, the strength of noise reduction was increased to ‘moderate’ after the first week, as this participant said that background noise was bothersome with the study hearing aids, compared with his own hearing aids, in daily situations. The hearing aids had a volume control that allowed the output to be increased by up to 6 dB or decreased by up to 10 dB. The preferred volume control position for each participant was noted and used for the tests conducted in the laboratory. The volume control was used to increase the output relative to the default value by 2 dB for P9 and P15, and 4 dB for P2 and P17. For all other participants, the volume control was at the default value. Participants were offered a remote control to allow them to change program and manage the volume of the hearing aids and five accepted the offer.
Outcome Measures
Estimates of audibility
The audibility estimates were obtained after the study had been concluded, as at the time the study and prototypes were designed, there were no suitable methods for estimating audibility for frequency-lowering devices when the destination band was placed below around 1 kHz. The estimates were obtained using the speech map function of an Audioscan Verifit system. The stimuli were /s/ and /ʃ/ sounds whose level matched the level they would have when the RMS level of speech was 65 dB SPL (Scollie et al., 2016). The output of each participant’s hearing aids was estimated using a 2-cc coupler and an average real-ear-to-coupler difference. Ears with tympanic perforations (such as P10, left ear and P12, right ear) were excluded from these measurements, as their real-ear-to-coupler difference was unlikely to be close to average.
The Verifit system gives estimates of output levels in 1/3-octave bands, which are comparable in width to the auditory filters of an ear with mild hearing loss (Moore, 2007). However, for an ear with a DR, all stimulus components in a destination band extending from fe to 1.7fe or 0.75fe to 1.7fe would be detected via an auditory filter tuned just below fe (Moore, 2001, 2004). Therefore, it is likely that energy would be integrated over almost the whole range of the destination band but with a nonuniform weighting across frequency. To model this process, we used the loudness model described by Moore and Glasberg (2004). The model requires a specification of the audiometric thresholds of an ear, the edge frequency (or frequencies) or any DR in that ear, and the spectrum of the input stimulus. We used the 1/3-octave band levels estimated by the Verifit system over the frequency range covered by the destination band as input to the model; levels for other 1/3-octave bands were set to a very low value. The default parameters of the model were used for specifying the proportion of hearing loss at each audiometric frequency that is attributed to outer hair cell dysfunction. Diffuse-field listening conditions were assumed. The model gave an estimate of the loudness (in sones) and loudness level (in phons), evoked by the stimulus components in the destination band. Following Moore and Glasberg (2004), it was assumed that the detection threshold corresponds to a loudness of 0.003 sones, corresponding to a loudness level of 2 phons.
Consonant identification: The VCV test
The VCV test (Robinson et al., 2007) was used to assess consonant identification. This includes VCV combinations made from 21 English consonants (/p, t, k, b, d, g, f, h, s, ʃ, ɵ, v, z, dʒ, tʃ, l, r, w, y, m, n/) in three vowel contexts (/a, i, u/), uttered by the same female speaker. The participant sat in a sound-attenuating booth facing a Tannoy Precision 8D self-powered loudspeaker connected to a Samsung P510 laptop via an external sound card (Audiophile USB). A computer screen was placed in front of the participant, who was required to verbally indicate the consonant that was heard in each trial. All participants had diction that was sufficiently clear to avoid any ambiguity. The examiner registered the responses using a MATLAB-designed interface. The presentation level was 65 dB(A), as measured with a Lucas CEL-414 Precision Impulse sound level meter at the approximate position of the center of the head of the participant. The session started with a practice VCV list for which feedback was provided. Next, six test lists were presented and no feedback was provided.
Confusion matrices were used to compare the patterns of confusions across conditions. The identification score for each condition is an estimate of the probability of a correct response (PC). However, changes across different hearing-aid algorithms may not be evident when the PC is considered alone, as a portion of the differences across confusion-matrix cells will be due to random variation in the participants’ responses, and the extent of the random variation will be affected by the number of test items. A method for identifying differences with greater reliability than just selecting a threshold change in PC is needed. One such method is based on Bayesian analysis (Leijon, Henter, & Dahlquist, 2016). With this method, a prior probability of the response for each cell of the confusion matrix is assumed, based on a Dirichlet distribution (Leijon et al., 2016). This prior probability is updated to a posterior probability given the data. Bayesian analysis differs from frequentist methods such as analysis of variance (ANOVA) in the probabilities that are computed. Frequentist methods adopt the null hypothesis that the data for Conditions A and B came from the same population. The probability of obtaining the existing difference across conditions if the null hypothesis were true is calculated. If this probability (p) is small enough, the null hypothesis is rejected, and this is taken as indicating a significant difference across conditions. The Bayesian analysis, instead, gives the conditional probability (q) of the PC value for Condition A being better than that for Condition B, given the data, and the probability of the opposite event (i.e., that the PC value for Condition B is better than that for A, given the data), which is 1 − q (Leijon et al., 2016). In this article, we take q values ≥ 0.8 or ≤ 0.2 as indicating reliable differences across conditions.
The Bayesian analysis also identifies stimulus-response pairs that are reliably different across conditions. For each pair, the probability that a randomly drawn individual from the population obtains such a difference is determined. Then, the Bayesian credibility—that is, the probability that there is a true change between test conditions—is calculated. Bayesian credibility is calculated jointly for all of the identified pairs. Thus, it is not necessary to correct outcomes to allow for multiple comparisons. Again, we adopted a threshold of Bayesian credibility ≥ 0.8 as indicating reliable differences across conditions. The Bayesian analysis of the consonant-confusion matrices was carried out using methods and software tools developed by Leijon et al. (2016) to determine whether FC or FT improved or worsened performance compared with Control and each other, for each participant and for the group.
The Bayesian analysis was also used to calculate mutual information (Miller & Nicely, 1955), which is a measure of the consistency of the mapping between stimuli and responses, regardless of whether the responses are correct. It is possible for the mutual information to be 1 (the maximum value) even if PC = 0, if speech sounds are confused in a consistent way. The mutual information may be a useful indicator of the performance that could be achieved using a particular frequency-lowering algorithm following extended learning. The Bayesian analysis also gives the conditional probability of the mutual information value for Condition A being higher than that for Condition B, given the data.
Word-final /s, z/ detection: The S-test
The S-test developed and recorded by Robinson (2007) was used. This was preferred over the UWO plurals test (Glista & Scollie, 2012), as the speaker of the S-test has a British accent and the vocabulary of the S-test is suitable for adults. The experimental setup was the same as described for the VCV test. In each trial, two words differing only in the presence of word-final “s” (/s/ or /z/, e.g., book/books; pig/pigs) were presented on a screen, and only one word was played acoustically. Participants, who were all able to produce word-final /s/ or /z/, gave an oral response to indicate which word had been played, and this was recorded by the examiner using a MATLAB-controlled interface. The presentation level was 65 dB(A). Scores were converted to values of the sensitivity index, d ′ (McNicol, 2004; Moore, 2003), calculated from the proportion of hits (the proportion of times the participant responded “s” when “s” was present) and the proportion of false alarms (the proportion of times the participant responded “s” when “s” was absent). The log-linear rule (Hautus, 1995) was used to deal with cases where there were 100% hits or zero false alarms. With this rule, 1 is added to the number of trials and 0.5 is added to the number of hits and false alarms. For example, if the number of hits is 24/24 (100%), the revised values are 24.5/25.
Speech reception threshold for speech in eight-talker babble
Speech reception thresholds (SRTs; i.e., the signal-to-noise ratio at which 50% of the keywords are identified) were measured using IEEE sentences (Rothauser et al., 1969) uttered by a male native speaker of British English. The long-term spectrum of the sentences was shaped to match the long-term average spectrum of speech as estimated by Moore, Stone, Füllgrabe, Glasberg, and Puria (2008). This was done in MATLAB using a 45-tap finite-impulse-response filter. Recordings obtained by Moore et al. (2008) were used to create a segment of multitalker babble made up of eight talkers, four females and four males, all native speakers of British English. The spectrum of the babble was shaped to match the long-term spectrum of the speech using MATLAB, as described earlier.
Participants sat in a sound-attenuating booth. The noise-reduction algorithm of the hearing aids was disabled during the test, as its performance is level dependent and the level of the noise varied during the test. Stimuli were presented from a Tannoy Precision 8D self-powered loudspeaker connected to a Samsung P510 laptop with an external M-Audio Audiophile USB soundcard, connected to a Tucker-Davis Technologies (TDT) PA4 programmable attenuator and a TDT SM3 mixer. The participant was seated about 1 m from the loudspeaker at an azimuth of 0°. Each sentence was presented with a randomly selected segment of the babble. The babble started 500 ms before the sentence and ended 500 ms after the sentence finished. The level of the target speech was fixed at 65 dB(A). The level of the babble was varied to achieve the desired signal-to-babble ratio (SBR). A list of 20 sentences (made of two IEEE lists) was presented for each run, and the SBR was varied adaptively using the same procedure as described by Hopkins, Moore, and Stone (2008). The number of keywords correctly identified for each SBR was recorded. The score for the first sentence was discarded because it was played to the participant more than once. The SRT was estimated from the number of presentations and the number correct at each SBR visited, using probit analysis (Finney, 1971).
Speech, Spatial and Qualities of hearing scale
The Speech, Spatial and Qualities of Hearing Scale (SSQ) developed by Gatehouse and Noble (2004) was used. The SSQ has three subscales: (a) speech hearing, consisting of 14 items whose aim is to assess performance for speech communication in different settings; (b) spatial hearing, consisting of 17 items assessing the ability to make judgments of sound distance and direction, and discrimination of movement; and (c) other qualities, consisting of 18 items related to segregation of sounds, clarity and naturalness, and listening effort. The SSQ has good test–retest reliability when it is administered to nonhearing-aid users in an interview format or by post over a 6-month interval (Singh & Pichora-Fuller, 2010), so it was deemed appropriate to use it several times for each participant to allow comparisons across conditions. All but one participant completed the questionnaire at home. Participants were given the chance to discuss any concerns. P17 preferred to respond to the questionnaire in the laboratory, using an interview format. Although an interview format is preferred to self-administration (Gatehouse & Noble, 2004; Singh & Pichora-Fuller, 2010), self-administration was chosen because several of the participants had limited time to visit the laboratory.
Participants were asked to complete the SSQ prior to the beginning of the trial to get them familiarized with the questions and to make them aware of the situations that they would be asked to report on with the experimental aids. The data from the first administration of the SSQ were not analyzed. The SSQ was administered on the first or second session of testing with each condition (toward the end of the period of experience).
Results
Estimated Audibility
Outcomes of the Estimated Audibility Measures Based on the Loudness Model.

Note. R = right; L = left; FT = frequency transposition; FC = frequency compression.
The loudness levels (in phons) are shown for /s/ and /ʃ/ for each participant. There are two estimates for Control, each to be compared with either FT or FC, as the destination band was slightly wider for FC than for FT. The outcomes are shown for the ear with the higher fe. When fe was equal across ears, outcomes are shown for the ear with audibility over the wider frequency range for the control condition. Filled diamonds indicate cases where the stimuli in the destination band were below the detection threshold (loudness level less than 2 phons).
Based on the loudness level in the destination band, most participants had greater audibility for /ʃ/ with FT (P2, P3, P6, P9, P10, P14, and P17) and with FC (P2, P3, P6, P9, P10, P12, P14, P15, and P17) than with Control. Among these, P6 and P10 had good audibility of /ʃ/ with Control (mainly of the lower frequency components of the stimulus), so increased audibility might not have offered a significant advantage for /ʃ/. Only a few participants had increased audibility for /s/ with FT (P2, P3, and P6) or FC (P6). This is likely due to the frequency range included in the source band, which in most cases fell below the range where /s/ has most of its energy. For P10 and P12, the loudness of components in the destination band for /s/ was higher for Control than for FT or FC. The origin of this effect is unclear. It presumably reflects small differences across conditions in the gain applied to low-level sounds falling in the destination band, perhaps because the destination band did not coincide precisely with any single channel or combination of compression channels in the hearing aid. P12, P13, and P15 did not obtain a clear audibility benefit for /s/ or /ʃ/ with FT, and P13 and P15 did not obtain a benefit with FC.
In summary, both FT and FC led to increased audibility of /ʃ/ for most participants, but the audibility of /s/ was mostly not improved, probably because the source band fell below the range where /s/ has most of its energy.
Consonant Identification
Identification scores were transformed into rationalized arcsine units (RAU) in order to satisfy the assumptions of ANOVA, and after transformation, the scores were corrected for guessing using the method suggested by Sherbecoe and Studebaker (2004). Figure 4 shows the consonant identification scores in RAU for the group and for each participant. The mean scores were 47.5, 47.9, and 47.0 RAU for Control, FT, and FC, respectively. A repeated-measures two-way ANOVA with factors condition and vowel context was performed. The Mauchly test of sphericity was positive for the factor vowel context. A Greenhouse-Geisser correction to the degrees of freedom was applied for this factor, but the uncorrected degrees of freedom are reported. There was no significant effect of condition, F(2, 18) = 0.221, p = .804. There was a significant effect of vowel context, F(2, 18) = 9.992, p = .006, ηp2 = 0.526. Post hoc tests with Bonferroni correction indicated that the scores for vowel context /a/ were significantly higher than those for vowel /i/ and /u/, regardless of processing condition. Finally, there was a significant interaction between condition and vowel context, F(4, 36) = 2.792, p = .041, ηp2 = 0.237. However, separate ANOVAs for each vowel context revealed no significant effect of condition, F(2, 18) = 0.956, p = .403; F(2, 18) = 1.465, p = .257; and F(2, 18) = 3.067, p = .071; for /a/, /i/, and /u/ respectively.
Consonant-identification scores for the group (average) and for each participant. Outcomes are shown for each vowel context (/i/, /a/, /u/) and across vowel contexts (‘all’). Error bars show ±1 standard deviation for the individual results and ±1 standard error of the mean for the group results.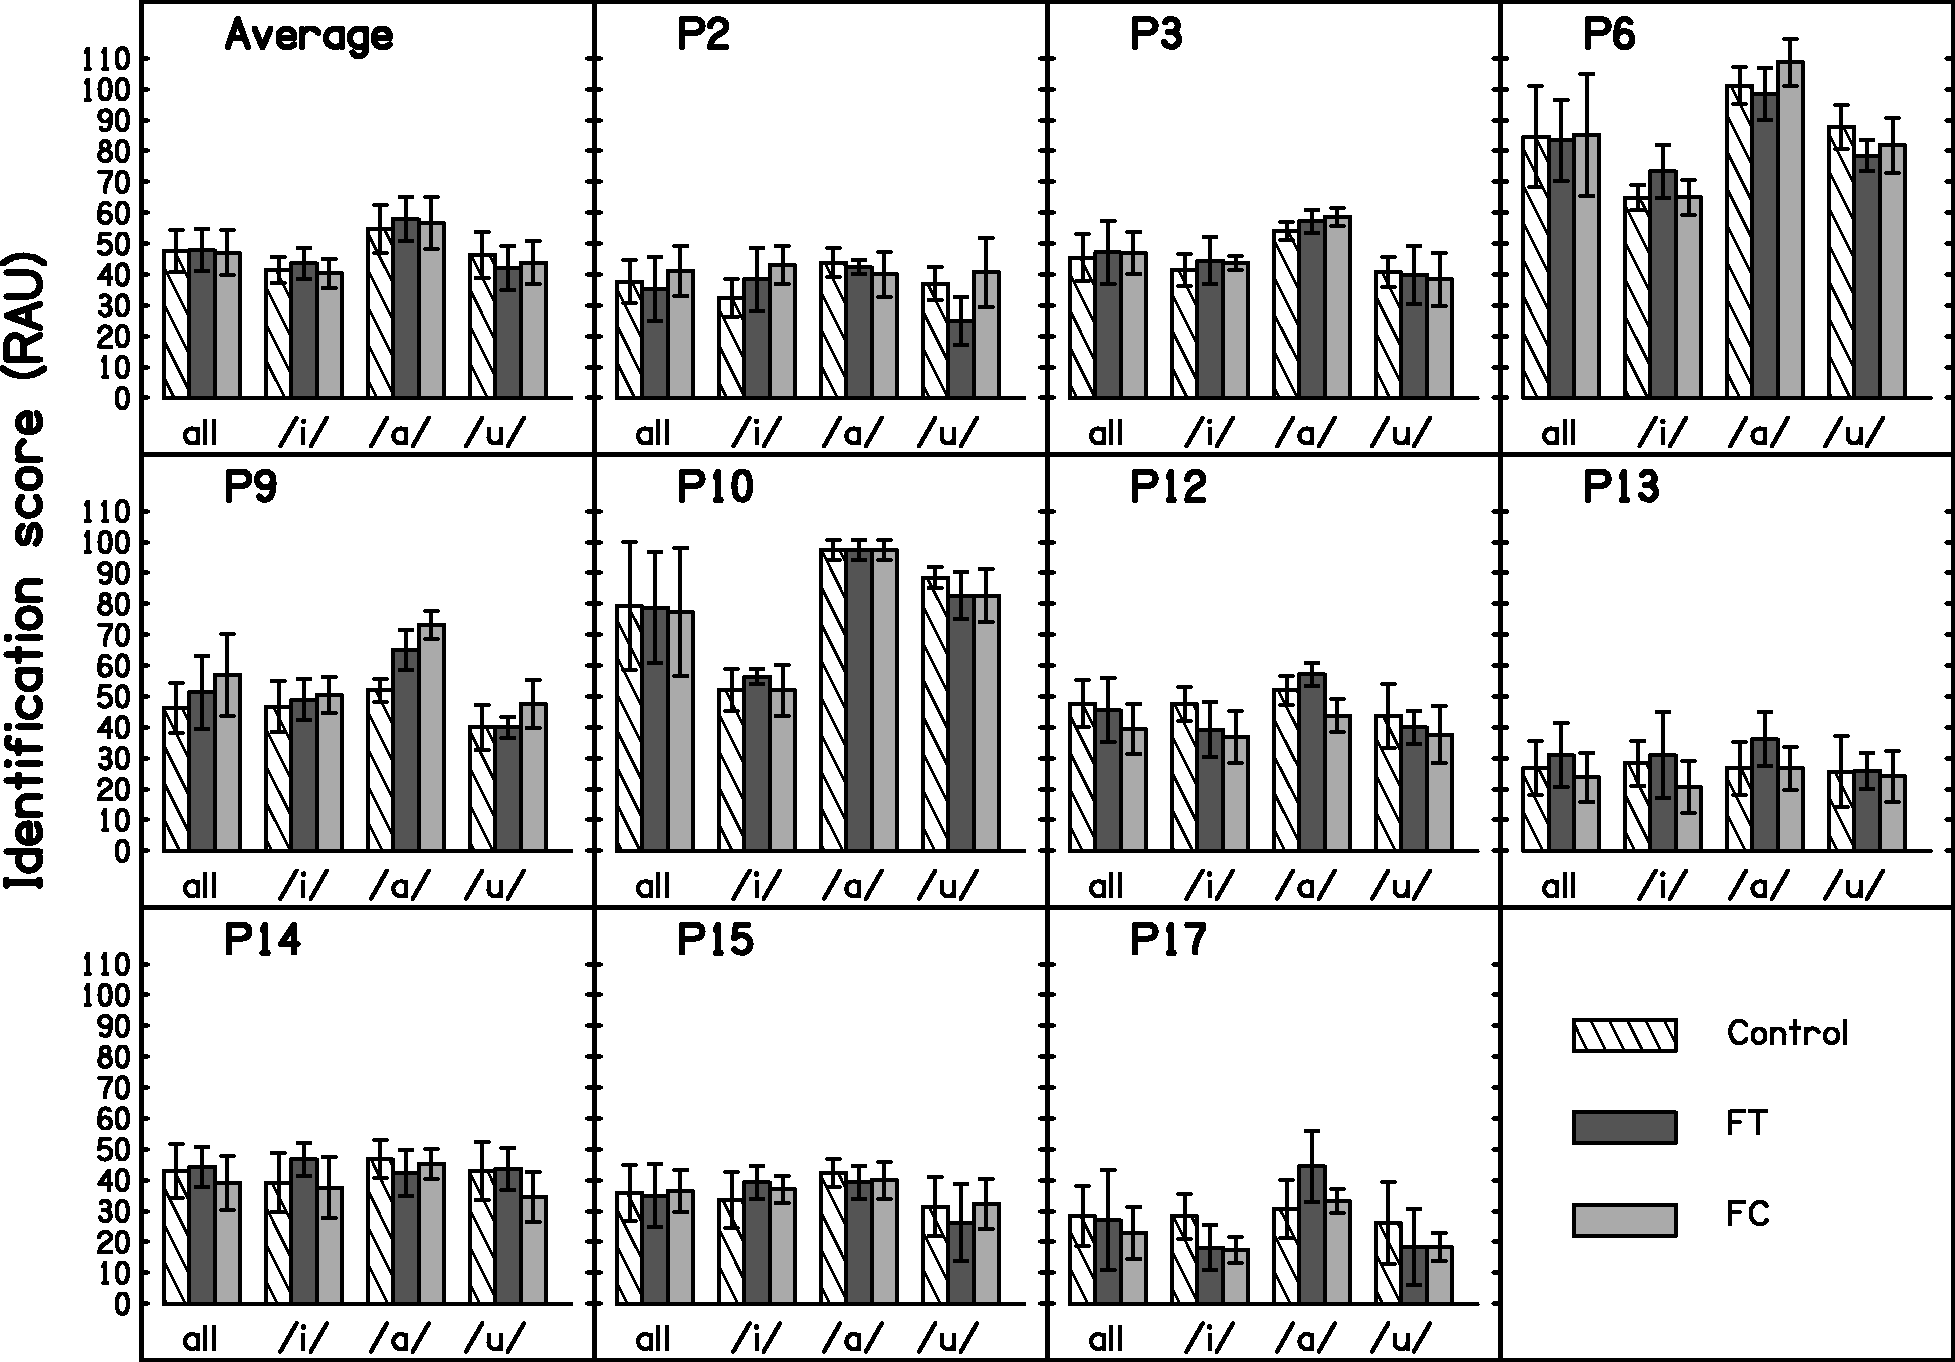
Analysis of Consonant Confusions
The outcomes of the Bayesian analyses indicated that for Control, most of the consonant confusions were in place of articulation rather than manner or voicing (e.g., the stop /p/ was confused with the stop /t/, but not with the fricative /s/). This is consistent with previous research on participants with DRs (Baer et al., 2002; Vickers et al., 2001). The frequency-lowering conditions were compared with the Control condition and with each other in order to identify differences in the correct identification of consonants or in the pattern of confusions. The outcomes indicated the following changes in the patterns of confusions: (a) There were fewer confusions between /h/ and /ʃ/ for FT compared with Control but the credibility just failed to reach the selected threshold of 0.8 (credibility = 0.77). (b) FC increased confusions of /h/ with /s/ (credibility = 0.87). (c) There were fewer confusions of /h/ with /f/ for FC compared with Control, but the credibility just failed to reach the selected threshold (credibility = 0.72). (d) FC increased the confusion of /ɵ/ with /t/ compared with FT (credibility = 0.88). (e) /g/ was identified correctly more often with FT than with FC, but the credibility just failed to reach the selected threshold (credibility = 0.78). (f) There were fewer confusions of /g/ with /d/ with FT compared with FC but, again, the credibility failed to reach the selected threshold (credibility = 0.72).
Summary of the q Values Derived From Bayesian Analysis of Confusion Matrices.

Note. FT = frequency transposition; FC = frequency compression; PC = probability of a correct response; MI = mutual information.
Three comparisons were made: FT versus Control, FC versus Control, and FT versus FC. The value of q indicates the probability of a correct response (PC) or mutual information (MI) being greater for one condition than for the comparison condition. Values of q ≥ 0.8 are marked with an asterisk. Values of q ≤ 0.2 are marked with a filled diamond.
Consider next the FC versus Control comparison. For the group data, the probability that PC was higher for FC than for Control was 0.37. For the individual participants, the probability of PC being higher for FC than for Control was at or above 0.8 for one participant but was below 0.2 for four participants. For the group data, the probability that the mutual information was greater for FC than for Control was 0.43, that is, close to chance. For the individual participants, the probability of the mutual information being greater for FC than for Control was above 0.8 for two participants, but was below 0.2 for three participants. Thus, FC did not produce consistent benefits either in terms of PC or in terms of mutual information.
Finally, consider the FT versus FC comparison. For the group data, the probability that PC was higher for FT than for FC was 0.67. For the individual participants, the probability of PC being higher for FT than for FC was above 0.8 for five participants, but was below to 0.2 for one participant and close to 0.2 for another one, at 0.25. For the group data, the probability that the mutual information was greater for FT than for FC was 0.76. For the individual participants, the probability of the mutual information being greater for FT than for FC was above 0.8 for seven participants, and was below 0.2 for one participant and close to 0.2 for another one, at 0.21. Thus, for the majority of participants, the mutual information was likely to be greater for FT than for FC, suggesting a greater potential for the former to produce improvements in performance after extended experience.
Word-Final /s, z/ Detection
Figure 5 shows the results of the S-test for the group and for each participant. A within-subjects one-way ANOVA with factor condition was performed on the d ′ values. There was no significant effect of condition, F(2, 18) = 0.537, p = .594.
S-test results for the group (top panel, ‘Average’) and for each participant. Error bars show ±1 standard deviation for the individual results and ±1 standard error of the mean for the group results.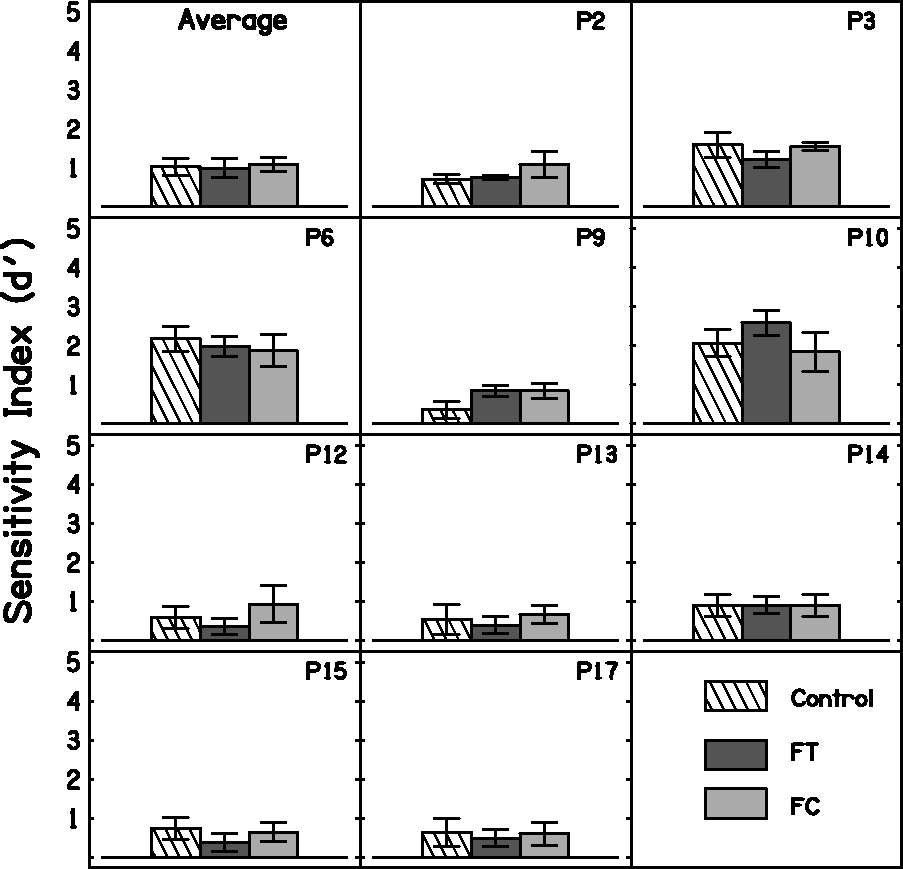
SRTs for Speech in Noise
SRTs were measured only for the three participants (P6, P9, and P10) who scored at least 60% identification of keywords when tested in quiet using two IEEE lists presented at 65 dB SPL. Figure 6 shows the SRTs in noise for the group and for each participant. A within-subjects one-way ANOVA with factor condition was performed on the SRTs. There was no significant effect of condition, F(2, 4) = 1.434, p = .339.
SRTs for speech in noise. Cross-hatched, dark gray, and light gray bars show the results for Control, FT, and FC, respectively. Lower SRTs indicate better performance. Error bars show ±1 standard deviation for the individual results and ±1 standard error of the mean for the group results.
Speech, Spatial, and Qualities of Hearing Scale
P12 did not complete the questionnaire for one of the conditions, so results are presented only for the other nine participants. Participants sometimes failed to answer a few questions. In those cases, the average score across the remaining questions for that subscale was used.
Figure 7 shows the outcomes of the SSQ for each condition. Overall, the differences across conditions were small. A within-subjects two-way ANOVA with factors condition and subscale was performed. There was no significant effect of condition, F(2, 16) = 0.076, p = .927. There was a significant effect of subscale, F(2, 16) = 6.960, p = .007. Post hoc analysis with Bonferroni correction indicated that ratings were significantly lower for the ‘Speech’ subscale than for the ‘Quality’ subscale, regardless of condition. All other comparisons were not significant. The interaction between condition and subscale was not significant, F(4, 32) = 0.086, p = .986.
SSQ outcomes for the group (‘Average,’ top-left) and for each participant. Cross-hatched, dark gray, and light gray bars show results for Control, FT, and FC, respectively. Error bars show ±1 standard deviation for the individual results and ±1 standard error of the mean for the group results.
Informal Reports on Sound Quality
Some participants informally reported on sound quality at the end of the trial. P6 commented that he disliked the sound quality of FC. P6 has an interest in music and reported that he did not like the sound of his own whistling with FC as the aids ‘went out of tune’ and produced a ‘warbling sound’ when he produced a high note. He also reported that he thought he needed to request more repeats from conversation partners with this condition compared with the other two. P10 also reported that the FC condition was slightly worse than the other two conditions ‘for understanding speech.’ In contrast, P2 reported that he preferred the FC condition in terms of sound quality and clarity. P17 preferred the sound quality of Control, as it sounded ‘sharper.’ Overall, these reports were not reflected in the speech test scores or the SSQ scores, although the reports are broadly consistent with the results of the Bayesian analysis shown in Table 4.
Discussion
Audibility
It was expected that FT or FC would increase access to mid-frequency and high-frequency speech information by shifting the frequency components to a range where they would be audible. While FT and FC improved audibility for /ʃ/ for seven and nine participants, respectively, the audibility of /s/ was improved in only a few cases; three for FT and one for FC. This reflects the fact that for most participants, the frequency range covered by the source band fell below the region where /s/ has most of its energy. In addition, FT and FC failed to improve the audibility of either /s/ or /ʃ/ for three and two participants, respectively. This was probably mainly due to the severity of the participants’ hearing losses and their extensive DRs. The choices of the source band and destination band were not guided by audibility estimates in the present study. Estimation of audibility is crucial in clinical work and it is a recommended practice in hearing-aid verification (e.g., Scollie et al., 2016). The outcomes for our participants might have been better if audibility estimates had been used to select the frequency ranges of the source and destination bands. However, estimating audibility is not straightforward. The method developed here, based on a model of loudness, is recommended for future use, as it takes into account most of the factors that affect audibility, including the presence and extent of any DR.
Consonant Identification
Overall, there was no effect of condition (Control, FT, and FC) on the scores for the consonant-identification task. However, the pattern of confusions differed across conditions. This is consistent with previous research using frequency lowering (Alexander, 2016; Ellis & Munro, 2015; Glista et al., 2009; Kokx-Ryan et al., 2015; Posen et al., 1993; Robinson et al., 2007, 2009; Salorio-Corbetto et al., 2017a; Simpson et al., 2006). Bayesian statistical methods and tools developed by Leijon et al. (2016) were used to determine whether either FT or FC led to a change in the correct identification of any specific consonants. No robust changes across conditions were found. However, there were consistent changes in the patterns of errors across conditions.
The mutual information between stimuli and responses was calculated to assess whether FT or FC led to more consistent patterns of errors. Higher mutual information may indicate the potential for better performance following extended experience or training. It has been shown that training can improve the identification of speech processed using FC, although generalization did not occur across stimulus type (e.g., sentences and consonants) and passive exposure to FC led to similar effects (Dickinson, Baker, Siciliano, & Munro, 2014). Our analysis indicated that there was a trend for mutual information to be higher for FT than for Control (q = 0.77) but not for FC than for control (q = 0.43). There was also a trend for mutual information to be higher for FT than for FC (q = 0.76). This was consistent with most of the individual outcomes, with FT leading to higher mutual information than Control for 5 out of 10 participants, and FT leading to higher mutual information than FC for 7 out of 10 participants. However, for one participant, mutual information tended to be higher for FC than for FT. Mutual information was higher for FC than for Control only for two participants. Consistency in the error patterns could increase as a consequence of greater audibility (probably the case for the FT vs. Control comparison) or greater discriminability (probably the case for the FT vs. FC and Control vs. FC comparisons). It is possible that FC made the consonants sound more similar (i.e., less discriminable) than FT because of the nature of FC, for which a wide source band is transformed into a narrow destination band.
We consider next some factors that might underlie the lack of benefit with FT or FC for consonant identification:
The source band could have been too low in frequency to provide useful information about high-frequency consonants, especially /s/. However, information about other consonants should have been provided. Experiments conducted by Vickers, Robinson, Füllgrabe, Baer, and Moore (2009) and Füllgrabe et al. (2010) using normal-hearing participants with simulated DRs suggest that there could be a ‘best’ band that provides the most speech information (when added to the untransposed band) and that the position of this ‘best’ band is relatively independent of fe. Vickers et al. (2009) showed that a source band with a center frequency 1.5 kHz could potentially provide useful information to participants with a range of values of fe. For most of the participants tested here, the source band included frequency components around 1.5 kHz, so while it probably did not provide useful information about sounds like /s/, it probably did make available at least some information that was potentially usable. The amplification factors used for FT could have been nonoptimal. The amplification factor was partly chosen to be high enough to avoid masking of the transposed sounds by the sounds that were originally present in the destination band. However, the FT used here employed conditional transposition, that is, transposition occurred mainly for sounds whose short-term spectra were dominated by high-frequency components. Therefore, even though the transposed sounds were added to the sounds in the destination band, masking of the transposed sounds was unlikely. The choice of amplification factor also influences the amplitude of frication noise relative to that of the adjacent vowels. This ratio is used as a cue for place of articulation for fricatives and helps hearing-impaired listeners to discriminate consonants such as /s, ʃ/ from one another (M. Hedrick, 1997a; M. Hedrick, 1997b). Here, the amplification factors ranged from 0 to 6 dB. They were chosen based on the results of a rating task, but ratings did not differ significantly across values of the amplification factor. A better selection process for the amplification factor could improve speech recognition and sound quality. Robinson et al. (2009) suggested that the negative outcomes of their hearing-aid field trial compared with their laboratory experiment (Robinson, 2007) were partly due to the differences between the values of the amplification factor used in the two studies. While in their laboratory study the most commonly used amplification factor was 14 dB, the highest amplification factor in their field trial was 7 dB. However, amplification factors higher than 6 dB can cause everyday sounds like keys jingling or cutlery clinking to be unpleasantly loud. A high amplification factor can also degrade sound quality. While the participants in the present study usually did not complain about the quality of speech when they were performing the test used to choose the amplification factor, some of them did complain when they listened to normal conversation or even to their own voice. Also, according to participants’ reports, the acceptable amplification factor in terms of sound quality may be speaker dependent, possibly reflecting variability in the spectral characteristics of speech across talkers (Moore et al., 2008). The presence of background noise could alter the ratio of high- to low-frequency energy, causing the frequency lowering not to be activated for some fricative consonants. If this were the case, inconsistent exposure to the frequency-lowered sounds could have prevented the participants from learning to use the cues provided by frequency lowering. The behavior of the fricative detector in background noise was tested by recording the output of a FC hearing aid from the ear of a KEMAR dummy head (Burkhard & Sachs, 1975). The hearing aid was fitted to provide linear amplification for a flat 30-dB conductive hearing loss. Two sets of recordings were made, one with low-pass filtering and FC (with source and destination band settings for P9), and one with low-pass filtering but with FC switched off. KEMAR was placed in a sound-attenuating booth, in front of a Tannoy Precision 8D self-powered loudspeaker connected to a Samsung P510 laptop via an external Audiophile USB sound card, at a distance of 1 m. Recordings were made of the VCVs ‘asa’ and ‘asha’ in quiet and in two-talker and eight-talker babble using SBRs of −6 dB, 0, and 6 dB. Three different segments of each type of noise were used for each SBR and VCV. Recordings of the backgrounds alone were also made. A MATLAB function that simultaneously played and recorded the sound files was used, so that all the recorded files were temporally aligned. Each recorded waveform for the background alone was subtracted from the corresponding waveform of the VCV plus background. Spectrograms were obtained for the resulting signals. As expected, no frequency lowering occurred when FC was switched off. For the FC recordings, frequency lowering occurred only some of the time, depending on the frequency content of the target speech, the type of background, and on the SBR. For /s/, no frequency lowering of the target was visible in any of recordings, as the frequency content of /s/ was outside the source band. However, frequency lowering was triggered occasionally by the background. For /ʃ/ in the two-talker babble, frequency lowering occurred for two of the noise segments at SBR = −6 dB, and for all three segments for the SBRs of 0 and 6 dB. For /ʃ/ in the eight-talker babble, frequency lowering did not occur for the SBR of −6 dB, occurred only for two out of three noise segments for the SBR of 0 dB, and occurred for all three segments for the SBR of 6 dB. Sometimes frequency lowering was not sustained for the entire duration of the fricative. This might have happened because of rapid fluctuations in the ratio of high-frequency to low-frequency energy during the course of the fricative. Again, frequency lowering was triggered occasionally by the background when the target sound was /ʃ/. In summary, frequency lowering probably occurred inconsistently in noisy environments but probably occurred consistently when SBRs were positive and there were no intense low-frequency noises in the background. Sounds from background talkers might have been lowered occasionally, which could have been distracting for the participants. The ability of the participants to make use of the sound falling in the destination band may have been limited by their hearing loss and by the presence of DRs. Because speech information occurring at frequencies up to about 1.7fe is usable by listeners with extensive high-frequency DRs (Baer et al., 2002; Malicka et al., 2013; Vickers et al., 2001), the upper edge of the destination band was chosen to be 1.7fe. However, there was probably poor or no frequency selectivity over the frequency range of the destination band, since all frequency components falling in the range fe to 1.7fe would be detected via the same auditory filter, with a center frequency just below fe. This would make it difficult to determine the spectral shape of stimuli in the range fe to 1.7fe. Also, the representation of frequency components falling in the DR could be ‘noisy,’ since a region immediately adjacent to a DR may have a reduced number of inner hair cells or neurons (Huss & Moore, 2005a, 2005b).
Fricative Detection
Fricative detection was assessed here using the word-final /s, z/ detection test, the S-test. Scores for this test did not differ significantly across the three conditions. This contrasts with some previous studies demonstrating that frequency lowering can improve the detection of fricatives (Glista et al., 2009; Robinson et al., 2007; Salorio-Corbetto et al., 2017a; Wolfe et al., 2010, 2011). It is striking that Robinson et al. (2007) found a significant benefit of FT in a laboratory experiment with the S-test, using essentially the same algorithm as for the present study. However, no significant benefit was found in a hearing-aid trial using the same algorithm (Robinson et al., 2009). Robinson et al. (2009) proposed that the difference in the outcomes across studies could be due to the fact that, in the laboratory study, the amplification factor was much higher than in the hearing-aid trial. The amplification factors used here were lower than those used by Robinson et al. (2009), which may have contributed to the lack of benefit of frequency lowering for the S-test.
Another relevant factor is that many of our participants had very low values of fe. For them, the frequency range of the source band (1.4–1.89 kHz) may have been too low to provide information about the sounds /s/ and /z/. Robinson et al. (2007) showed that normal-hearing participants with simulated fe = 0.5 kHz performed better in the S-test with a source band starting around 3 to 4 kHz. In the present study, there were only three participants whose source bands included frequencies between 3 and 4 kHz (P6, P9, and P10). Estimated audibility measures suggested that all three participants obtained improved audibility of /s/ with FT but only one of them (P6) did with FC. This is likely to be due to the use of an amplification factor for FT but not for FC. The settings of frequency lowering were not chosen based on the audibility of the /s/, as it is recommended in clinical practice (Scollie et al., 2016). The S-test results could have been better for the participants with low values of fe if a higher source band for FT had been used. However, for FC, the CR would have needed to be increased significantly in order to convey useful information about /s/. This may not be desirable, as it could reduce consonant discrimination.
One way to achieve audibility of /s/ would be to apply an amplification factor in order to increase the level of the frequency lowered /s/, even when FC is used. The increase should be kept small in order to maintain comfort and naturalness and to avoid distorting the amplitude ratio between vowel and consonant, which may be used as a cue for the discrimination of /ʃ/ and /s/.
SRTs for Sentences in Babble
Unfortunately, SRTs for sentences in babble could be obtained only for three participants, because the task was too difficult for the others. For the three participants who could complete the test, SRTs did not significantly differ across the three conditions. One possible explanation for this is related to the conditional nature of the frequency-lowering algorithms. The fricative detector was less likely to be activated when the SBR was low, due to the dominance of low-frequency energy in the background babble. However, the SRTs for all three participants were well above 0 dB, that is, the SBRs in the region of the SRT were not low. It seems likely, therefore that that the lack of benefit of the frequency lowering was not due to failure of the fricative detector to operate appropriately. However, the frequency lowering could have been occasionally activated by the background talkers, leading to confusion or distraction.
The effect of frequency lowering on the ability to understand speech in background sounds has been evaluated in several studies, with mixed results. For FC, some studies reported benefits (Bohnert et al., 2010; Ellis & Munro, 2015; Shehorn, Marrone, & Muller, 2018; Wolfe et al., 2011), some reported no differences between FC and conventional amplification (Hopkins et al., 2014; John et al., 2014; Kokx-Ryan et al., 2015; Picou et al., 2015; Simpson et al., 2006; Wolfe et al., 2010, 2015), and some reported deleterious effects of FC (Hillock-Dunn et al., 2014; Perreau et al., 2013). Similarly, for FT, there have been reports of benefits (Auriemmo et al., 2009; Kuk et al., 2009), no differences (Gifford, Dorman, Spahr, et al., 2007; Robinson et al., 2007), and deleterious effects (Miller et al., 2016). These studies varied in design, participants, and frequency-lowering schemes and therefore it is difficult to compare their outcomes.
SSQ Results and Subjective Comments
Our participants did not complain about the frequency-lowering hearing aids producing distracting sounds in background noise, nor was this suggested by the outcomes of the SSQ. Furthermore, there was no effect of FT or FC on the SSQ outcomes, regardless of the scale evaluated. Other studies of frequency lowering showed that most participants preferred the control hearing aids or reported no difference in terms of sound quality (Miller et al., 2016; Picou et al., 2015; Robinson et al., 2009; Simpson et al., 2006). Studies performed using a broad range of frequency lowering conditions suggest that there may be a range of FC settings that are acceptable to hearing-impaired participants (Parsa, Scollie, Glista, & Seelisch, 2013) especially if these settings provide an increase in audibility (Brennan et al., 2014; Souza et al., 2013) that outweighs distortion (Johnson & Light, 2015; Souza et al., 2013).
Concluding Remarks
In conclusion, FT and FC improved the audibility of high-frequency sounds for 7 and 9 participants out of 10, respectively, with extensive high-frequency DRs and, in most cases, low values of fe. The participants who failed to obtain an audibility benefit had severe to profound loss and very extensive DRs. Future research and clinical work should use settings chosen to improve audibility. In addition, estimates of audibility could be improved by using a loudness model that takes into account the hearing loss and the extent of any DRs of the hearing-aid user. FT and FC failed to provide benefit relative to conventional amplification for consonant identification. Bayesian analyses of the confusion matrices revealed that both FT and FC affected the patterns of confusions. There were some consistent differences in the patterns of confusions, but no changes in the identification scores between conditions. FT led to more consistent error patterns than FC and Control. Hence, FT might have more potential for benefit following extensive training or experience.
Future research should address possible modifications of the parameters of the frequency lowering, especially for the conditional form of FC used here, which has been less explored than FT. The effects of training on the use of frequency-lowered information should also be further explored. Future studies should aim to optimize sensitivity to the effect of frequency lowering. Sensitivity could be improved by using a single-subject design, where some aspects of signal presentation could be selected on a case-by-case basis (such as presentation level and use of lip-reading). However, no design seems to control for all confounding factors. Thus, limitations in the way that benefit can be measured and quantified are likely to be present.
Finally, while FT/FC did not lead to improved speech perception, there might nevertheless be some advantages of frequency lowering. First, the high gains at high frequencies that are required to provide broadband amplification are often associated with acoustic feedback. The use of frequency lowering reduces the required gains at high frequencies, and in itself reduces the tendency for feedback, and this could allow the use of larger vents in the ear mold. This is likely to increase acceptance, because it reduces the occlusion effect. Second, reducing the output level of the hearing aid may be safer in terms of noise exposure. Ching, Johnson, Seeto, and Macrae (2013) showed that matching the targets for DSLm[i/o] prescriptions led to unsafe exposure when the hearing loss was greater than 70 dB HL, and NAL-NL2 prescriptions would become unsafe when the hearing loss was greater than 90 dB HL. Frequency-lowering hearing aids may decrease the risk of noise-induced hearing loss for hearing-aid users with severe to profound hearing loss.
Footnotes
Acknowledgments
We thank Peter Derleth, Juliane Raether, and Siddhartha Jha (Phonak AG) for their technical help and discussion. We are grateful to Prof. Arne Leijon, who shared with us the software that he developed to perform Bayesian analysis of confusion matrices and who provided many helpful comments and suggestions, and to Widex A/S, who granted us permission to use the software. We thank Brian Glasberg, Aleksander Sek, Michael Stone, and Mahmoud Keshavarzi for helpful discussion, and Karolina Kluk-de-Kort and Josephine Marriage for their comments on an earlier version of this manuscript. We also thank two reviewers for very helpful comments.
Declaration of Conflicting Interests
The authors declared no potential conflicts of interest with respect to the research, authorship, and/or publication of this article.
Funding
The authors disclosed receipt of the following financial support for the research, authorship, and/or publication of this article: M. S. C. was supported by an Action on Hearing Loss PhD studentship, Phonak AG, and the H. B. Allen Trust. B. C. J. M. and T. B. were supported by grants from the Medical Research Council (UK) grant and the Engineering and Physical Sciences Research Council, UK (RG78536). Hearing aids and technical support were provided by Phonak AG.