
Abstract
Aversiveness of loud sounds is a frequent complaint by hearing aid users, especially when fitted bilaterally. This study investigates whether loudness summation can be held responsible for this finding. Two aspects of loudness summation should be taken into account: spectral loudness summation for broadband signals and binaural loudness summation for signals that are presented binaurally. In this study, the effect of different symmetrical hearing losses was studied. Measurements were obtained with the widely used technique of Adaptive Categorical Loudness Scaling. For large bandwidths, spectral loudness summation for hearing-impaired listeners was found to be greater than that for normal-hearing listeners, both for monaurally and binaurally presented signals. For binaural loudness summation, the effect of hearing loss was not significant. In all cases, individual differences were substantial.
Keywords
Introduction
Nowadays, the majority of listeners with hearing loss (HL) are fitted bilaterally. The use of two hearing aids has increased over the last decades and reached values of about 75% in the United States (Kochkin, 2009) and about 70% in Europe (see www.ehima.com). Bilaterally fitted hearing aids have been shown to improve speech intelligibility both in quiet and in noise and to improve localization (Boymans, Goverts, Kramer, Festen, & Dreschler, 2008, 2009; Köbler & Rosenhall, 2002; Noble & Gatehouse, 2006). However, aversiveness of loud sounds remains a problem. In several studies on the benefit of hearing aids, aversiveness of sounds has been found to be negatively influenced by hearing aid fitting (Abrams, Chisolm, McManus, & McArdle, 2012; Cox, Schwartz, Noe, & Alexander, 2011; Löhler, Akcicek, Kappe, Schlattmann, & Schönweiler, 2016), an effect that in bilaterally fitted subjects might be stronger than in unilaterally fitted subjects (Boymans et al., 2009). Loudness complaints remain a major reason for revisiting the hearing aid dispenser (Jenstad, Van Tasell, & Ewert, 2003), and aversiveness of loud sounds is one of the main reasons to be dissatisfied with a hearing aid fitting (Hickson, Clutterbuck, & Khan, 2010). Discomfort of loud sound and its importance for hearing aid fitting have been extensively investigated (e.g., Formby, Payne, Yang, Wu, & Parton, 2017; Hawley, Sherlock, & Formby, 2017; Mueller & Bentler, 2005). The relationship between measured loudness discomfort levels and ratings for satisfaction, however, is weak (Zaugg, Thielman, Griest, & Henry, 2016), and the loudness judgments within the same loudness category varied across listeners within a group by as much as 50 to 60 dB (Formby et al., 2017).
It is generally accepted that hearing aid rehabilitation involves successive steps, starting with a first fit based on a prescriptive formula, followed by individual fine tuning based on subjective responses or technical measurements using in situ responses. Over the years, a number of prescriptive formulas have been developed. The linear prescriptive formulas (e.g., NAL-R, FIG6, POGO) have been replaced by nonlinear prescriptions, such as NAL-NL2 (Dillon, 2012) and DSL I/O (Bagatto et al., 2005; Cornelisse, Seewald, & Jamieson, 1995; Scollie et al., 2005), taking into account that the amount of gain required is not only frequency dependent but also level dependent.
Nonlinear fitting formulas show some relationship with the loudness growth at different frequencies. The level of detail of knowledge about loudness perception required for an effective first-fit setting is still in debate. But the dynamic range as the frequency-dependent range between the individual hearing thresholds and the levels of uncomfortable loudness is generally accepted and applied in different forms in nonlinear prescriptive formulas.
Due to the fact that the HL is often strongly frequency dependent, loudness growth is usually measured with narrowband signals. Loudness curves measured in individual hearing-impaired (HI) listeners can be compared with loudness curves of normal-hearing (NH) listeners and thus transferred into level-dependent gain prescriptions for hearing aid amplification settings to normalize loudness (Herzke & Hohmann, 2005).
However, in this approach, two aspects of loudness perception are not taken into account: spectral loudness summation (in case of the presentation of broadband signals instead of narrowband signals) and binaural loudness summation (in case of bilateral presentation instead of unilateral). This includes also the binaural loudness perception of broadband signals. This combined effect has to be considered because often two hearing aids are worn and they will typically process broadband signals as speech or environmental sounds.
These types of loudness summation may require individual corrections. Recent data of HI listeners (Oetting, Hohmann, Appell, Kollmeier, & Ewert, 2016) showed large individual differences in spectral loudness summation and binaural loudness summation after careful narrowband loudness normalization. Some of the listeners showed loudness perception for binaural broadband signals that was fully in agreement with NH reference data, whereas others showed a higher-than-normal loudness summation of up to 30 dB SPL for the binaurally presented broadband signals. Given the magnitude of the interindividual differences found, it can be assumed that these findings are relevant for loudness adjustments during bilateral hearing aid fittings.
In this study, we measured spectral and binaural loudness summation, separately as well as the combination for binaurally presented sounds using categorical loudness scaling (Brand & Hohmann, 2002). In a study by Oetting et al. (2016), mild to moderate HLs were tested corresponding to audiometric configurations of N1–N3 and S1 (Bisgaard, Vlaming, & Dahlquist, 2010). It is not clear whether the effect of individual variation decreases, remains constant, or increases with increasing HL. Therefore, in this study, a broader range of HLs (audiometric configurations: N2–N4 and S2–S3; Bisgaard et al., 2010) were included. The focus was on a larger variety of HLs and a potential effect of the Bisgaard et al.’s (2010) classification on the individual variation. The main questions of this study are (a) whether the shape of the audiogram can explain individual differences and (b) if several characteristics of the HL and HL compensation strategy are possible predictors for the amount of spectral and binaural loudness summation.
Methods
Subjects
The inclusion criteria were age above 18 years and native Dutch speakers with mild to moderate symmetrical HLs (differences between both ears at 0.5, 1, 2, and 4 kHz < 10 dB) selected from clinical files. Their pure-tone audiograms were classified according to the 10 standard audiograms N1 to N7 and S1 to S3, as suggested by Bisgaard et al. (2010). Bisgaard et al. (2010) defined typical audiograms that cover the entire range of audiograms met in clinical practice. Their classification consists of seven audiograms for flat and moderately sloping HL (N1–N7) and three audiograms for steep HL (S1–S3), with higher numbers corresponding to greater HL. The individual audiogram was taken as the average audiogram of the right and left ears. The classification was based on the lowest root-mean-square error of the individual audiogram and the standard audiograms. Thirteen women and sixteen men participated with an average age of 69 years and a standard deviation of 4 years. Twenty-two listeners had a flat or moderately sloping audiogram classified N2 (9), N3 (10), and N4 (3). Seven listeners had steep sloping audiograms classified as S2 (4) and S3 (3). For reasons of comparison, reference data from nine NH listeners measured by Oetting et al. (2016) were used. Because of the small numbers in the S2 and S3 groups, these seven listeners were taken together in one group with steep sloping losses: group S. The distributions of the HLs for each standard audiogram are given in Figure 1, whiskers mark minimum and maximum values.
The distribution of the audiograms for each standard according to Bisgaard et al. (2010). Whiskers mark minimum and maximum values.
Equipment
All measurements were conducted in a sound-insulated booth in two sessions of about 2 hours each. Pure-tone audiograms (air and bone conduction) were measured with DECOS audiometers, using TDH39 headphones. Sennheiser HDA 200 headphones were used for the loudness categorical loudness scaling procedure using the framework for psychoacoustic experiments (Ewert, 2013). Signals were presented using a RME Fireface UC at 44.1 kHz. Headphones were calibrated with a Brüel & Kjær artificial ear type 4153, a 0.5-in. microphone type 4134, a microphone preamplifier type 2669, and a measuring amplifier type 2610. Headphones were free-field equalized according to ISO 389-8 (2004), and levels are expressed as the equivalent free-field level in dB SPL.
Procedure
Loudness scaling
Categorical loudness scaling was performed to measure the individual loudness perception. During the loudness scaling procedure, listeners had to rate the perceived loudness on an 11-point scale from not heard to too loud, which were transformed into numerical values in categorical units (CUs) from 0 to 50. Stimuli were presented in a pseudorandom order with levels between −10 and 105 dB HL. A monotonically increasing loudness function was fitted to the responses for each of the Adaptive Categorical Loudness Scaling measurements using the BTUX fitting method (Oetting, Brand, & Ewert, 2014). The model function consists of two linear parts with independent slopes mlow and mhigh with a smooth transition range (see Brand & Hohmann, 2002).
Stimuli
Two types of signals were used:
In Part I, loudness functions in different frequency regions were assessed with narrowband stimuli. For this purpose, one-third octave low-noise noises (Kohlrausch et al., 1997) were used. These narrowband stimuli had center frequencies of 250, 500, 1000, 2000, 4000, and 6000 Hz.
In Part II, loudness summation effects were assessed. For these experiments, stimuli that consisted of uniformly exciting noise (UEN; Fastl & Zwicker, 2007) with bandwidths of 1, 5, and 17 Barks were used, referred to as UEN1 (bandwidth: 210 Hz), UEN5 (1080 Hz), and UEN17 (5100 Hz), respectively. The UEN noises were centered on the Barkscale at 10.5 Bark (1370 Hz) and were designed so that each Bark band had equal signal energy.
In addition to the UEN, a speech-shaped noise, referred to as IFnoise (International Female noise; Holube, 2011), was included in the test battery. The IFnoise was generated to match the spectral shape of the long-term average speech spectrum for females (Byrne et al., 1994).
All stimuli were 1-s noises with 50-ms rise and fall ramps and identical to the stimuli used by Oetting et al. (2016).
Part I: Narrowband loudness functions
In Part I of the measurements, the narrowband low-noise noises signals were presented monaurally to the right and left ears with randomized order of the test frequencies. HI listeners with an even number started the monaural conditions with the right ear, whereas HI listeners with an uneven number started the monaural conditions with the left ear.
Narrowband loudness normalization
Before loudness summation was determined for the broadband signals (see Part II) the UEN1, UEN5, UEN17, and IFnoise, the noises were corrected for each HI listener individually aiming to present signal levels that produce the same loudness levels within each narrowband as for the average NH listener (narrowband loudness normalization). For this purpose, the broadband signals were filtered in six nonoverlapping frequency bands having the same center frequencies as the narrowband signals. The required gain for each frequency band was defined as the difference in level for each loudness category between the individual loudness functions of the narrowband signals and the average NH loudness function. An example is given in Figure 2(a). The narrowband normalization method and the NH reference data (dashed in Figure 2(a)) were identical as applied in Oetting et al. (2016).
(a) Gain to restore the narrowband loudness perception at 4000 Hz. Gains are defined as the horizontal difference between the individual loudness function (solid line) and the NH reference (dashed line). (b) Level-dependent gain for narrowband loudness compensation from the example in (a). The gains result in a compression ratio of 1.9 for a gain difference around 19 dB (Equation (1)). CU = categorical unit; HI = hearing-impaired; NH = normal hearing; HL = hearing loss.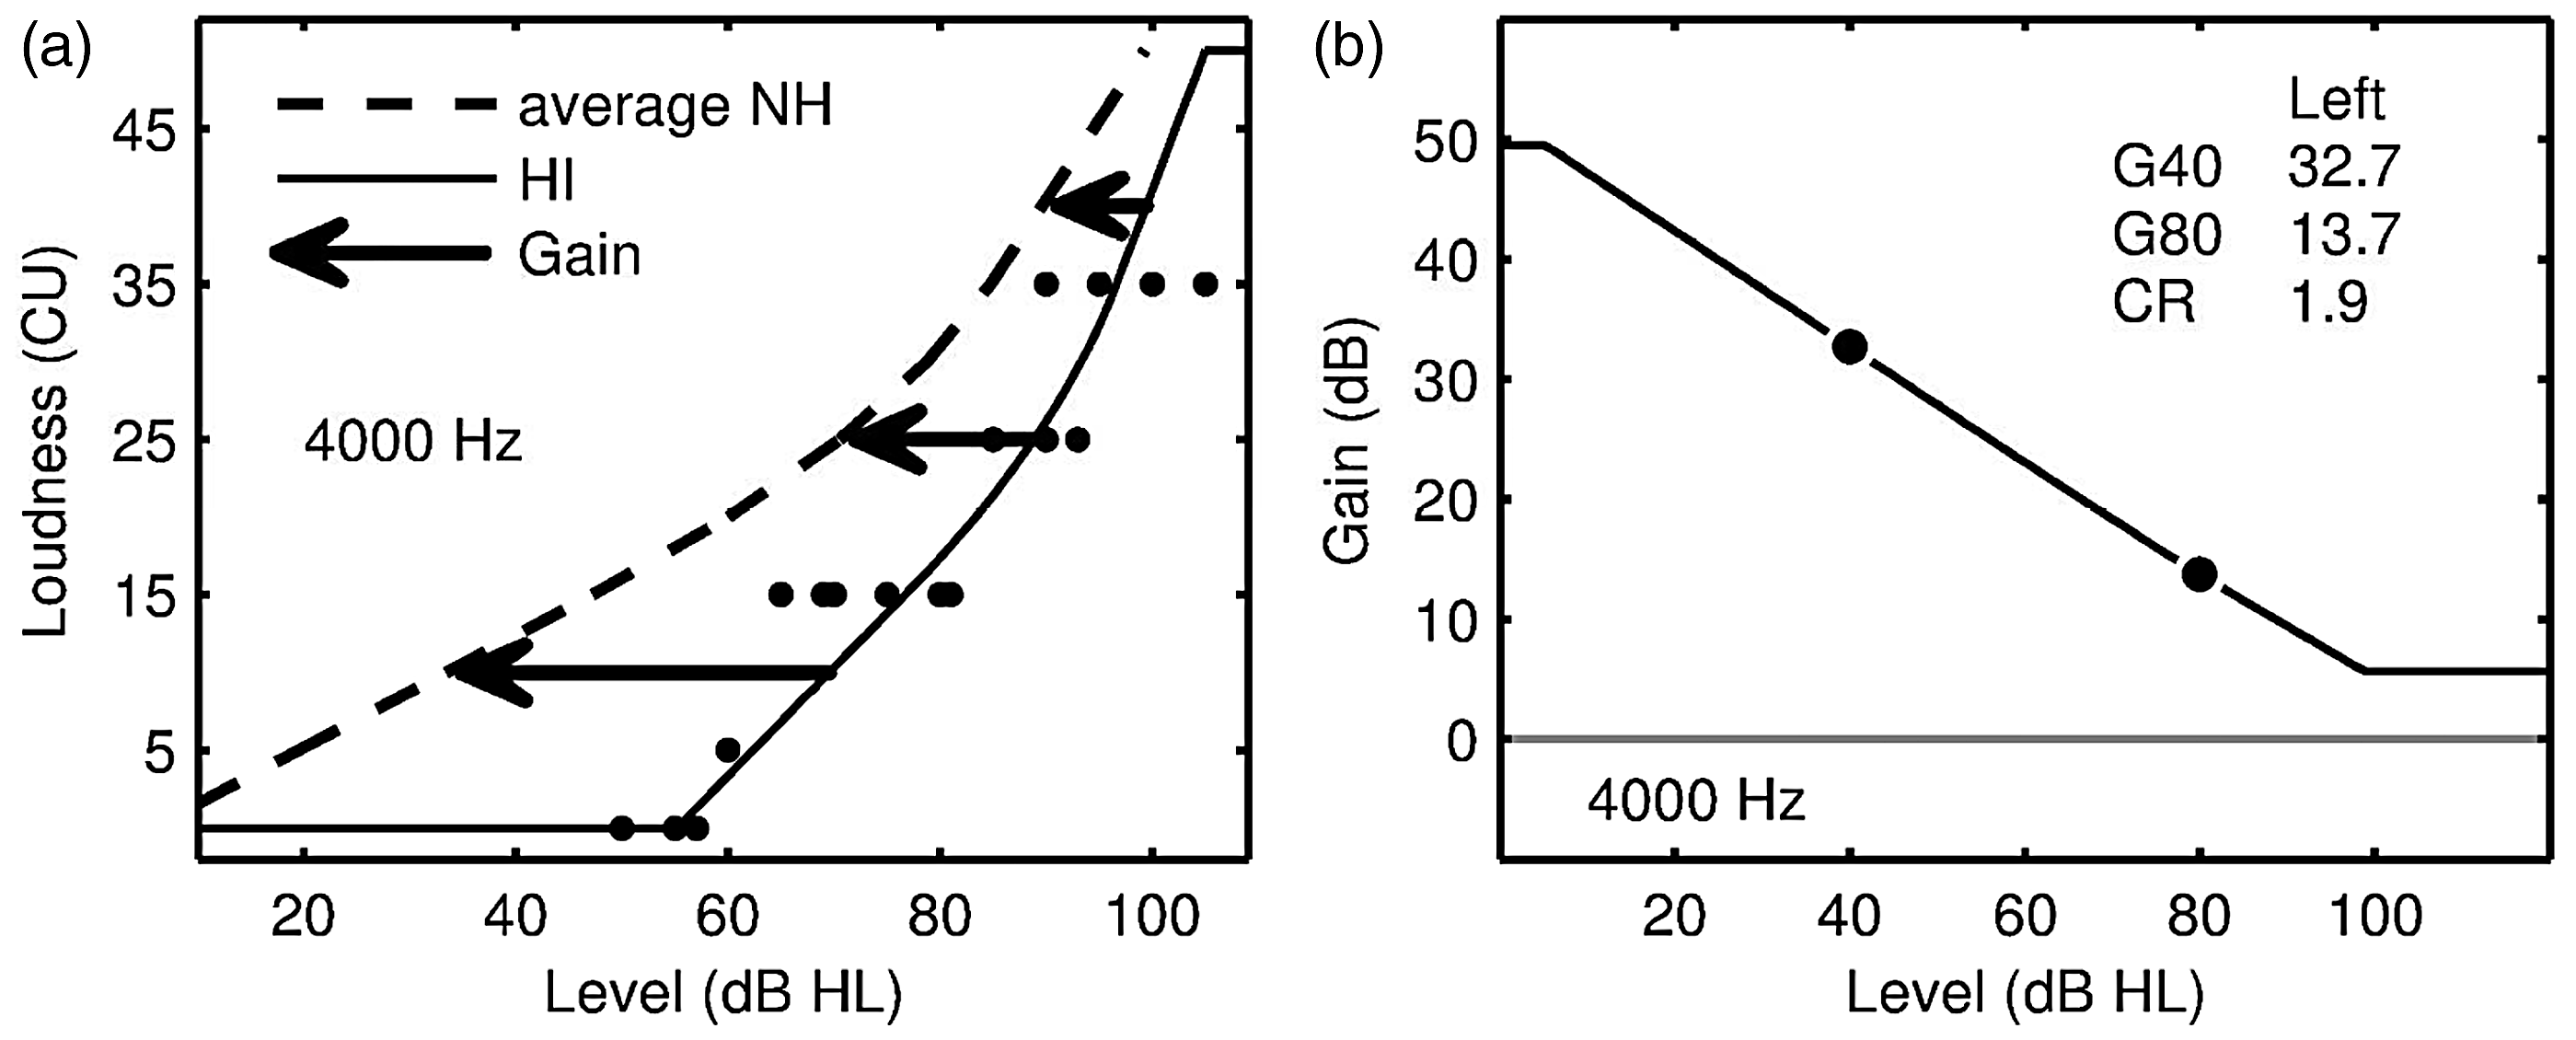
Gain limitations for the narrowband compensation were based on the maximum applicable level covered by the ethics approval. The loudness function for narrowband gain compensation was artificially limited to 105 dB HL at 50 CU. This leads to a gain reduction for listeners with loudness functions exceeding 105 dB HL for 50 CU, and narrowband loudness compensation will not be achieved. If the level of an amplified signal would have exceeded 105 dB HL, it was attenuated after narrowband loudness compensation to 105 dB HL by a broadband attenuation factor. The required amplification to restore normal loudness was calculated for the left and right ears separately. Theoretically, this may have caused a slight deviation from the principle to present the stimuli after loudness compensation in the binaural conditions diotically.
To quantify the remaining dynamic range of the impaired ears, for each narrowband signal, the compression ratio (CR) was calculated which is defined as the ratio between input and output level at 40 and 80 dB HL input level according to the following equation:

An example is given in Figure 2(b) with a CR of 1.9 indicating high gain values for low input levels and gains below 10 dB for high input levels.
Part II: Spectral and binaural loudness summation
In Part II, the loudness-compensated UENs and the IFnoise were presented to the HI listeners, first monaurally and thereafter binaurally. As in the first part of the measurements, HI listeners with an even number started the monaural conditions with the right ear and HI listeners with an uneven number started the monaural conditions with the left ear. To assess spectral loudness summation, levels for equal loudness of the narrowband UEN1 were compared with the more broadband signals UEN5, UEN17, and IFnoise.
Binaural loudness summation was assessed in two ways. First, spectral loudness summation for the binaural conditions was calculated parallel to the monaural conditions, that is, levels for equal loudness of the narrowband UEN1 were compared with the signals with an increasing bandwidth: UEN5, UEN17, and IFnoise. Second, binaural loudness summation was calculated as the level difference at equal loudness between the monaural loudness function (average of the right and left ears) and the binaural loudness function for all signals: UEN1, UEN5, UEN17, and IFnoise.
Results
Part I: Monaural Loudness
The narrowband loudness normalization fitting method typically showed decreasing gains with increasing presentation level (Figure 2(b)). By exception, gain increased slightly for frequencies without HL. Figure 3 shows the CRs for the narrowband signals at 500 Hz and 6000 Hz as a function of the hearing threshold for the left ear. The symbols indicate the audiometric classification of the ear. The CRs associated with the narrowband signals show increasing values with increasing hearing threshold, especially for HLs above 60 dB HL. The CRs are closely related to hearing threshold (500 Hz: r = .788, p ≤ .001; 6000 Hz: r = .752, p ≤ .001).
(a) Compression ratios at 500 Hz for the left ear. (b) Compression ratios at 6000 Hz for the left ear. HL = hearing loss.
Figure 4 shows the monaural results of the signals with increasing bandwidth, for the right ear (upper row) and the left ear (lower row). The levels on the x-axis represent the unaided input signal levels before amplification. Every solid line is a result of a single HI listener. The dotted line represents the mean level of the HI listeners measured in this study, and the striped line is the mean of nine NH listeners (measured by Oetting et al., 2016). The mean loudness curves for the HI listeners are close to the mean loudness curves for the NH listeners, but at high input levels of UEN1, loudness for HI listeners was found to be slightly smaller than for NH listeners, that is, loudness appears to be undercompensated for UEN1.
Loudness functions for UEN1, UEN5, UEN17, and IFnoise including individual and average monaural data. Upper row shows the results for the right ear, and lower row shows the results for the left ear. CU = categorical unit; HI = hearing-impaired; UEN = uniformly exciting noise; IFnoise = International Female noise.
The average loudness functions for HI listeners with UEN5 are almost the same as for the NH listeners. At UEN17 and IFnoise, the average loudness curve for the HI listeners is shifted slightly to lower input levels, relative to the loudness function for the NH listeners, suggesting a slight overcompensation. In this case, the shift is mainly caused by listeners with N3 and N4 audiograms.
Part IIa: Spectral Loudness Summation
Spectral loudness summation is defined as the level difference between the signals (UEN5, UEN17, and IFnoise) and the narrowband signal (UEN1). To asses spectral loudness summation in more detail, the level differences for equal (categorical) loudness (LDEL) with respect to UEN1 (center frequency 1370 Hz) were calculated for UEN5, UEN17, and IFnoise, as shown in Figure 5. LDELs calculated with respect to UEN1 will be referred to as spectral LDELs (SLDELs).
Spectral loudness summation for the NH listeners and HI listeners, expressed as the level difference for equal loudness (SLDEL) with the narrowband UEN1 as the reference signal. The lines show median values across listeners. To assess interindividual variability, the boxplots show the results at 5, 25, and 45 CU. Whiskers indicate the observed range for the listeners, and the boxplots were horizontally shifted to increase readability. CU = categorical unit; HI = hearing-impaired; NH = normal hearing; UEN = uniformly exciting noise; IFnoise = International Female noise; LDEL = level difference for equal loudness.
Positive values indicate that a higher UEN1 level is required to match the loudness level of the test signal. The median SLDEL values for NH listeners for each loudness category are shown as lines in the upper panel of Figure 5 (replicated from Oetting et al., 2016). Three boxplots per signal were included to show the interquartile range of the individual results for the loudness categories very soft (5 CU), medium (25 CU), and very loud (45 CU). Whiskers mark the entire range, that is, minimum and maximum values of the SLDELs. The differences in SLDELs for the NH and HI listeners are not strongly dependent on the categorical loudness levels. The average difference is about 8 dB for UEN17 and IFnoise. HI listeners show a larger spectral loudness summation effect than NH listeners. Detailed analysis reveals that this is due to the combined effect of a less than normal loudness perception for UEN1 and a higher than normal loudness perception for UEN17 and IFnoise.
Figure 6 shows SLDELs at CU 25 for the different audiogram configurations according to Bisgaard. At the left-hand side, the SLDELs for NH listeners are shown. The SLDELs for N2 do not deviate much from those for NH listeners. The SLDELs for N4 listeners are clearly higher than for NH listeners even with the UEN5 signal. For the N3 and S audiograms, the SLDELs for UEN17 and IFnoise are somewhat higher than for NH listeners. Although the listeners were selected for symmetrical HLs, SLDELs for both ears may show some variation.
Average SLDELs at 25 CU with respect to UEN1 for the different audiogram configurations for the UEN5, UEN17, and IFnoise. CU = categorical unit; UEN = uniformly exciting noise; IFnoise = International Female noise; HI = hearing-impaired.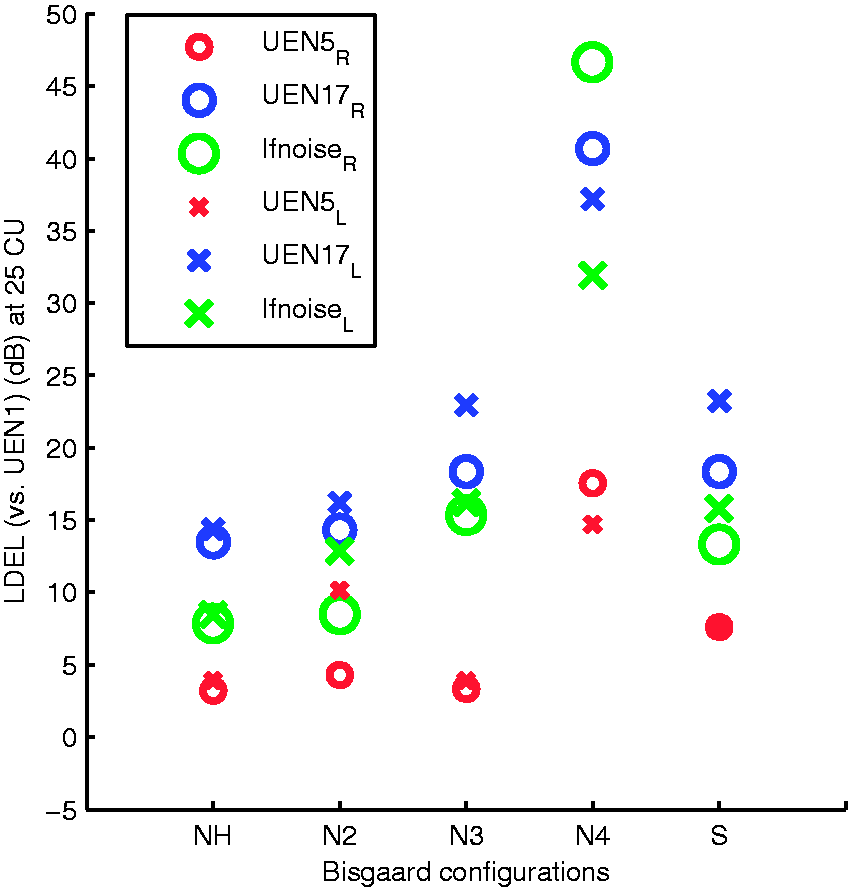
A Four-Way Mixed-Design ANOVA on the LDEL Values With one Between-Subjects Factor (Audiogram Classification: NH, N2, N3, N4, and S) and three Within-Subjects Repeated Measures (Three Signals: UEN5, UEN17, and IFnoise; Three Loudness Categories: 5, 25, and 45 CU; Two Ears: Left and Right).
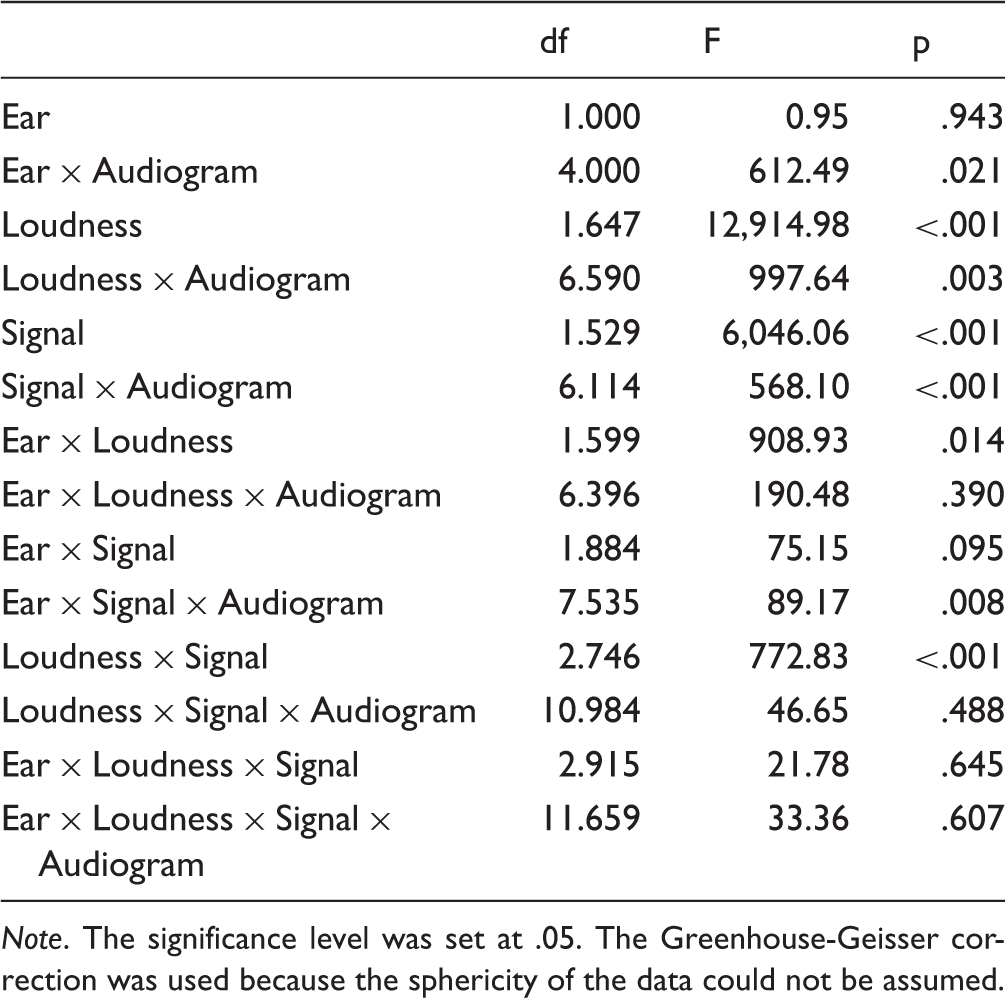
Note. The significance level was set at .05. The Greenhouse-Geisser correction was used because the sphericity of the data could not be assumed.
As should be the case in symmetrical HLs, there was no significant effect of the test ear. A significant effect was shown for loudness category—F(1.6, 54.4) = 46.6, p ≤ .001—and signal—F(1.5, 73.2) = 82.5, p ≤ .001. Bonferroni-corrected comparisons of loudness category and signal showed significant differences between all loudness categories and bandwidths. With regard to audiometric configuration, N3, N4, and S differed significantly from NH with p values of .044, <.001, and .014, respectively. HL category N2 was not significantly different from NH.
Part IIb: Binaural Loudness Summation
Figure 7 shows the individual and average results for all binaural conditions in the same way as the monaural data were shown in Figure 4. Again the mean loudness functions for the HI listeners are close to the average NH loudness functions for the signals UEN1 and UEN5. That is, in the binaural condition, the loudness normalization procedure seems to restore loudness to normal for the narrowband signals. For the broadband signals UEN17 and IFnoise, however, the loudness functions are clearly shifted to the higher-than-normal loudness. This indicates that the binaural broadband signals—despite the loudness normalization based on monaural NB signals—are perceived by the HI listeners as louder than by the NH listeners. As in the monaural condition, SLDELs were calculated with respect to UEN1. The results of this calculation can be seen in Figure 8. As in the monaural conditions, the variability is much larger for the HI listeners than for the NH listeners.
Individual and average data of the binaural conditions for all different audiograms. CU = categorical unit; UEN = uniformly exciting noise; IFnoise = International Female noise; HI = hearing-impaired. Spectral loudness summation of binaural sounds for the NH (upper panel) and HI (lower panel) listeners, expressed as the LDEL with the narrowband UEN1 (center frequency 1370 Hz) as reference. Solid lines show median values across listeners. To assess interindividual variability, the boxplots show the individual results at 5, 25, and 45 CU. Whiskers indicate the observed range for the listeners, and the boxplots were horizontally shifted to increase readability. CU = categorical unit; UEN = uniformly exciting noise; IFnoise = International Female noise; NH = normal hearing; HI = hearing-impaired; LDEL = level difference for equal loudness.

A three-way mixed-design ANOVA was conducted on the SLDEL values with one between-subjects factor (audiogram classification) and two within-subjects repeated measures (three signals: UEN5, UEN17, and IFnoise; three loudness categories: 5, 25, and 45 CU). The significance level was set at .05. The three-way interaction was not significant—F(13.2, 108.6) = 0.74, p = .719. The two-way interactions between signal and loudness category—F(3.3, 108.6) = 30.08, p < .001; bandwidth and HL category—F(6.9, 56.9) = 8.4, p < .001; loudness and HL category—F(7.5, 61.9) = 3.5, p = .003 were significant. There was a significant effect of loudness category—F(1.9, 61.9) = 75.5—and bandwidth—F(1.7, 56.9) = 149.8—both with a p < .001.
Bonferroni-corrected comparisons of loudness category showed significant differences between the SLDELs at 5 CU and at 25 CU and 45 CU but not between the LDELs at 25 CU and 45 CU. For the different bandwidths, all differences were significant. With regard to HL, categories N3, N4, and S differed significantly from NH listeners with p values of .024, <.001, and .044, respectively. HL category N2 was not significantly different from NH listeners.
Figure 10 shows the mean SLDELs at 25 CU for the binaural conditions as a function of the audiogram classification. As in the monaural conditions, the results for N2 are close to normal for all signals. For N3, N4, and S, the mean SLDELs for the broadband signals are larger than for the NH listeners. Especially for N4, the SLDELs are higher than normal, as was also observed in the monaural conditions.
Figure 8 showed spectral loudness summation of binaural sounds. It is also possible to calculate the binaural loudness summation of broadband sounds, that is, the binaural summation with respect to the monaural signals. Figure 9 shows the mean binaural level differences at equal loudness (BLDELs) between the mean of the right and left ears and the binaural level for all stimuli. For UEN1 and UEN5, the binaural summation for the HI listeners is similar to the binaural summation of the NH listeners. For UEN17 and IFnoise (the broadband conditions), binaural summation is increased for the HI listeners, especially at higher CUs. This trend was observed for all HL configurations (not shown). Again, the variability in the results for the HI listeners is much larger than for the NH listeners. A three-way mixed-design ANOVA was conducted on the BLDEL values with one between-subjects factor (audiogram classification) and two within-subjects repeated measures (four signals: UEN1, UEN5, UEN17, and IFnoise; three loudness categories: 5, 25, and 45 CU). The significance level was set at .05. The three-way interaction was not significant—F(4.6, 152.2) = 1.59, p = .068. The two-way interaction between signal and loudness category—F(4.6, 152.2) = 4.829, p < .001 was significant. The other two-way interactions were not. There was a significant effect of loudness category—F(1.3, 43.9) = 13.20—and bandwidth—F(2.7, 88.7) = 16.07 both with p < .001. There was no main effect of audiogram classification. Post hoc analysis showed significant differences between CU25 and CU45 with respect to CU5 but not between each other. For the different signals, no differences were found between UEN1 and UEN5 and between UEN17 and IFnoise. All other differences were significant with p < .001.
Binaural loudness summation of broadband sounds for the NH (upper panel) and HI (lower panel) listeners, expressed as the LDEL with the mean results of the right and left ears as reference. Solid lines show median values across listeners. To assess interindividual variability, the boxplots show the interindividual results at 5, 25, and 45 CU. Whiskers indicate the observed range for the listeners, and the boxplots were horizontally shifted to increase readability. CU = categorical unit; UEN = uniformly exciting noise; IFnoise = International Female noise; NH = normal hearing; HI = hearing-impaired; LDEL = level difference for equal loudness. SLDEL (re UEN1) for the different audiometric classifications tested for binaural signals presented at 25 CU. CU = categorical unit; UEN = uniformly exciting noise; IFnoise = International Female noise; NH = normal hearing; LDEL = level difference for equal loudness.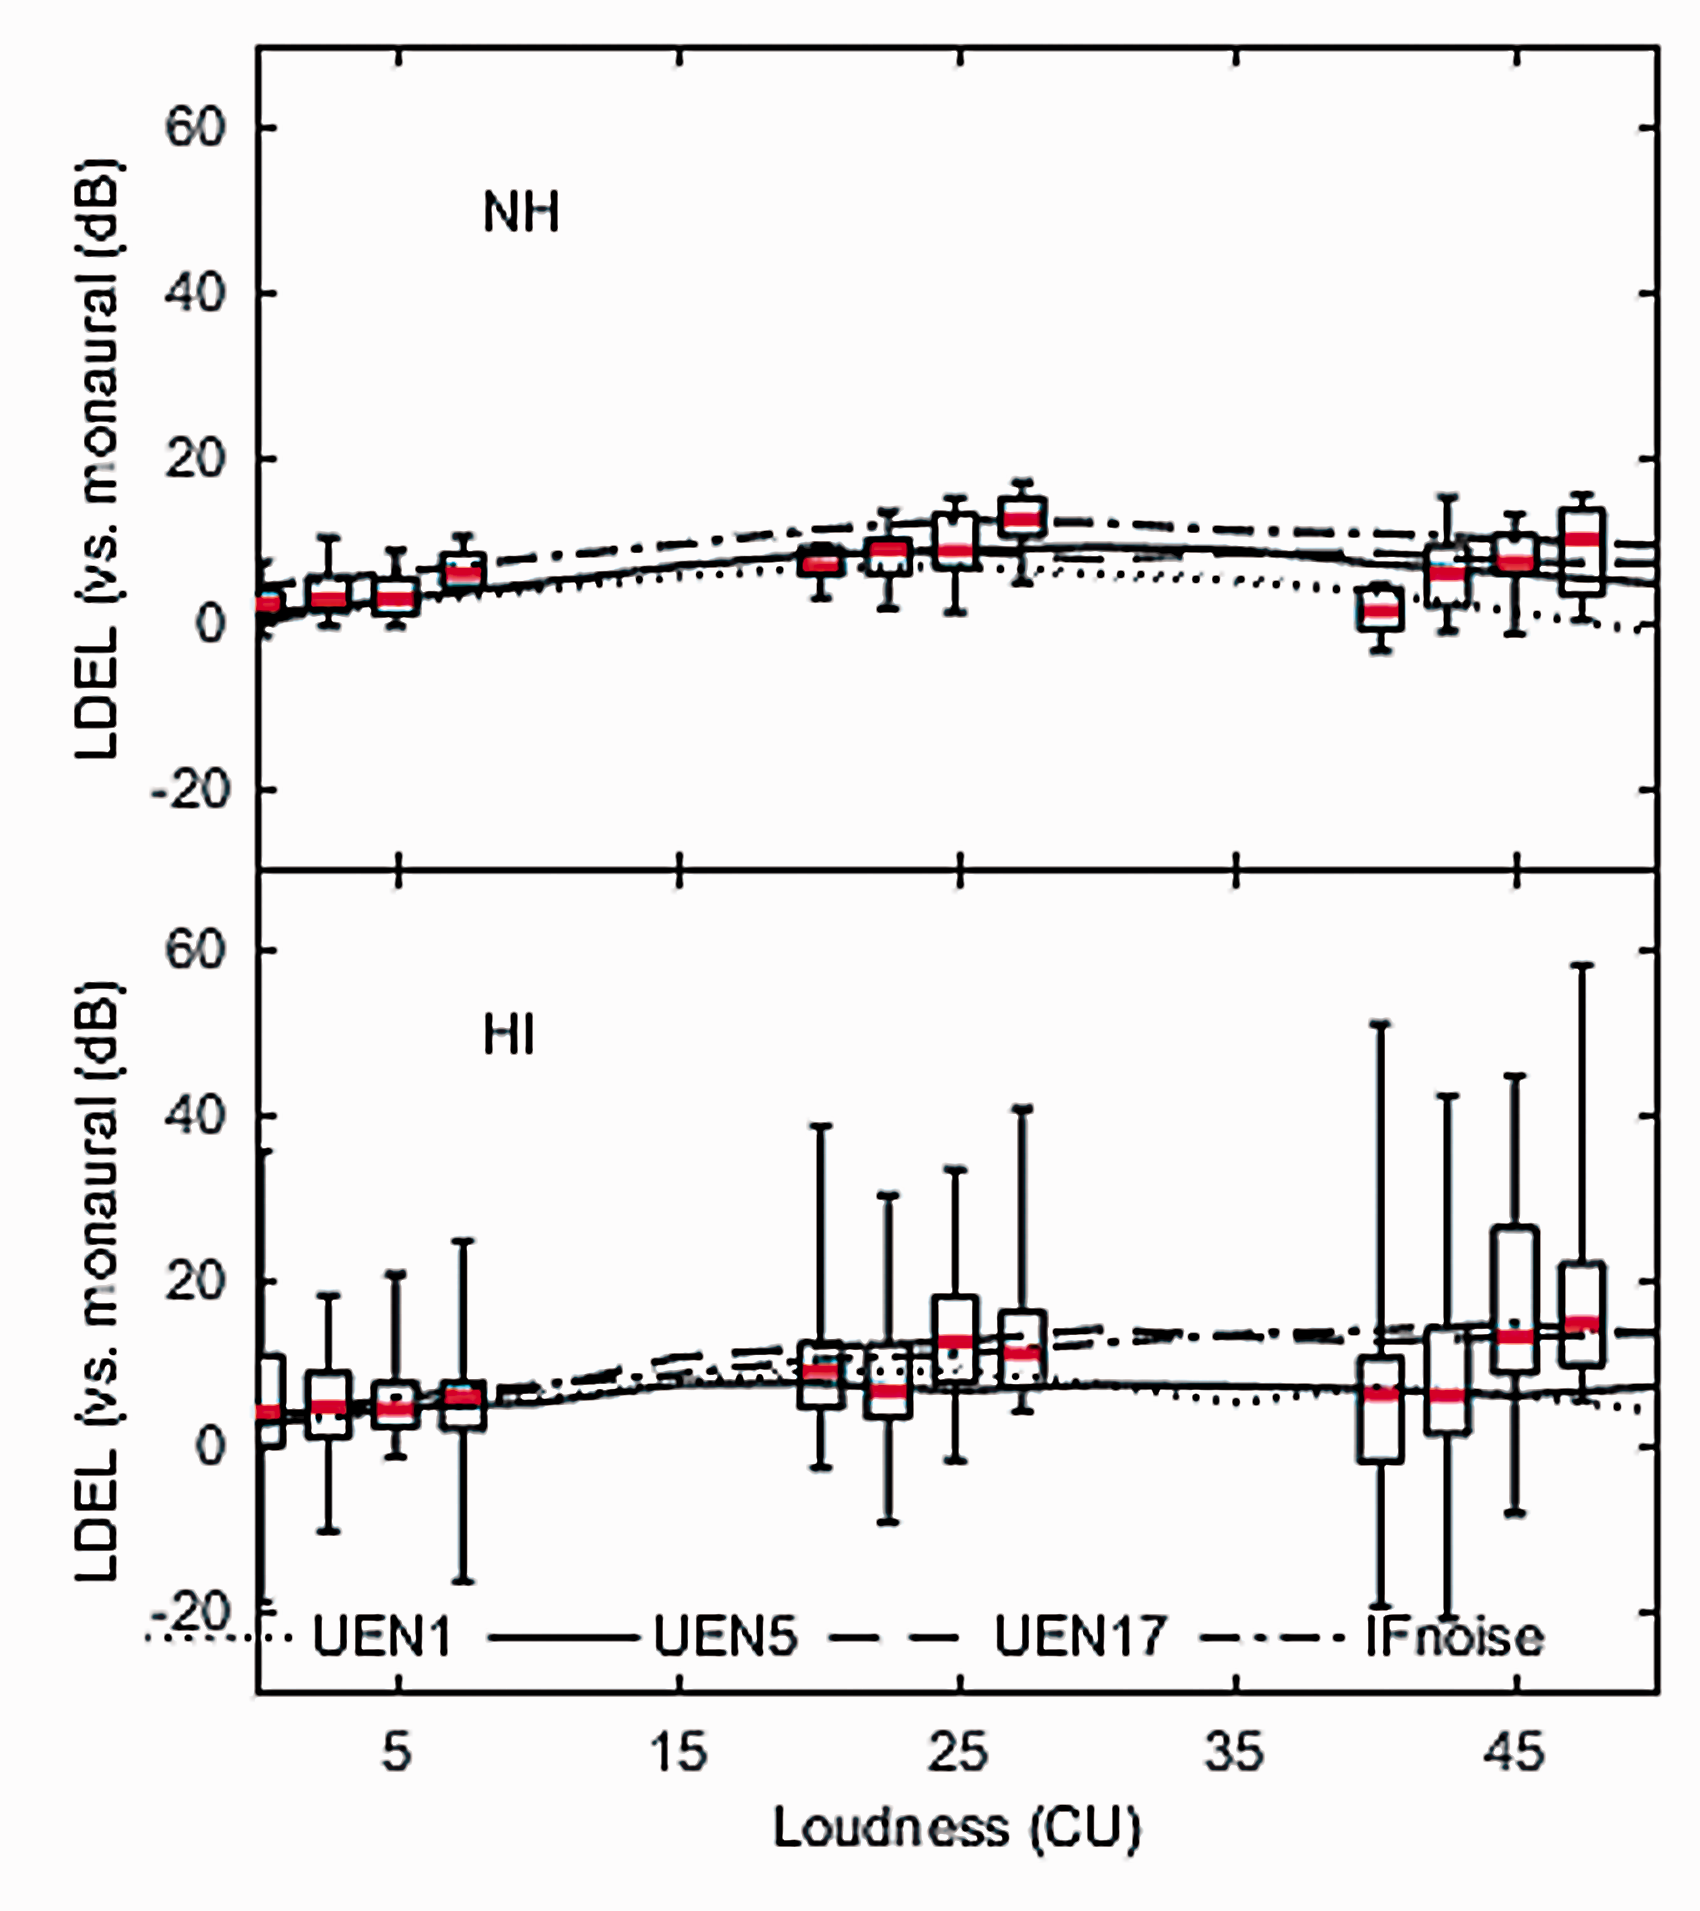

Predictability of the Binaural Loudness for Broadband Signals
Correlation Values (Pearson’s r) Between the Levels at 45 CU of the Binaural IFnoise and Several Test Values for Both the Right and the Left Ear.

Note. Significant values at a level of p = .05 are marked with an asterisk. CR = compression ratio; PTA = pure-tone average; UEN = uniformly exciting noise; IFnoise = International Female noise.
p < .05. **p < .01. ***p < .001.
In most cases, the correlation coefficients were weak, but some significant correlations were found. There is a trend of negative correlations (not all of them reach the level of significance) between the different PTA parameters and binaural loudness for the IFnoise, indicating that less binaural loudness is found for higher HLs, despite the correction based on monaural loudness and the high level.
Positive significant correlations were found for the broadband monaural signals (UEN17 and IFnoise), indicating that binaural loudness is increased when spectral loudness summation is higher. The strong correlation between monaural and binaural results appears to be determined by spectral summation effects for the N4 audiograms. All correlations with the CRs of the low-noise noises used to perform the loudness equalization were nonsignificant.
All HI listeners completed the Abbreviated Profile of Hearing Aid Benefit questionnaire during the study. No clear correlations between the answers on the aided or unaided Abbreviated Profile of Hearing Aid Benefit and the amount of binaural loudness summation were found.
Discussion and Conclusions
Monaural Spectral Loudness Summation
The results in this study are an extension of the work by Oetting et al. (2016), as Oetting et al. (2016) measured only a small sample of HLs with a relative small HL (N1:1, N2: 4, N3: 1, and S1: 4). In this study, group sizes were increased and moderate to severe HLs were included. In both studies, spectral loudness summation for HI listeners was found to be higher than in NH listeners. Oetting et al. (2016) compared monaural spectral loudness summation as measured with the current procedure to several studies from the literature (Appell & Hohmann, 1998; Bonding & Elberling, 1980; Brand & Hohmann, 2001; Garnier, Micheyl, Arthaud, Berger-Vachon, & Collet, 1998; Strelcyk, Nooraei, Kalluri, & Edwards, 2012; Verhey, Anweiler, & Hohmann, 2006). The Λ-shape and 10 to 15 dB spectral loudness summation found by Oetting et al. (2016) for NH listeners was in agreement with data from the literature with some minor exceptions. For HI listeners, Oetting et al. (2016) noted that the literature data showed a decrease in spectral loudness summation with increasing HL, which was in contrast with their own results. However, all studies agreed about the fact that the variability in the results of HI listeners was large.
In this study, the effects on spectral loudness summation were largest for the largest bandwidths UEN17 and IFnoise (in correspondence with, i.e., Zwicker, 1958) and increased with the degree of HL in agreement with the results by Oetting et al. (2016). Spectral loudness summation was negligible for UEN5. Compared to the data by Oetting et al. (2016), this study shows slightly more undercompensated loudness for UEN1. This effect is seen for subjects in all Bisgaard classifications and seems to be larger for subjects with higher losses (N4 and S3). This could be due to the fact that loudness functions for narrowband gain compensation were limited to 105 dB HL and obviously the calculated gain values were not sufficient to achieve a complete narrowband loudness compensation.
Only a few other studies investigated spectral loudness summation for different degrees of HL. Bonding and Elberling (1980) measured spectral loudness summation for different degrees of flat HL (PTAs of 0.5, 1 and 2kHz of 25 dB, 40 dB, and 50 dB HL). The flat audiograms in this study correspond to PTAs of 27 dB (N2), 42 dB (N3), and 58 dB (N4). Bonding and Elberling (1980) found that SLDELs for HI listeners were smaller than for NH listeners at the same reference level of the narrowband signal, with no clear effect of the degree of HL on the maximum SLDELs reached. The reference level as defined by Bonding and Elberling (1980) does not ensure equal loudness for NH listeners and HI listeners at the same reference level. Therefore, it is not clear whether the difference in SLDELs for NH listeners and HI listeners would still be found, if their results were analyzed according to a loudness scale that ensured equal loudness for both groups, as in this study. The bandwidth of 1600 Hz used by Bonding and Elberling may contribute further to the absence of an effect of degree of HL on the maximum SLDEL in their study, as in this study, the effect of the degree of HL was only apparent for the broadband signals UEN17 and IFnoise but was small for UEN5 (1080-Hz bandwidth).
Strelcyk et al. (2012) showed that the method of HL compensation can influence the amount of absolute spectral loudness summation. They used three different multichannel compression systems and measured their effects on loudness summation. As in this study, they compensated the broadband loudness signals for the degree of HL. In contrast to our study, their compensation strategy was not loudness based but threshold based. Strelcyk et al. (2012) found no difference in the maximum SLDELs between a 230-Hz wide reference signal and a 1600-Hz wide test signal for the HI listeners included (with a flat HL and a PTA across 0.5, 1, 2, and 4 kHz of 55 dB, which is in between our N3 and N4 listeners) relative to NH listeners. This is not in contrast with our results, as the larger SLDELs for HI listeners in this study were found for UEN17 and IFnoise and not for UEN5 and UEN1. As in Bonding and Elberling (1980), for HI listeners, the level of the maximum was shifted to higher levels for the signals centered around 1 kHz. This is in line with the current data, as maximum SLDELs were found around 25 CU, and the level at which 25 CU is reached is shifted to higher levels for subjects with increased HL.
In this study, flat audiograms (N2, N3, and N4) were compared with (a few) sloping audiograms (S), as loudness models predict more spectral loudness summation in the high-frequency region than in the low-frequency region (DIN, 1991; ANSI, 2007). Nevertheless, Schlittenlacher, Ellermeier, and Hashimoto (2015) found only minor differences in loudness summation between lower (125–1000 Hz), middle (500–2000 Hz), and higher (1.25–5 kHz) noises when these signals were compared with a 1-kHz tone. More HL in the high frequency could therefore give rise to less spectral loudness summation. However, in this study, no clear differences were found between flat audiograms and sloping audiograms. The largest deviations were found for audiograms classified as N4. N4 audiograms mainly deviate from the other audiogram configurations in the low-frequency region.
It is not clear why monaural spectral loudness summation is increased for HI listeners. In theory, the widening of the critical bands for HI listeners should lead to a decrease in spectral loudness summation (e.g., Moore & Glasberg, 2003). In the S audiograms, the HL in the high frequencies (2, 4, and 6 kHz) is close to or greater than the HL in N4, but the spectral loudness summation is clearly smaller. This suggests that spectral loudness summation in the N4 listeners is mainly influenced by the low frequencies. The relatively large gains in the low frequencies for the N4 HI listeners may have caused upward spread of masking. If this was the case, the narrowband normalization strategy used in this study may have induced higher loudness values that could have been interpreted as spectral loudness summation. This requires further research.
Binaural Loudness Summation
Oetting et al. (2016) summarized the findings on binaural loudness summation in other studies with HI listeners (Dermody & Byrne, 1975; Hawkins, Prosek, Walden, & Montgomery, 1987; Moore, Gibbs, Onions, & Glasberg, 2014; Whilby, Florentine, Wagner, & Marozeau, 2006). They concluded that the BLDELs between monaural and binaural stimuli fell between 5 and 8 dB. This corresponds reasonably well with the median results found for UEN1 and UEN5, where BLDELs were found ranging from 2.8 dB at low loudness categories up to 8.0 dB at high loudness categories. Similar binaural loudness summation values were also found for normal hearing listeners (for an overview, see Whilby et al., 2006).
In this study and in the study by Oetting et al. (2016), signals with larger bandwidths (UEN17 and IFnoise) were used than in other studies. In the current studies, average BLDELs were found to be 11.5 and 12.3 dB for UEN17 and IFnoise, respectively. Thus, binaural loudness summation increased with increasing bandwidth. On average, spectral and binaural loudness summation seems to add, causing an extra strong bandwidth dependency for the combined effects of binaural and spectral loudness summation.
Because the monaural results sorted by audiogram class (Figure 6) show great similarities with the binaural results (Figure 10), it is tempting to assume a common origin. However, the analysis of the effect of presentation (monaural to the right, monaural to the left, and binaural) shows that the binaural results are significantly different from both monaural results, while the monaural data do not significantly differ from each other. This is reflected in Figure 11. In this figure, the HI listeners classified as N4 show binaural summation close to normal, which seems to imply that the large combined spectral and binaural loudness summation is mainly caused by the large spectral monaural loudness summation. For HI listeners classified as N3 and S, binaural summation for the broader bandwidths is larger than normal, suggesting a separate binaural effect next to the spectral loudness effect.
BLDEL (re monaural signals) for the different audiometric classifications tested for binaural signals at 25 CU. CU = categorical unit; UEN = uniformly exciting noise; IFnoise = International Female noise; NH = normal hearing; LDEL = level difference for equal loudness.
Interactions Between Spectral and Binaural Summation
This study shows a HL dependency for spectral loudness summation of binaurally presented signals. For small HLs (N2), spectral loudness summation of binaural sounds is the same as for NH listeners. For the larger HLs (N3, N4, and S), spectral loudness summation of binaural sounds tends to be higher than normal, with extremely high values for N4.
With respect to binaural summation of broadband sounds itself (binaural conditions versus monaural conditions), no clear HL dependency was found. Binaural summation of broadband sounds appears to be larger for N3 and S than for NH listeners, but statistically, this difference was not significant. However, in binaural loudness summation of broadband sounds, the effect of bandwidth did lead to a statistically significant difference: UEN17 and IFnoise showed more binaural loudness summation of broadband sounds than UEN1 and UEN5. The finding that listeners with an N4 audiogram showed large spectral loudness summation for binaural signals, but normal binaural loudness summation, indicates that spectral loudness summation of binaurally presented sounds may be a complex combination of the effects of bandwidth and HL.
The Effects of HL
HL may influence binaural loudness perception in two ways. First of all, central gain may be increased. Eggermont (2017) reviewed the influence of acquired HL on the central auditory system and found increased spontaneous firing rates and increased neural synchrony at the level of the auditory cortex. Salvi et al. (2017) reviewed a comprehensive series of experiments aimed to determine how loss of the inner hair cells type I system affects hearing in chinchillas. They concluded that the results suggest that when the neural output of the cochlea is reduced, the central auditory system compensates by turning up its gain so that weak signals once again become comfortably loud. Chen, Radziwon, Kashanian, Manohar, and Salvi (2014) found a correlation between salicylate-induced hyperactivity in the central auditory systems of rats with behavioral evidence of loudness hyperacusis. Excessive increases of the central gain may thus convert recruitment into loudness hyperacusis.
Increased binaural loudness summation could also be explained by a decrease of contralateral suppression in HI listeners activated by the medial olivocochlear (MOC) system. MOC feedback to the cochlea is believed to control cochlear gain and to enable modulation of auditory nerve activity (Guinan, 2006; Guinan & Gifford, 1988; Warr, 1975). However, in a study by Wilson, Sadler, Hancock, Guinan, and Lichtenhan (2017) in children with autism spectrum disorder, MOC inhibition of transient otoacoustic emissions was on average larger at all frequencies for a group with severe hyperacusis compared with a group without severe hyperacusis. The stronger activity of the MOC in the groups related to hyperacusis is not compatible with the hypothesis of decreased contralateral suppression. Wilson et al. (2017) propose an increased gain in the central auditory pathways as an explanation for the increased MOC effect.
Limitations of the Current Approach
The results presented in this study have to be considered in relation to the choices made for the experimental setup. In categorical loudness scaling, the choice of the number of response alternatives is a factor that influences the slope of the loudness curve. With an increasing number of response alternatives, the knee point of the fitted loudness function tends to shift to lower intensities (Brand, 2007). The LDELs presented are therefore influenced by the choice for the procedure for categorical loudness scaling. In several studies, the reproducibility of categorical loudness scaling has been investigated (Al-Salim et al., 2010; Cox, Alexander, Taylor, & Gray, 1997; Rasetshwane et al., 2015; Robinson & Gatehouse, 1996) and has been found to be good on group level. Rasetshwane et al. (2015) found that categorical loudness scaling was reliable even at an individual level and leads to comparable results with other loudness measurements when the CUs are transformed to phons. They calculated the standard deviation of the signed differences between test and retest for 22 subjects and found a mean of 4.22 dB.
The LDEL values are also influenced by the choice for the current compression system with six nonoverlapping channels. As Strelcyk et al. (2012) showed, the compressor influences the loudness summation after loudness equalization. More channels or other choices for the frequency limits could lead to different LDELs while the underlying real physiological loudness summation processes have not been changed.
The LDEL values further depend on the selected broadband test signals. In some subjects, we found high spectral loudness summation for the IFnoise and lower spectral loudness summation for the UEN17. It might be that the narrowband loudness compensation applied to the signals lead to a lower perceived bandwidth of the UEN17 signal compared to the IFnoise.
Finally, the measurement setup will influence the measured LDELs. The choice for a specific headphone (HDA 200) and equalization method (free-field equalization) defines the signal at the eardrum. Another setup would inherently have resulted in a different signal at the eardrum. For instance, Thiele et al. (2014) found that the 50% speech reception threshold measured with the HDA200 headphones with free-field correction was on average 5.1 dB lower than for loudspeakers. Thus, even widely used equalization methods do not guarantee equal sound characteristics at the eardrum.
The narrowband loudness normalization method used in this study is not directly suitable for use in hearing aid fitting, as normalizing narrowband loudness does not guarantee normal binaural broadband loudness. Furthermore, normal binaural broadband loudness does not guarantee optimal speech understanding and optimal comfort. The large interindividual differences in binaural loudness perception are an important finding, but implications on hearing aid fitting require further research.
Clinical Implications
The results of this study confirm the findings by Oetting et al. (2016) that spectral loudness summation of binaurally presented sounds can be extremely large in HI listeners. Although a significant effect of the audiometric configuration on the amount of spectral loudness summation of binaural sounds was found, the variability in each group was that large that the spectral loudness summation of binaurally presented sounds could not be predicted from the audiometric classification alone. The correlation matrix shows that other predictors based on audiogram or monaural loudness measurements also fail to give a good prediction of the amount of the combined spectral and binaural loudness summation. As we encounter in daily practice very often broadband sounds presented in a binaural situation, spectral and binaural loudness summation are highly relevant features. The current hearing aid fitting rules based on monaural threshold measurements utilize average gain corrections for bilateral fittings that are identical for all HI listeners. NAL-NL2 propose bilateral compensation factors (reductions in gain) relative to an unilateral fitting ranging from 2 dB for input levels below 40 dB to 6 dB for input levels at 90 dB SPL and above regardless of signal bandwidth (Keidser, Dillon, Carter, & O’Brien, 2012). Our results show a clear bandwidth dependency of binaural loudness summation with individual binaural summation effects higher than 30 dB for broadband input signals presented at mediate to high levels (see Figure 9). In our approach, input levels are processed according to the six-channel compressor with independent CRs to compensate the narrowband loudness perception. Loudness summation expressed as output levels will therefore give a smaller effect size. However, the effect is still sizable, as the mean CR is 2.1:1 averaged over all frequencies for the Bisgaard classes N3, N4, and S. Taken compression into account, the average amount of binaural loudness summation in output terms is still in excess of 14 dB for the more severe HLs. With individual differences ranging from about 30 dB at 25 CU to over 60 dB at 45 CU (cf. Figure 9), taking the effect of compression into account still leaves output level differences in individual binaural loudness summation between 14 and 29 dB. These values are in accordance with the large interindividual differences in LDLs found by Formby et al. (2017) for monaural warble tones.
Therefore, there is need to adjust fitting rules for bilaterally fitted hearing aids to take the large individual differences in loudness summation into account. Regarding the high variability in the individual data, it seems to be imperative to determine individual amounts of gain correction based on separate tests of loudness perception, including spectral and binaural loudness summation.
Footnotes
Acknowledgments
The authors thank Marije Wolvers for her help with the statistical analysis. The authors also thank Addy Mols for her participation in the data collection. The authors would also like to thank Josef Schlittenlacher and two anonymous reviewers for their constructive comments.
Declaration of Conflicting Interests
The authors declared no potential conflicts of interest with respect to the research, authorship, and/or publication of this article.
Funding
The authors disclosed receipt of the following financial support for the research, authorship, and/or publication of this article: This research was supported by a grant from the Heinsius Houbolt fund.