One objective way to evaluate the effect of noise reduction algorithms in hearing aids is to measure the increase in signal-to-noise-ratio (SNR). To this end, Hagerman and Olofsson presented a method where multiple recordings take place and the phase of one signal is inverted between the measurements. This phase inversion method allows one to separate signal and noise at the output of the hearing aid so that the increase in SNR can be evaluated. However, only two signals can be distinguished, for example, speech and noise. As many realistic situations include more than two signals, we extend the method to an arbitrary number of signals. Two different approaches are discussed. For the first one, groups of the signals are created and presented in such a way that the basic phase inversion method can be used. The second, more efficient approach defines a linear system of equations considering all signals. As the robustness of this approach depends on the structure of the system matrix, the design of this matrix is described in detail. To prove the concept, the proposed efficient method was applied to a setup in which nine different signals were presented by eight loudspeakers, and an analysis of errors was performed. With this setup, a state-of-the-art hearing aid was analyzed for four different settings, that is, with the digital noise reduction or the directional microphones turned on or off. As a result, the SNRs for all directions can be investigated individually.
With decreasing signal-to-noise-ratio (SNR), speech intelligibility decreases and listening effort increases. Which level of speech intelligibility and listing effort is reached depends not only on the characteristics of speech and noise but also on the hearing ability of a listener. In noisy situations with low SNR, hearing impaired people suffer more from reduced speech intelligibility and increased listening effort than normal hearing people (Holube, Fredelake, & Hansen, 2006).
Therefore, the intention of the signal processing for hearing aids is not only to amplify signals and make them audible again but also to increase the SNR to make sounds easily understandable. Hearing aids with adaptive features such as digital noise reduction and directional microphones can enhance the SNR (Chung, 2004). Studies show that these features can increase speech intelligibility (Bentler, 2005; Brons, Houben, & Dreschler, 2014) and can decrease listening effort (Sarampalis, Kalluri, Edwards, & Hafter, 2009).
To objectively evaluate the effect of noise reduction algorithms in hearing aids, several approaches exist such as computing the modulation transfer function (Holube et al., 2006), performing a percentile analysis (Harries, 2010), or using the phase inversion method (Hagerman & Olofsson, 2004). Among these three examples, the phase inversion method enables the separation of speech and noise at the output of the hearing aid so that the SNR can directly be computed. However, it is limited to a separation of two signals from one (Hagerman & Olofsson, 2004) or two directions (Aubreville & Petrausch, 2015). Consequently, more realistic acoustic environments with more than two signals from various directions cannot be evaluated with this method. In Ricketts (2000), it is shown that traditional test environments with a single noise source located at azimuth cannot be used to accurately predict directional benefit in comparison to other tests with more than one noise source or within real-world environments.
This study demonstrates how the phase inversion method can be extended to separate an arbitrary number of signals. First, it is shown how this extension can be realized by successively subdividing the signals into two groups so that the basic phase inversion method of Hagerman and Olofsson can be applied. In addition, a more efficient approach is introduced where a linear system of equations is defined with a system matrix having entries of +1 and −1, only. Because the robustness of this approach depends on the structure of the system matrix, the design of this matrix is described in detail. To prove the concept, the proposed efficient approach was applied to a setup in which nine different signals were presented by eight loudspeakers. All loudspeakers were positioned around a hearing aid equally distributed on a circle with a radial distance of . Speech was presented from and noise from all eight directions (, … , ). With this setup, a state-of-the-art hearing aid was analyzed for different settings where the digital noise reduction or directional microphones were turned on or off. Moreover, an analysis of errors was performed.
This article is organized as follows. First, the phase inversion method for two signals is shortly introduced, and then two approaches for the extension to an arbitrary number of signals are presented. Next, the measurement setup for the analysis of the more efficient approach is explained, the outcomes are discussed, and an analysis of errors is shown. Finally, the results are summarized and a conclusion is given.
Phase Inversion Method
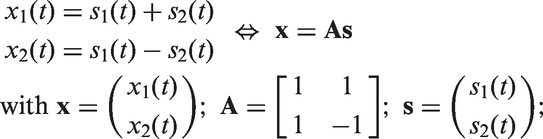
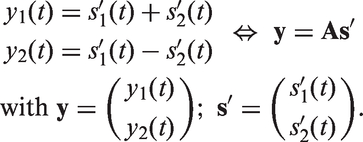
Let us consider two signals and that are simultaneously presented to a hearing aid, for example, speech and noise. These two signals are processed by the hearing aid, and at the output we can measure the superposition of both signals, that is, . The prime symbol indicates that these signals have been processed by the hearing aid. However, to compute the SNR, both signals need to be separated at the output of the hearing aid. The approach of Hagerman and Olofsson is to superpose the signals in two different ways at the input of the hearing aid as:
Both superpositions and are successively processed by the hearing aid, and the corresponding output signals and are recorded. The idea is that the phase inversion of does not change the signal processing within the hearing aid so that and and its contained components and experience the same gain, phase shift, and so forth. Under this assumption, the phase relation of the unprocessed signals and superposed in the input signals and also holds for the processed signals and superposed in the output signals and , respectively, and we can write:
Thus, the processed signals can be separated at the output of the hearing aid by solving the linear system of equations
As a last step, when the processed output signals and are separated, various parameters can be investigated, for example, the overall SNR, the SNR over frequency, and so forth.
In this context, it is important to note that all stated equations indirectly imply a linear dependency between input and output. If we consider a nonlinear signal processing which is not sensitive to a phase change of the input signal and where a phase change of the input signal is propagated in the same way to the output signal, no negative impact on the reliability of the method is expected. Nevertheless, because the exact influence of any nonlinear behavior is unknown, it is suggested to deactivate all nonlinear features of the signal processing that are not required for the evaluation. In particular, a feedback reduction, which changes the phase between input and output, can have a negative influence on the reliability of the method. Moreover, for a practical evaluation of an experiment, it is suggested to do some checks such as listening to the separated signals. Another possibility to evaluate the phase invariance is to present and and check whether the sum of the corresponding output signals vanishes.
Extension of the Phase Inversion Method
Successive Extension
A first approach is to successively subdivide all signals into two groups and to apply the original phase inversion method explained in the previous section. If we want to separate the i-th signal, we define two groups of signals as:
If we now superpose these grouped signals as described in the forgoing section, then for every i-th signal, we get the following superpositions:
This procedure can be repeated for all N signals so that each of the processed signals can be separated at the output of the hearing aid. For the evaluation of the measurement effort, it is important to mention that the superposition does not change and always contains the sum of all signals so that this measurement needs to be performed only once. Taking this into account, N + 1 superpositions have to be presented to the hearing aid to separate all of the N signals.
Extension Using a Linear System of Equations
The proposed novel approach is to define a linear system of equations that considers an arbitrary number of signals. To this end, the notation used for the explanation of the basic phase inversion method is intentionally chosen differently from the work by Hagerman and Olofsson. Representing the superposition of the input signals by a matrix-vector multiplication enables an easy extension to an arbitrary number of N signals. In this case, the vectors s and have the dimension N, for example, . To get an invertible system matrix A, this matrix requires to be quadratic with a size of N × N. An overdetermined system of equations is not considered in this context. Hence, the dimension of the vectors with the input and output signals x and y is also N. This means that N superpositions with are required to separate N signals . The question arises how the signals should be superposed, that is, what configuration should the system matrix A have.
Configuration of the system matrix
The multiplication with the system matrix shall not change the sound pressure levels of the individual input signals, because this would change the sound scene and would trigger a different signal processing by the hearing aid. Consequently, the entries of A are restricted to have absolute values of one, only. In general, a phase shift different from 180° could be considered, for example, by allowing complex entries for A and performing the multiplication in the frequency domain. Nevertheless, in this work, we focus on the treatment in the time domain and limit the entries to be real values. Thus, A can have entries of + 1 and −1, only. Furthermore, A needs to be invertible, and it is desirable to have a well-conditioned linear system of equations (condition number κ equal or near one). Considering these constraints, a good approach is to use a Hadamard matrix (Hadamard, 1893). This is a square matrix of size N × N whose entries are either +1 or −1, and its rows and columns are mutually orthogonal so that where is the identity matrix of size N × N. Moreover, if is a Hadamard matrix of size N × N, the inverse is given by and its condition number κ is 1. The matrix in the work of Hagerman and Olofsson is also a Hadamard matrix with N = 2. Nevertheless, Hadamard showed that this type of matrices exists for and with , only (Horadam, 2007).
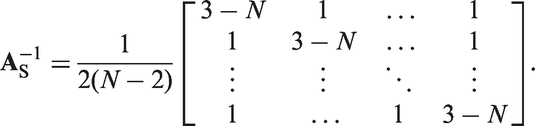
Therefore, for N > 2 and , we suggest to build the system matrix as follows:
For this type of matrix, the inverse reads:
The condition number κ for N = 3 is 2, and for N > 3 it is . This includes the case of N = 4, where is a Hadamard matrix. For N > 4, the condition number increases with N so that the robustness against measurement tolerances decreases. However, a brute-force search for N = 3 and N = 5, where all combinations of +1 and −1 have been tried out, showed that has the lowest condition number possible for these sizes.
Measurements
Setup
All measurements took place in a room with a height of 3.13 m and a surface area of 4.22 m × 5.20 m. The ceiling and the walls of the room were equipped with sound-absorbing material, and the background noise level was below 40 dB SPL. The hardware of the setup consisted of eight GENELEC speakers of type 8020, an RME Fireface 800 soundcard, a Bruel & Kjaer (B&K) ear simulator according to IEC 60318-4, a reference microphone from B&K of type 4190, and a PC with Matlab. The eight loudspeakers were equally distributed on a circle around the hearing aid with a radius of (see Figure 1). The speech signal used in this study was the International Speech Test Signal (ISTS) as defined in International Electrotechnical Commission (IEC 60118-15; 2012). This signal is based on natural recordings but is largely nonintelligible because of segmentation and remixing (Holube, Fredelake, Vlaming, & Kollmeier, 2010). The ISTS was presented from an angle of , and eight different noise signals were presented from all eight directions so that N = 9. The noise signals were generated similar to the ”IFnoise” described in (European Hearing Instrument Manufacturers Association, 2016), by superposing parts of the ISTS multiple times. Thus, all noise signals were incoherent, without modulation, and with the same long-term average spectrum as the ISTS. For the creation of the input signals , the system matrix with N = 9 was used. Before the presentation of each superposition, there was a pause with silence of at least 5 s. After starting the presentation, the signal processing of the hearing aid may require some time for adaptation, which should not be considered in the analysis. Therefore, all signals were evaluated in a time window from to , only.
The measurement setup consisting of eight loudspeakers, one reference microphone, and one state-of-the-art hearing aid (BTE) connected to an ear simulator according to IEC 60318-4. The BTE is facing the loudspeaker in in the same as defined in Figure 3 of IEC 60118-0:2015. Not shown is the RME fireface 800 soundcard and the PC.
For the measurements, a state-of-the-art behind the ear (BTE) hearing aid (with sound tube) was used, and the output was recorded with an ear simulator according to IEC 60318-4. The hearing aid and the reference microphone were oriented and positioned as defined in Figure 2 of IEC (2012), that is, the connection line between the two microphone inlets was pointing in the direction of the speaker at 0°. With the fitting software, the gain was adjusted in accordance with NAL-NL2 for an adult with a hearing loss of type N3 as defined in IEC (2012). Moreover, the output limiter, the dynamic compression, as well as other adaptive features such as feedback reduction and wind control were deactivated. For the analysis, just the noise reduction and a static microphone directionality were altered, resulting in the following four test settings:
noise reduction off and omnidirectional microphone (NR off, omni.),
noise reduction on and omnidirectional microphone (NR on, omni.),
noise reduction off and static microphone directionality (NR off, direct.),
noise reduction on and static microphone directionality (NR on, direct.).
Output SNR of the reference microphone in relation to the input SNR. Between the eight directions (0, 45, … , 315), the values are linearly interpolated. These four curves were recorded at the same time as the data shown in Figure 4 for the different hearing aid settings.
Definition of SNRs
Because there are multiple signals involved, different SNRs can be computed. In our setup, the ISTS is , the noise signal from is , the noise signal from is , and so forth. The root mean square (RMS) value of a signal with is indicated by adding the term “rms” to the index (). To exclude the adaptation process of the hearing aid, the RMS is computed for a time window from 15 s to 60 s as explained in the foregoing.
To begin with, we want to define the overall SNR as:
Furthermore, the SNR as a function of the azimuth angle α is denoted as so that we can write:
For the ISTS, a level of and for the overall SNR (), a value of was chosen. Thus, the individual level for each noise signal is SPL, and .
In addition, and are defined for the processed signals in the same way as for the signals s. Then, we can write the differences in SNR between the input and output as:
Analysis of Errors
Recordings of the Reference Microphone
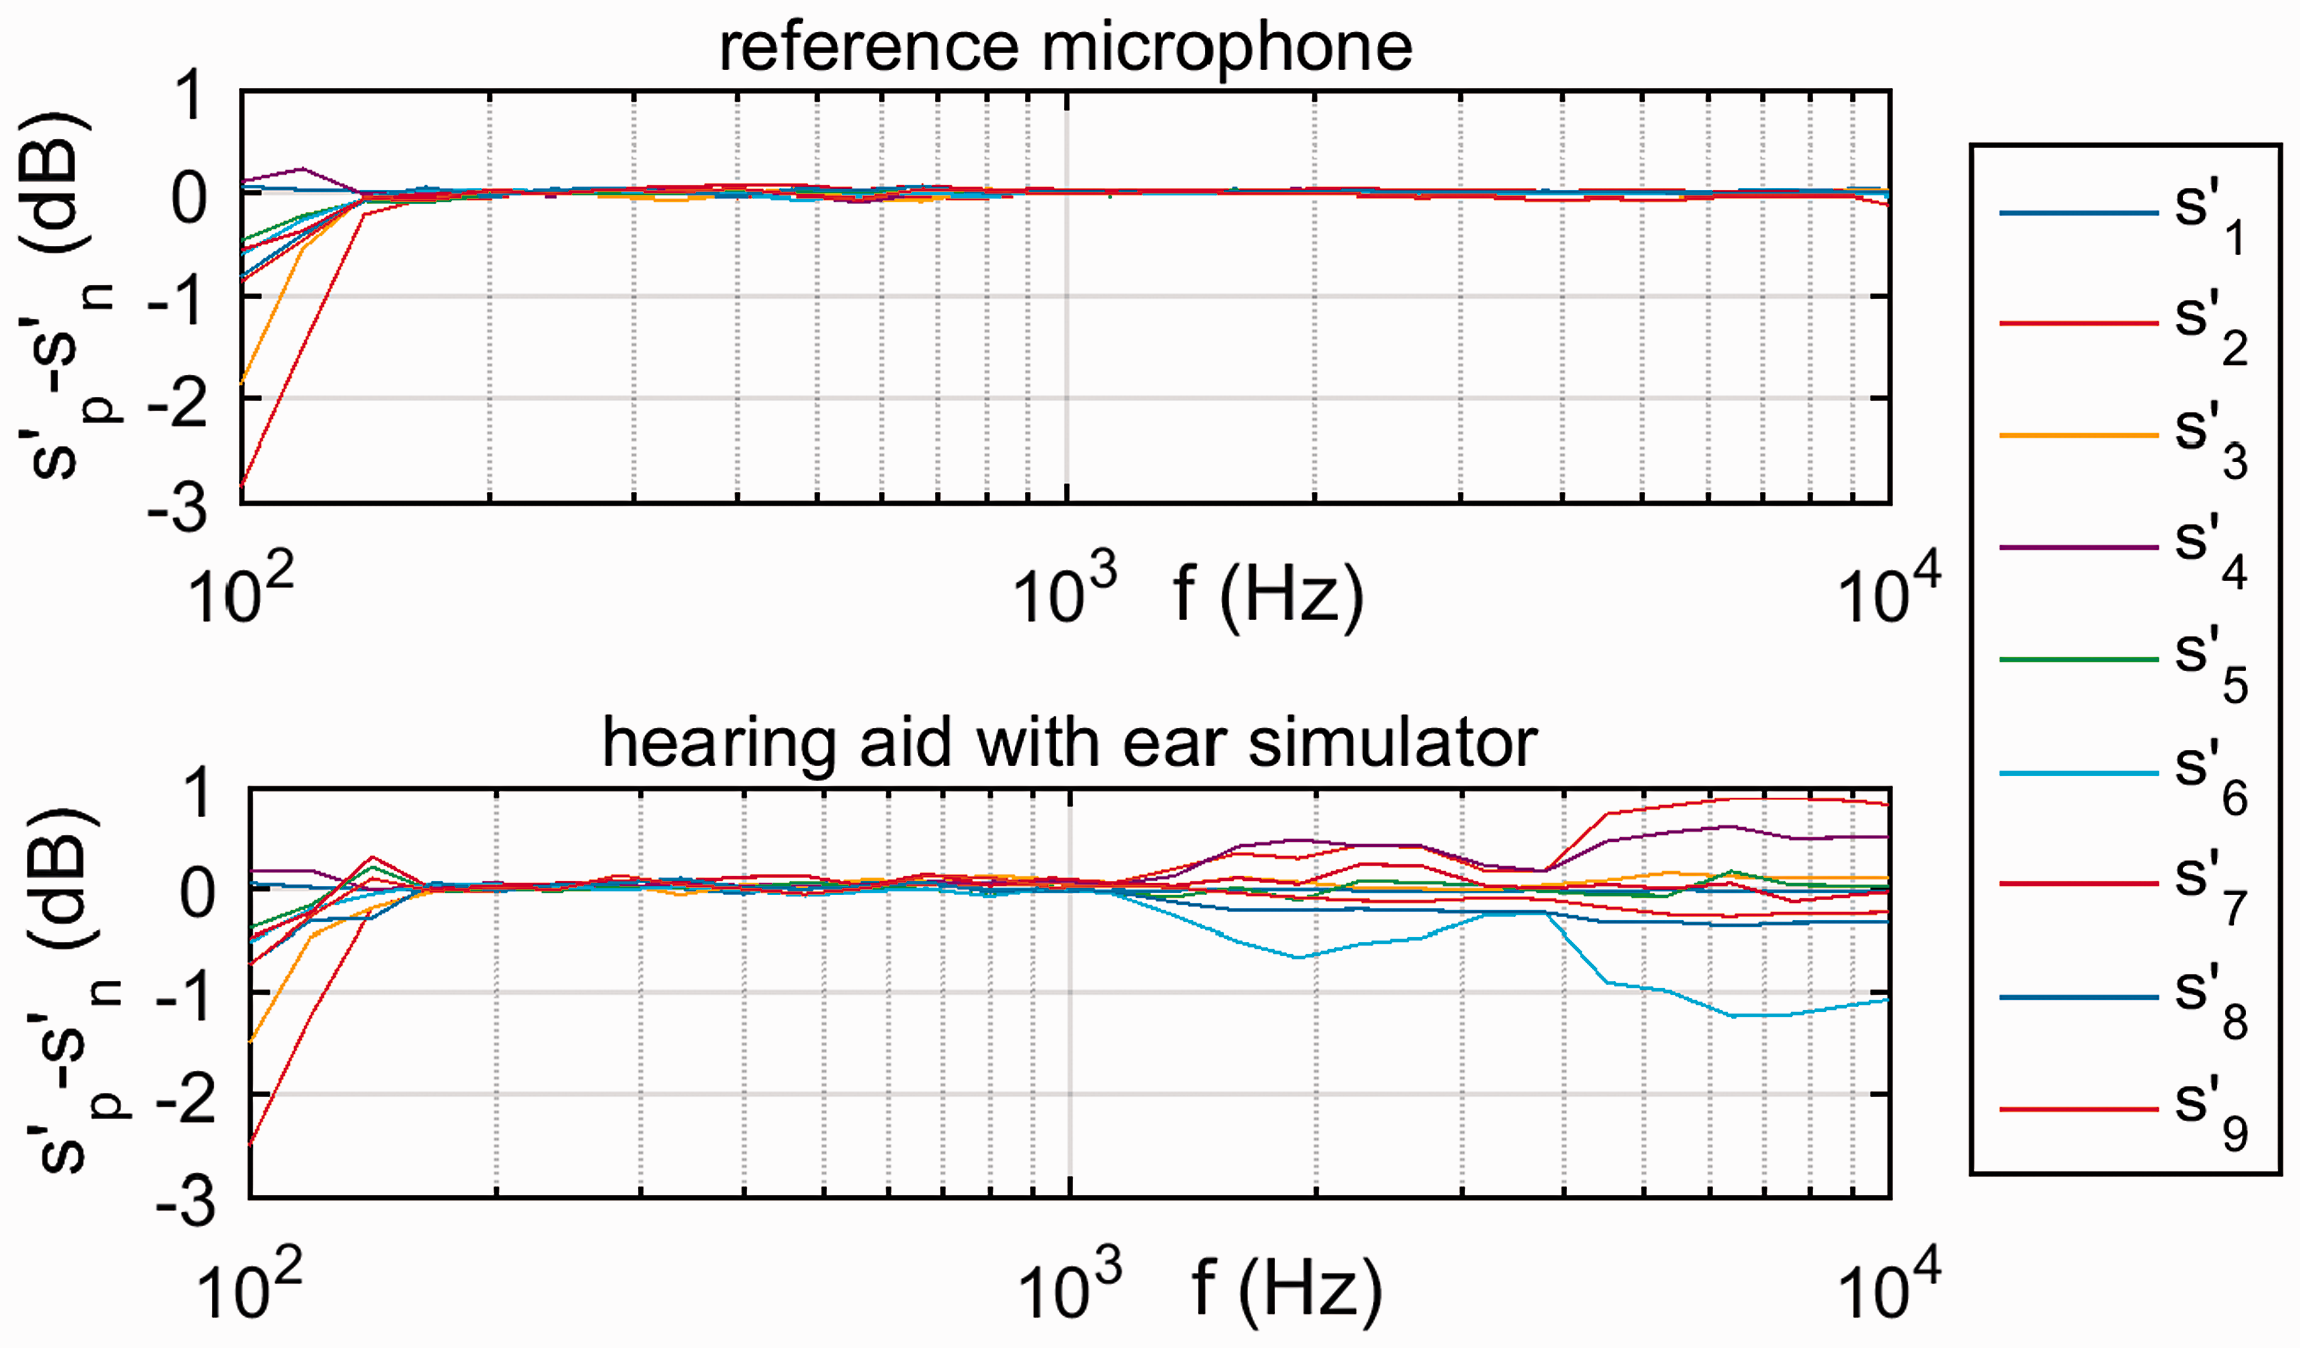
As a first check, the extended phase inversion method was applied to recordings of the reference microphone. Because we know that the reference microphone has an omnidirectional characteristic, we expect also an omnidirectional characteristic for . Moreover, because the signal from the reference microphone is not processed, should be zero. In Figure 2, we see for four recordings at the reference microphone. The deviation from zero is in the range of −1.2 dB to 0.5 dB. These curves were recorded at the same time as the data for four different hearing aid settings shown in Figure 4. Thus, the data also indicate the quality of the input signals captured by the hearing aid to process the data depicted in Figure 4. Because we know the error on the input signal, we have used this information to compensate for it. For this purpose, we used the SNRs computed for the reference microphone instead of the ideal SNRs as reference for the computation of the results shown in Figures 4 and 5.
One third octave-level differences of determined with a positive and negative system matrix AS for noise reduction and directional microphones being activated.
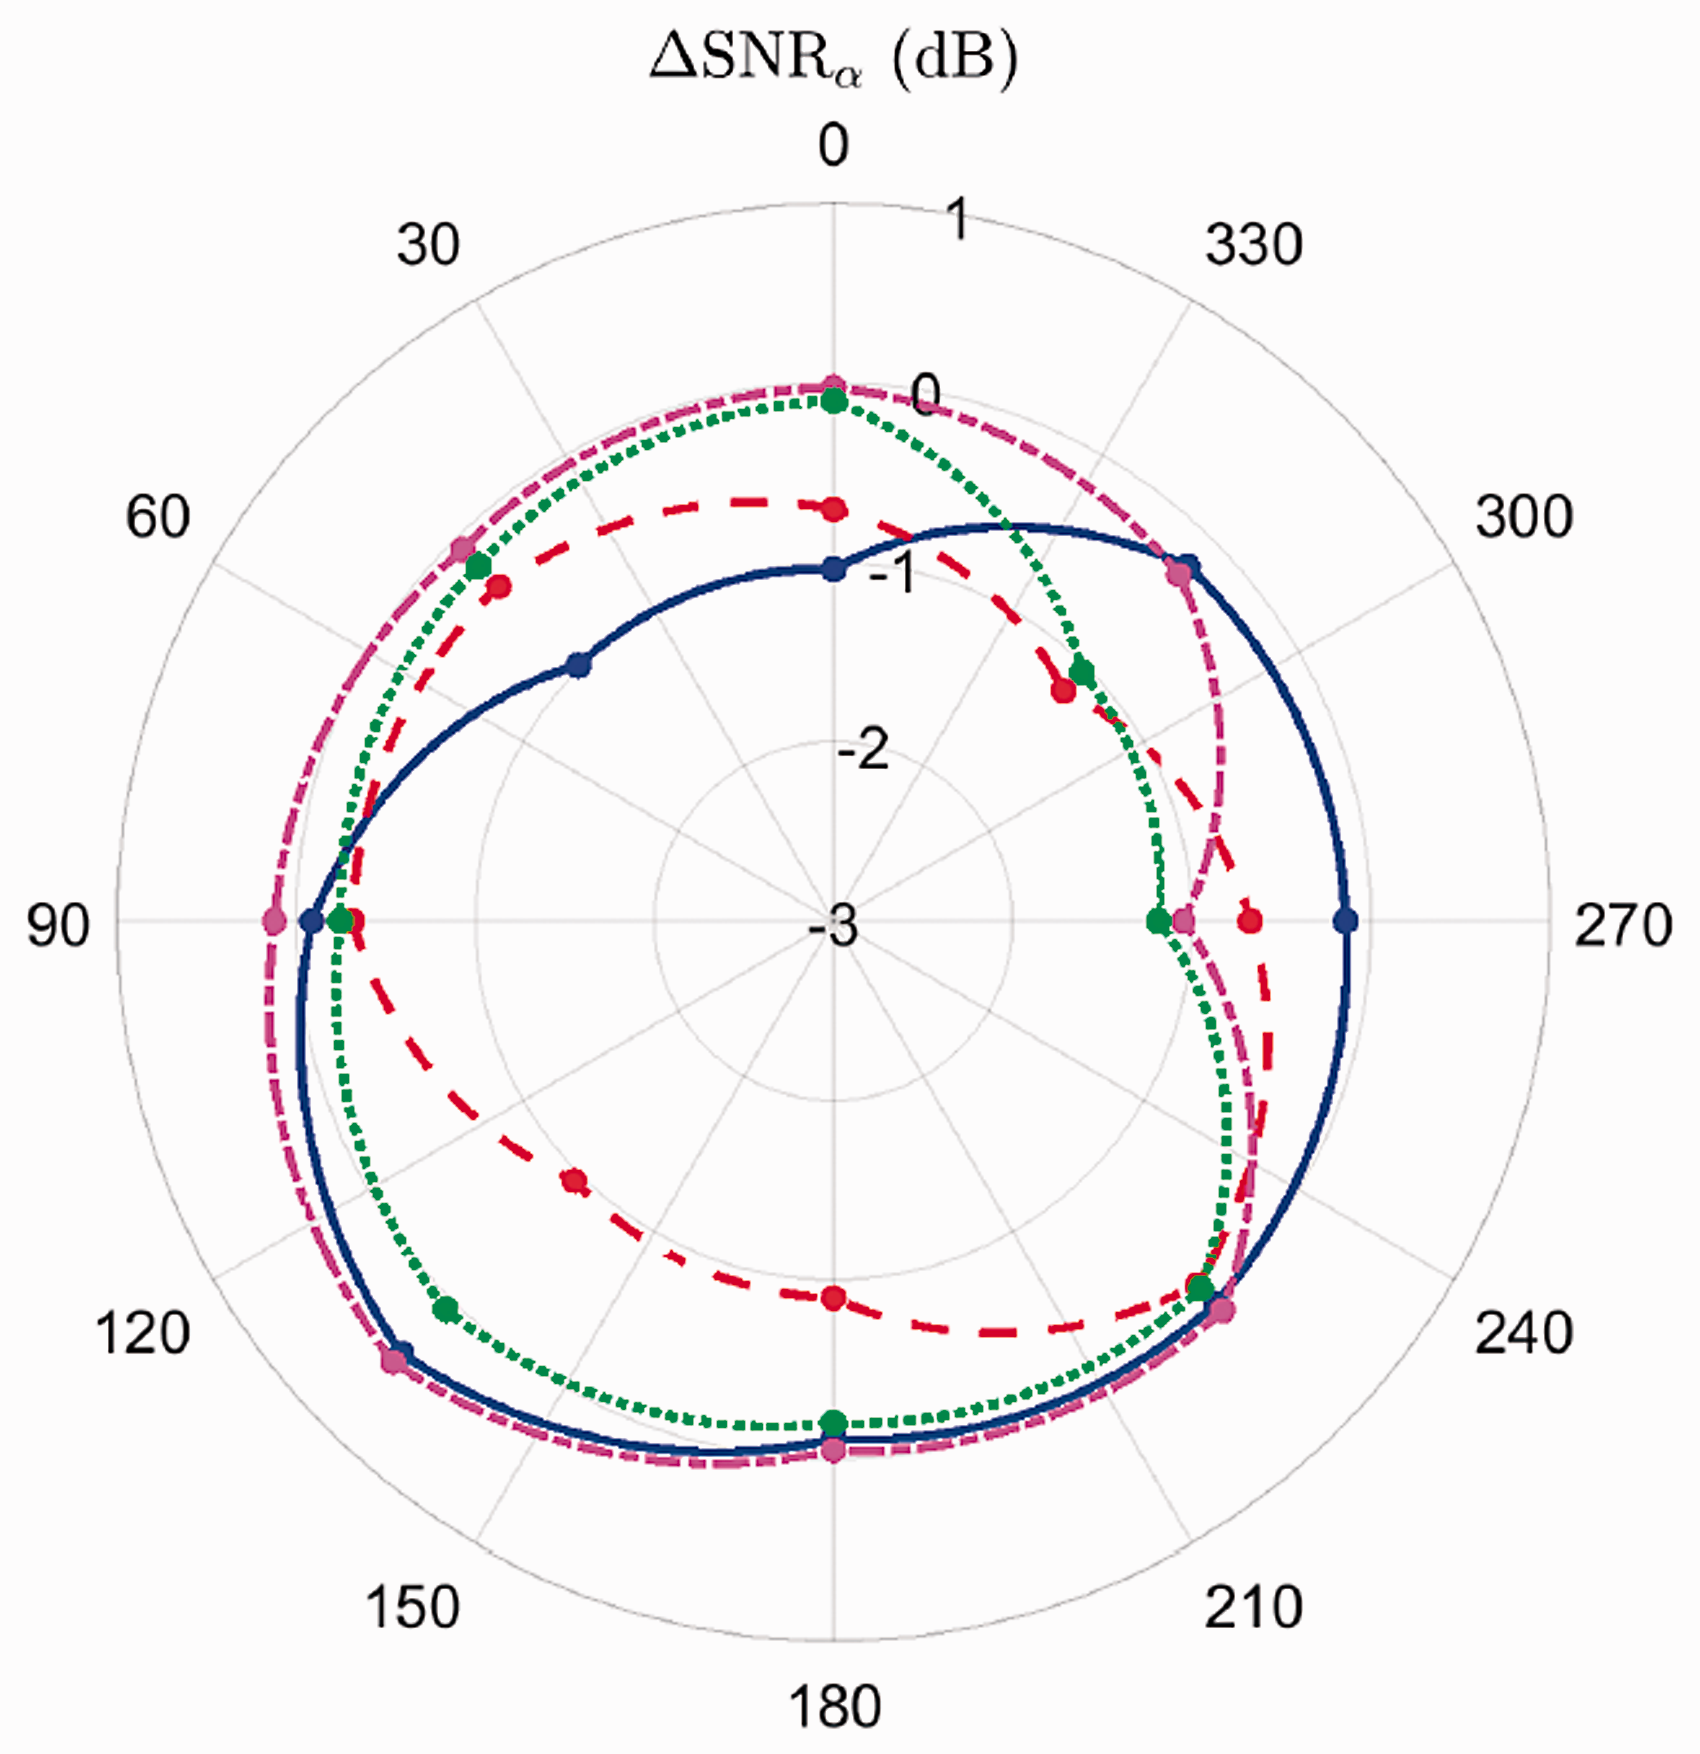
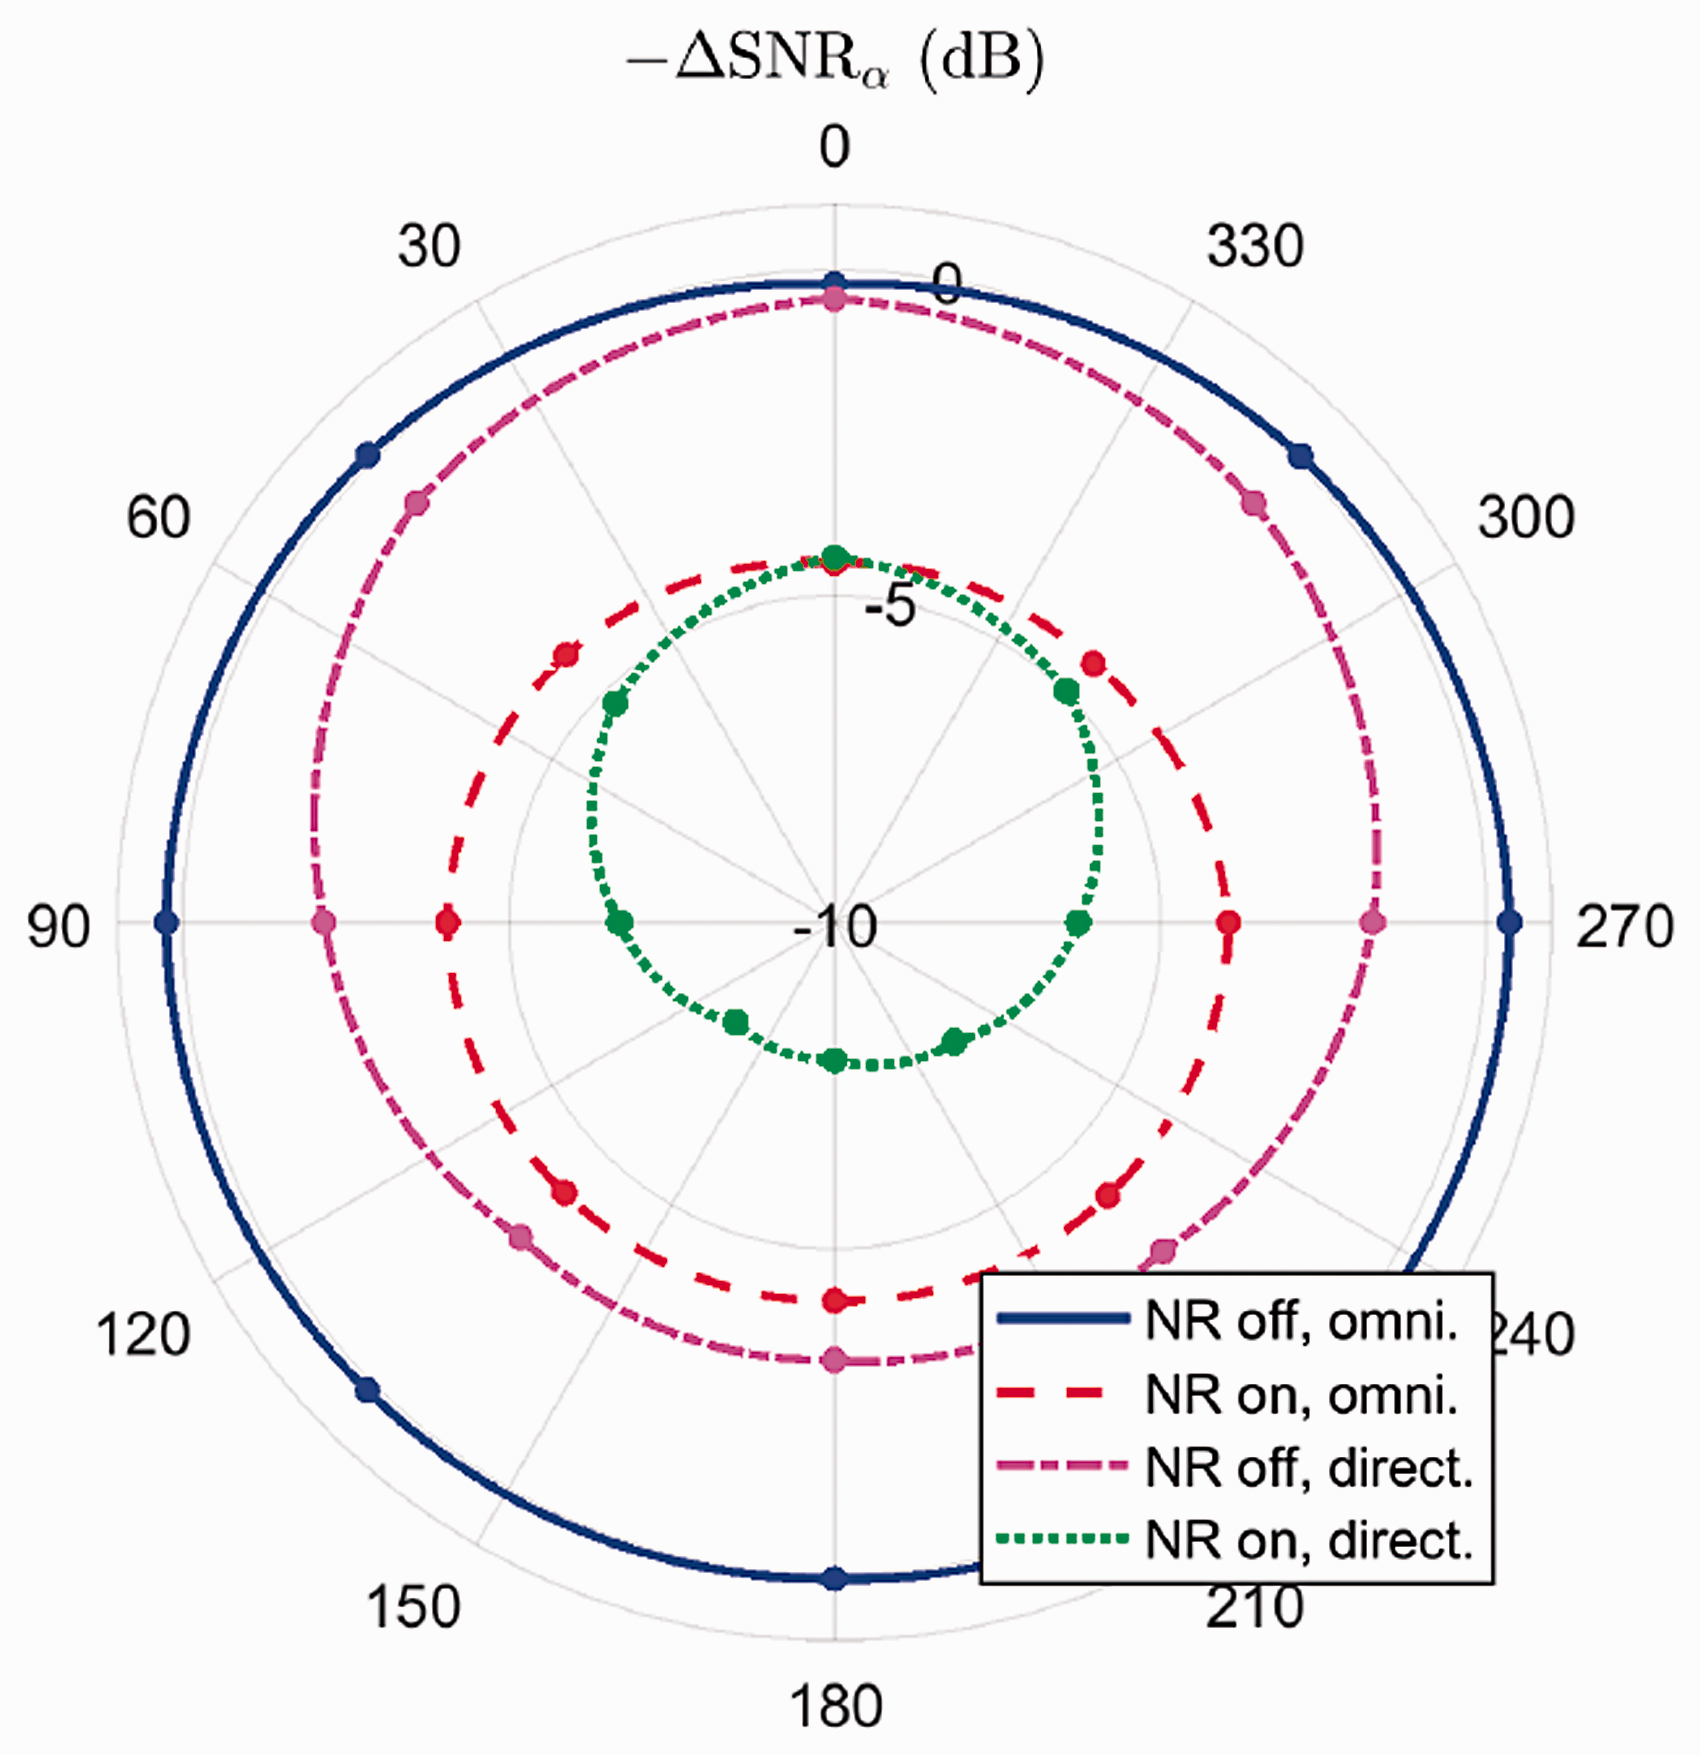
Output SNR of the hearing aid in relation to the input SNR. The directional microphone of the hearing aid is orientated in direction. Each line represents the result of one of the four hearing aid settings listed in the legend. Between the eight directions (, … , ) the values are linearly interpolated.
Change in the overall SNR for all four hearing aid settings.
Condition of the system matrix
As described in the foregoing, the condition number of the system matrix is one parameter to evaluate the impact of tolerances and interferences. There are many different tolerances and interferences conceivable, for example, geometrical tolerances such as a nonideal positioning and alignment of the loudspeakers, the reference microphone, and the hearing aid; interferences such as background noise, drifts of the sensitivity of the microphones or of the eight loudspeakers, and so forth. A detailed analysis of all individual effects of different measurement tolerances would go beyond the scope of this work. Nevertheless, we want to depict the influence of the design of the system matrix on the measurement accuracy with two experiments. For this purpose, we introduce the system matrix:
is arbitrarily chosen with a worse-conditioned number compared with so that the impact of the condition of the system matrix can clearly be demonstrated. To this end, we want to compare both matrices for the setup explained in the foregoing with N = 9 so that has a condition number of 3.5 and a condition number of 20.2.
First, we evaluate the influence of background noise. For this purpose, we assume a constant noise added to each superposition x, which is linearly processed by the hearing aid. Consequently, we expect a constant noise added to each of the recordings of y, which is propagated as additive part to the separated signals . Due to the matrix-vector multiplication, the noise is weighted with the entries of and then all entries of one row are added. If we assume the noise sources to be incoherent, the sum of squares of the rows of allows us to determine the propagation of the noise into the separated signals. If we compare the propagation of background noise of and , we can notice that this factor is constant for all separated signals for but varies for . If we compare the value for each signal , we see that for the propagation of background noise to the separated signals is in the range of 3.5 dB to 12.5 dB higher than for . Furthermore, in this experiment, we also have a look at the successive approach in which pairs of signals are processed. Although we need one more measurement for the successive approach, the propagation of background noise to the separated signals is about 3.7 dB higher compared with the more efficient approach using . However, if we process the data from the successive approach in the way of the more efficient approach, we can improve the robustness against background noise. For this purpose, we consider all the measurements taken for the successive approach jointly as the result of a single matrix-vector model leading to an overdetermined system of equations. The system matrix would have the size (here 10 × 9) and it would look like the negative of , extended by a row of ones. This overdetermined system of equations could be solved by computing the pseudoinverse. If we now analyze the propagation of background noise for this case, we see almost no difference compared with . This clearly demonstrates the benefit of using a linear system of equations instead of the successive approach.
Second, we would like to evaluate the effect of a sensitivity drift. For this evaluation, we assume that the sensitivity of the microphone of the ear simulator linearly changes between −2 dB to +2 dB. For this experiment, we simply weighted each entry of x differently so that with . The gain factors ki were varied linearly between −2 dB and +2 dB. This means that we did not perform any measurement and did not consider sensitivity drifts during a measurement. When we compute with the emulated sensitivity drift, we can notice that the signals are not perfectly separated anymore. To evaluate the effect of this error, we computed for both system matrices. In the ideal case, would be zero and for , we get an error of −1.88 dB and for an error of 0.05 dB.
To shortly conclude, the analyses of the impact of background noise and the impact of a sensitivity drift of the ear simulator both show that using a system matrix with a lower condition number is more robust against tolerances and interferences. Certainly, a direct estimation of the influence of any source of error is not possible by looking at the condition number, only. However, it demonstrates that the condition number is a reasonable parameter to evaluate the robustness of the system matrix against interferences and tolerances. Moreover, the experiment with the propagation of the background noise clearly demonstrates that the successive approach is not only less efficient but also less robust against background noise.
Negative system matrix
As another check, the measurement was performed two times, once with and once with , for noise reduction and directional microphones being activated. The basis for the phase inversion method is the assumption that the sign or phase of a signal does not affect the signal processing carried out by the hearing aid. Consequently, if we determine with positive () or negative () system matrix, the result should be the same. As a check, the one third octave levels of the results are compared with each other in Figure 3. For frequencies below approximately 130 Hz, the results for the reference microphone and the hearing aid show differences of up to 3 dB. This could be the effect of background noise. For higher frequencies, the reference microphone shows almost no difference, whereas the signals processed by the hearing aid show differences in the range of ±1 dB for frequencies above 1.1 kHz. These results confirm that the sign or phase of a signal does not significantly affect the signal processing of the hearing aid. Nevertheless, for the measurement setup and hearing aid considered, frequency-dependent tolerances of up to 3 dB can be noticed.
Results
For the analysis of signals recorded at the output of the hearing aid, an increase in SNR means that the hearing aid has reduced the noise. Hence, if we depict the difference in SNR () in a polar plot, the curves have the inverse characteristic of typical directional microphones. To avoid this and to resemble the typical directivity patterns, the negative SNR differences are depicted in Figure 4. The four curves correspond to the different hearing aid settings, and all curves are linearly interpolated between the eight directions (, … , ). In addition, it is important to mention that all changes in SNR are results of a technical measurement, and listening tests with humans may lead to different results. This means that a gain in SNR not necessarily leads to higher speech intelligibility, reduced listening effort, and so forth.
The curve for deactivated noise reduction and omnidirectional microphone is almost zero for all directions, which is in agreement with the expectations (see solid line in Figure 4). The results for an activated noise reduction and an omnidirectional microphone setting show a gain in SNR independent of the direction (see dashed line in Figure 4). This is also as expected, because the noise reduction works in the temporal or frequency domain and not in the directional domain. If the directional microphone is turned on, a gain of SNR dependent on the direction of the noise can be noticed (see dashed-dotted line). As the SNR is almost zero at and lowest at without a notch, the directional microphone may have a subcardioid characteristic. In addition, if the noise reduction as well as the directional microphone are activated, the maximum increase in SNR of approximately 8 dB can be recognized at (see dotted line). However, the overall SNR (i.e., ) is lower, since the noise from other directions is not reduced in the same way as from . In Figure 5, the change in the overall SNR is depicted for all four settings. A maximum increase in the overall SNR of approximately 6 dB is reached when the noise reduction as well as the directional microphone are activated.
Conclusions
In this work, it is shown how the phase inversion method, presented by Hagerman and Olofsson (2004), can be used to separate more than two signals. To this end, first, an approach was presented which successively groups the signals so that the basic phase inversion method can be applied. Second, a more efficient approach was introduced where the phase inversion method is described in a general way with a linear system of equations as matrix-vector multiplication. In this general form, the method can be extended from two signals to an arbitrary number of N signals. One challenge is to define an appropriate system matrix for N > 2. Here, the use of a Hadamard matrix is recommended, if possible, that is, if with . Moreover, for all other cases, a general way to build a system matrix is presented. This matrix has a condition number of κ = 2 for N = 3 and for N > 3. Hence, the condition number increases with N for N > 4, so that the robustness against measurement tolerances decreases. However, a brute-force search for shows that for these sizes, this type of matrix has the lowest condition number possible. Moreover, for N = 4, it is a Hadamard matrix with κ = 1. Furthermore, measurement results have been presented for N = 9, where this type of system matrix was used. The results verify the concept and demonstrate the practicability of the extended phase inversion method. In addition, the results confirm that the extended phase inversion method enables the analysis of complex acoustic environments with more than two signals. This is important to get a deeper insight into the performance of hearing aids in realistic situations with more than one speaker and one noise source.
Footnotes
Acknowledgments
The authors would like to thank all the reviewers for providing many helpful comments and suggestions. Especially the section “successive extension” has been inspired by a reviewer’s comment.
Declaration of Conflicting Interests
The authors declared no potential conflicts of interest with respect to the research, authorship, and/or publication of this article.
Funding
The authors received no financial support for the research, authorship, and/or publication of this article.
References
1.
Aubreville, M., & Petrausch, S. (2015). Directionality assessment of adaptive binaural beamforming with noise suppression in hearing aid. In IEEE international conference on acoustics, speech and signal processing (ICASSP), 19-24 April 2015. doi:10.1109/ICASSP.2015.7177962.
2.
BentlerR. A. (2005) Effectiveness of directional microphones and noise reduction schemes in hearing aids: A systematic review of the evidence. Journal of the American Academy of Audiology16: 473–484. doi:10.1177/1084713806289514.
3.
BronsI.HoubenR.DreschlerW. A. (2014) Effects of noise reduction on speech intelligibility, perceived listening effort, and personal preference in hearing-impaired listeners. Trends in Amplification18: 2331–2165. doi:10.1177/2331216514553924.
4.
ChungK. (2004) Challenges and recent developments in hearing aids: Part I. Speech understanding in noise, microphone technologies and noise reduction algorithms. Trends in Amplification8(3): 83–124. doi:10.1177/108471380400800302.
HagermanB.OlofssonA. (2004) A method to measure the effect of noise reduction algorithms using simultaneous speech and noise. Acta Acustica United With Acustica90(2): 356–361.
7.
HadamardJ. (1893) Résolution d’une question relative aux déterminants [Resolution of a question on determinants]. Bulletin des Sciences Mathématiques70: 240–246.
8.
Harries, T. (2010). Untersuchung der Perzentilanalyse und Messungen von Funktionselementen nicht linearer Hörgeräte mittels dieser Methode [Evaluation of the percentile analysis and investigation of non-linear hearing aid features using this method] (Undergraduate thesis), University of Applied Sciences, Lübeck.
9.
Holube, I., Fredelake, S., & Hansen, M. (2006). Subjective and objective evaluation methods of complex hearing aids. In 8th Congress of the European federation of audiological societies (EFAS) as a joint meeting with the 10th congress of the German society of audiology (DGA), Heidelberg, Germany, 6-9 June 2006.
10.
HolubeI.FredelakeS.VlamingM.KollmeierB. (2010) Development and analysis of an International Speech Test Signal (ISTS). International Journal of Audiology49(12): 891–903. doi:10.3109/14992027.2010.506889.
11.
HoradamK. J. (2007) Hadamard matrices and their applications, Princeton, NJ: Princeton University Press.
12.
IEC 60118-15 (2012) Electroacoustics - Hearing aids - Part 15: Methods for characterising signal processing in hearing aids with a speech-like signal (IEC 60118-15), Geneva, Switzerland: Author.
13.
RickettsT. (2000) Impact of noise source configuration on directional hearing aid benefit and performance. Ear & Hearing21(3): 194–205.
14.
SarampalisA.KalluriS.EdwardsB.HafterE. (2009) Objective measures of listening effort: Effects of background noise and noise reduction. Journal of Speech, Language, and Hearing Research52(5): 1230–1240. do:10.1044/1092-4388(2009/08-0111).