
Abstract
The aim of this study was to evaluate the effectiveness of a vocational enablement protocol (VEP) on need for recovery (NFR) after work as compared with usual care for employees with hearing difficulties. In a randomized controlled trial design, 136 employees with hearing impairment were randomly assigned to either the VEP or the control group. VEP is a multidisciplinary program integrating audiological and occupational care for individuals experiencing difficulties in the workplace due to hearing loss. The primary outcome measure was NFR. Secondary outcome measures were communication strategy subscales (e.g., self-acceptance and maladaptive behavior), distress, and self-efficacy. Data were collected using questionnaires at baseline and at 3, 6, 9, and 12 months follow-up. No significant difference over the complete follow-up period was found between the intervention and control group for NFR. However, we observed a significant difference for one of the secondary outcomes after 12 months. “Self-acceptance” increased significantly in the VEP group, compared with the controls. The mean difference between the two groups was small, being only 0.24 (95% CI [0.04, 0.44]) on a scale of 1 to 5. The results do not support the use of VEP if the aim is to reduce NFR after work at 12 months follow-up. It may be that NFR does not adequately capture what is covered in the VEP. Although marginal, the effect on self-acceptance was significant. This is encouraging given that positive effects on self-acceptance have rarely been shown for audiological rehabilitation programs. Suggestions for further improvement of the VEP are discussed.
Keywords
Introduction
Hearing loss is ranked among the top 20 prevalent health problems in high-income and middle-income countries worldwide and is projected to be in the top 10 of burden of disease in 2030 (Mathers & Loncar, 2006; World Health Organization, 2008). According to the World Health Organization (WHO), about 62 million people worldwide 59 years of age and younger have moderate to severe disability levels of hearing loss (World Health Organization, 2008). This number indicates that hearing loss not only affects people at an older age but also many people who are younger and may still be active in the workforce. Hearing difficulties at the workplace will become more common in the foreseeable future due to the growth of the elderly population and the larger number of adults who continue to work at a higher age (Kramer & Gussenhoven, 2013).
Previous studies have shown that hearing difficulties often have adverse consequences for an individual’s occupational performance and well-being. Examples of such consequences are embarrassment, lower self-efficacy, fear, distress, loss of control, negative coping, and lack of energy (Helvik, Jacobsen, & Hallberg, 2006; Mokkink, Knol, Zekveld, Goverts, & Kramer, 2009; Morata et al., 2005; Nachtegaal et al., 2009; Ringdahl & Grimby, 2000). This may even be observed in people with mild degrees of pure tone hearing loss (Kramer, Kapteyn, & Houtgast, 2006).
Need for recovery (NFR) is an important factor influencing an employee’s well-being. It is the degree to which he or she is able to recover from fatigue and stress at work (Jansen, Kant, & van den Brandt, 2002). Meijman and Mulder’s (1998) model suggests that exploited effort during the day results in an array of emotional, cognitive, and behavioral symptoms that constitute short-term fatigue from work. Recuperation usually occurs within the same working day or the following night. When someone fails to recuperate from a working day within 24 h, NFR may accumulate to hazardous levels. Research has demonstrated that high levels of NFR can be seen as an early precursor for developing subjective health complaints and sick leave absence in the longer term (de Croon, Sluiter, & Frings-Dresen, 2003).
The NFR scale is now widely used in occupational health care where it is considered an important intermediate factor between job demands and mental and physical illness caused by work in the long term (de Croon et al., 2003). Nachtegaal et al. (2009) were the first to use this scale in the context of audiology. They observed that poorer hearing ability was associated with increased levels of NFR.
The usual care provided by experts in audiology for employees with hearing difficulties is mostly restricted to the assessment of hearing and the provision and fitting of hearing aids (Jennings & Shaw, 2008). However, even with well-fitted hearing aids, many people with hearing loss may continue to experience communication and coping difficulties at work (Chisolm, Abrams, & McArdle, 2004; Jennings, Shaw, Hodgins, Kuchar, & Poost-Foroosh Bataghva, 2010). Chisolm et al. (2004) and Backenroth, Wennberg, and Klinteberg (2003) recommended referring adults with hearing impairment to additional audiological rehabilitation or counseling interventions to help them cope with an increasingly demanding work life. However, a recent systematic review on the availability and effectiveness of vocational rehabilitation programs for employees with hearing difficulties showed that only a limited number of such audiological interventions were developed over the last 30 years (Gussenhoven et al., 2013). One of these programs is the Vocational Enablement Protocol (VEP) developed in the Netherlands (Kramer, 2008).
The VEP aims to address the specific needs of those who are occupationally involved and who report restrictions at work due to their hearing loss. Special features of the VEP are (a) the multidisciplinary approach involving professionals in occupational and hearing health care (i.e., audiologist, psychologist or social worker, and clinical occupational physician [OP]) in assessing the auditory function and personal and work-related factors and (b) the integrated approach that aims at audiological and occupational improvements. Even though the VEP was received positively by patients and regarded as a step forward in the vocational rehabilitation of employees who experience hearing difficulties (Gussenhoven et al., 2015; Kramer, 2008), no empirical evidence is yet available on the effectiveness of this vocational rehabilitation program. The aim of the present study was therefore to determine whether the VEP could reduce NFR as the primary outcome for employees with hearing difficulties at 12 months follow-up compared with usual care. Secondary outcomes were the changes in communication strategies, personal adjustment, self-efficacy, and distress level.
Materials and Methods
Study Design
The study was a randomized controlled trial (RCT). To recruit participants, information leaflets were distributed in companies, organizations, and in our own hospital. Adult employees (≥18 years) experiencing hearing difficulties and restrictions at work due to their hearing loss were invited to participate in the study. The leaflet included a link to an online application form, which is further referred to as the Hearing and Distress Screener (HDS). This screener included four questions addressing the individual’s self-experienced level of distress at work and the measurement of an individual’s hearing ability. For the latter, the National Hearing Test, an adaptive digit-triplet test in noise (Smits, Kapteyn, & Houtgast, 2004; Smits, Merkus, & Houtgast, 2006), was used. The National Hearing Test score is the average signal-to-noise ratio (SNR) at which 50% of the digit triplets are recognized correctly and is further referred to as the Speech-Reception-Threshold in noise (SRTn). Further details of that screener are published elsewhere (Gussenhoven et al., 2012). Inclusion criteria for the study were (a) paid work for at least 8 h a week, (b) ability to complete Dutch questionnaires, (c) a signed written informed consent, and (d) ability to participate in the study for the entire follow-up period. Exclusion criteria were (a) tinnitus as the primary condition affecting the individual’s hearing, (b) having already received the VEP during the past 12 months, (c) pregnancy, and (d) being unwilling or unable to comply with the VEP. The Medical Ethics Committee of the VU University Medical Center Amsterdam approved the study design and procedures. More details on the study design, recruitment of participants, and methods have been described elsewhere (Gussenhoven et al., 2015; Gussenhoven et al., 2012).
Randomization, Blinding, and Sample Size
Participants who consented to participate were prestratified by two factors: (a) requirement of hearing protection at the workplace (yes or no) and (b) self-rated level of distress based on the questions of the “Hearing and Distress Screener” (high or low level of distress; Gussenhoven et al., 2012). The participants were individually randomized to either the intervention (i.e., VEP) or control group (usual care). We used four-block randomization to ensure equal group sizes within each stratum and for practical reasons. An independent statistician prepared a randomization schedule by using computerized random numbers. Due to the nature of the intervention, the intervention providers and participants could not be blinded. The calculation of our sample size was based on previous research (de Croon, Sluiter, & Frings-Dresen, 2006) and is described in Gussenhoven et al. (2012). The planned sample size was set at 63 persons in each group, which allows a detection of an effect size of 0.5 after 12 months on the primary outcome measure NFR with a two-sided Type I error of 0.05 and a power of 80%. Further details of the participants in both groups are provided in the Results section.
Control and Intervention Conditions
The VEP is a comprehensive, multidisciplinary program of care that includes vocational and audiological components. In the Netherlands, employees can be referred to the VEP by their own OP or another health-care giver (e.g., their ENT physician). The protocol consists of eight key elements: (a) a questionnaire addressing the worker’s difficulties at the workplace, including his or her ability to cope with hearing loss; (b) Standard pure-tone and speech audiometry as well as speech-in-noise tests to assess auditory functioning; (c) A semi-structured intake interview with the participant conducted by the psychologist or social worker and clinical OP of the team; (d) A multidisciplinary team meeting in which the possibilities of technical, acoustical, speech-therapeutic, psychosocial and vocational interventions, and options for workplace modifications are discussed; (e) Test results, recommendations, and instructions are explained to the participant; (f) A comprehensive written report, including recommendations for the participant and the management plan sent to the employee’s OP; (g) Telephone contact between the clinical OP of the team and the employee’s own OP, who in turn informs the employer about the findings and supervises the actual implementation of the recommendations; (h) An informative CD, given to the employee, about how to deal with hearing difficulties at the workplace. The content of the intervention has been described in detail elsewhere (Gussenhoven et al., 2013; Kramer et al., 2006).
Employees allocated to the control group received audiological care as usual. They were permitted to seek and receive any kind of audiological rehabilitation with the exception of the VEP. In the Netherlands, the usual pathway to seek help for hearing problems starts with a visit to a general practitioner followed by a referral to an Audiology or ENT clinic. Adults may also go directly to a hearing aid dispenser.
Outcome Measures
In this study, we investigated the effectiveness of the VEP. The primary outcome was NFR. Secondary outcomes were communication strategies, personal adjustment, distress, and self-efficacy (described later). Data for all outcome measures were collected via online questionnaires. The baseline measurement (T0) took place before randomization. Follow-up measurements were performed 3 months (T1), 6 months (T2), 9 months (T3), and 12 months (T4) after baseline measurement. Note that not all of the outcome measures were gathered at all time points. Due to the time constraints, we collected data as follows: the primary outcome (NFR) was measured at all time points; communication strategies were measured at T0, T1, T2, and T4; and distress level and self-efficacy were measured at T0, T2, and T4.
Need for recovery
NFR was assessed using an 11-item dichotomized subscale (yes or no statements) of the VBBA (Dutch questionnaire on Experience and Assessment of Work), which has been shown to be valid and reliable (Cronbach’s alpha of 0.87; de Croon et al., 2006; van Veldhoven, M., & Meijman, T. F., 1994). An example of a statement is: “When I get home, people should leave me alone for some time.” According to the instructions of the developers, the total score was calculated and converted as follows: Individual scores on the 11 (yes or no) items were first recoded with positive outcomes coded 1 and negative outcomes coded 0. Then the scores were summed, divided by the total number of items (11), and then multiplied by 100, resulting in a total score ranging from 0 to 100, with higher scores indicating higher levels of NFR (van Veldhoven & Meijman, 1994).
Broersen, Fortuin, Dijkstra, van Veldhoven, and Prins (2004) identified risk categories for NFR and demonstrated that respondents with an NFR score of ≥54.5 have a higher risk for occupational diseases such as burnout and psychological problems than people with a score <54.5. At this cut-off point of 54.5, sensitivity and specificity of the scale are 79% and 72%, respectively (Broersen et al., 2004).
In the current study, we determined both the change in the continuous NFR score (0 to 100) and the change in the prevalence of high NFR (NFR score ≥54.5) in the two groups during the 12 months follow-up period.
Communication strategies and personal adjustment
Six subscales of the Dutch version of the Communication Profile for the Hearing Impaired (CPHI; Demorest & Erdman, 1987; Mokkink, Knol, van Nispen, & Kramer, 2010) were used to assess coping with hearing loss. The Dutch CPHI scales have proven to be reliable, valid, and feasible to assess coping with hearing loss (Mokkink et al., 2009; Mokkink et al., 2010). The six subscales were (a) “use of maladaptive behaviors” addressing behaviors that might negatively influence effective communication (e.g., pretending to understand or avoid situations or places), (b) “verbal strategies” (e.g., asking for repetition or speaking openly about the hearing problem), (c) “nonverbal strategies” (e.g., seeking out places where the opportunity to hear is optimal), (d) “stress and withdrawal” (e.g., discomfort in relation to communication difficulties and feelings of isolation), (e) “self-acceptance” (e.g., having negative feelings toward oneself as a consequence of hearing loss), and (f) “acceptance of hearing loss.” The six scales covered a total of 35 items, each with a 5-point Likert response scale, with either a frequency continuum or an agree-disagree continuum, depending on the content of the item. Responses were (re)coded into 1 (most unfavorable) to 5 (most favorable outcomes). Items for each subscale were averaged with higher scores indicating a better outcome.
Distress
The subscale of the Four-Dimensional Symptom Questionnaire (Terluin et al., 2006) was used to assess distress. It includes 16 items, each with a 5-point Likert response scale; no, sometimes, regularly, often, and very often or constantly. An item example is “During the past week, did you feel easily irritated?” Answers were recoded into 0 (no), 1 (sometimes), and 2 (remaining categories) with summed distress scores ranging from 0 (most favorable) to 32 (most unfavorable). The Four-Dimensional Symptom Questionnaire has proven to be a reliable and valid instrument for use in the Netherlands with high internal consistency (Cronbach’s Alpha’s of the distress scale 0.90; Terluin et al., 2006).
Self-efficacy
Self-efficacy was measured using the 12-item general self-efficacy scale. An item example is “if something looks too complicated, I will not even bother to try it.” Response categories ranged from 1 (totally agree) to 5 (totally disagree) with summed scores ranging from 12 (most unfavorable) to 60 (most favorable). Bosscher and Smit (1998) showed that the general self-efficacy scale is a reliable and valid instrument for use in the Netherlands.
Potential Confounders
As it is likely that sociodemographic variables such as age, sex, and level of education (highest completed education: “low”: elementary school or less, “intermediate”: secondary education, and “high”: college or university) affect the outcomes of interest in this study (Stam, Kostense, Festen, & Kramer, 2013), we examined whether these variables were potential confounders. They were collected at baseline. Additional potential confounders that we examined were as follows: average SRTn, subjective hearing score (“give your hearing performance a score between 1 and 10 in which 1 is ‘bad’ and 10 is ‘good’”), self-reported hearing difficulties at the workplace (“no,” “sometimes,” “regularly”), type of contract (fixed or temporary contract), and number of working hours.
NFR in employees with hearing impairment is associated with an imbalance between job demands and job control (Jansen et al., 2002). Therefore, these factors and other work-related psychosocial risk factors were examined for potential confounding and assessed using the Job Content Questionnaire (Karasek et al., 1998). It comprises 22 items on a 4-point response scale (from totally disagree to totally agree). By combining items, the following dimensions were constructed and examined as potential confounders; “decision latitude” (i.e., a combination of “skill discretion” and “decision authority”), “psychosocial job demands,” and “social support” (i.e., “supervisor- and co-worker support”). A higher score indicated a better outcome.
Statistical Analyses
All analyses were performed according to the intention-to-treat principle. To determine whether randomization was performed successfully, descriptive statistics (using the Student’s t test for continuous variables and χ2-tests for dichotomous and categorical variables) were used to compare the baseline measurements of both groups. The NFR data distribution was slightly positively skewed, due to the high number of participants scoring the minimum score of 0–20 (26%). As ANOVAs are less suitable for analyses based on different number of responses per time point and because Linear Mixed Models (LMMs) are fairly robust for nonnormal data distributions (Arnau, Bono, Blanca, & Bendayan, 2012), we used mixed models to evaluate the intervention effects for the outcome variables over time. Using mixed models, all available data are included in the analysis and not only those subjects with a complete dataset. LMMs were used to evaluate the effects for the continuous outcomes (i.e., NFR, the communication strategy subscales, distress, and self-efficacy). Generalized LMMs with a logit link function were used to assess the effects for the prevalence of high NFR (NFR score ≥ 54.5). To adjust for correlations of data across different time points, we chose “variance components” in the LMMs and “independent” covariance matrices in the logistic mixed models, respectively (see also Verbeke & Molenberghs, 2000).
For each outcome variable, two analyses were performed. First, for the main analyses, mixed effect models were fitted (i.e., the difference between intervention and control group at the relevant follow-up moments) with fixed effects for group, time, and their two-way interaction (i.e., Group × Time) and a random intercept for subjects. Second, adjusted analyses, encompassing a model as described earlier but adjusted for the potential confounders, were performed. We identified a variable as a confounder if all of the following criteria were met: (a) the covariate was associated with the outcome measure, (b) there was a statistically significant difference between the groups for the confounder at baseline, and (c) the beta of the intervention variable changed by more than 10% after addition of the covariate to the model.
Additionally, we performed “per protocol” analyses. Per-protocol analysis is a comparison of groups that includes only those patients who completed the intervention originally allocated. Thus, in the per-protocol analyses, only those participants who had actually visited the audiology clinic and participated in the VEP were included in the intervention group and compared with the control group.
For all analyses, the intervention effect of interest was the interaction between group and measurement time (i.e., Group × Time; Fitzmaurice, Laird, & Ware, 2004). We considered a p value of <.05 to be significant. All data were analyzed with IBM SPSS statistics version 20 for Windows (SPSS, Chicago, IL, USA).
Results
Participants
Figure 1 outlines the complete flow of the participants through the study. A total of 136 employees signed an informed consent form and were randomly assigned to the intervention group (n = 68) or to the control group (n = 68). At 6-month follow-up, 126 participants completed the questionnaire and the number of respondents with complete data at 12-month follow-up was 119. In all, 115 participants (85%) provided data at all five measurement moments. The main reasons provided for loss-to-follow-up at one or more measurement moments were participant’s lack of time or “personal reasons.” One participant in the intervention group refused to visit the audiology clinic to participate in the VEP due to the travel distance to the clinic; a second participant refused due to loss of interest in the study.
Flow diagram of the participants through the phases of the randomized controlled trial.
Baseline Characteristics Per Study Group.

Note. dB SNR: Decibel Signal-to-Noise Ratio; SRTn: Speech-Reception-Threshold in noise. Values are presented in means with SD, unless stated otherwise. Significant difference between intervention and control group (p ≤ .05) are printed in bold font. * higher scores indicate a better self-reported hearing status.
Outcome Measures at Baseline and After 3, 6, 9, and 12 Months Follow-Up
Mean Scores and Standard Deviations of Need for Recovery, Communication Strategy Subscales, Distress, and Self-Efficacy at Baseline (T0), Follow-Up at 3 Months (T1), 6 Months (T2), 9 Months (T3), and 12 Months (T4) for the Intervention and the Control Group.

Note. C: control group; I: intervention group. For the communication strategy subscales and self-efficacy, higher scores were more favorable. For need for recovery and distress, lower scores were more favorable. :Outcome variable was not measured in the follow-up questionnaire.
Intervention Effect on NFR, Communication Strategies, Distress, and Self-Efficacy
Estimated Intervention Effects of Need for Recovery, Communication Strategy Subscales, Distress, and Self-Efficacy After 3 Months (T1), 6 Months (T2), 9 Months (T3), and 12 Months (T4): Results From the Main Analyses With Linear Mixed Effect Models.
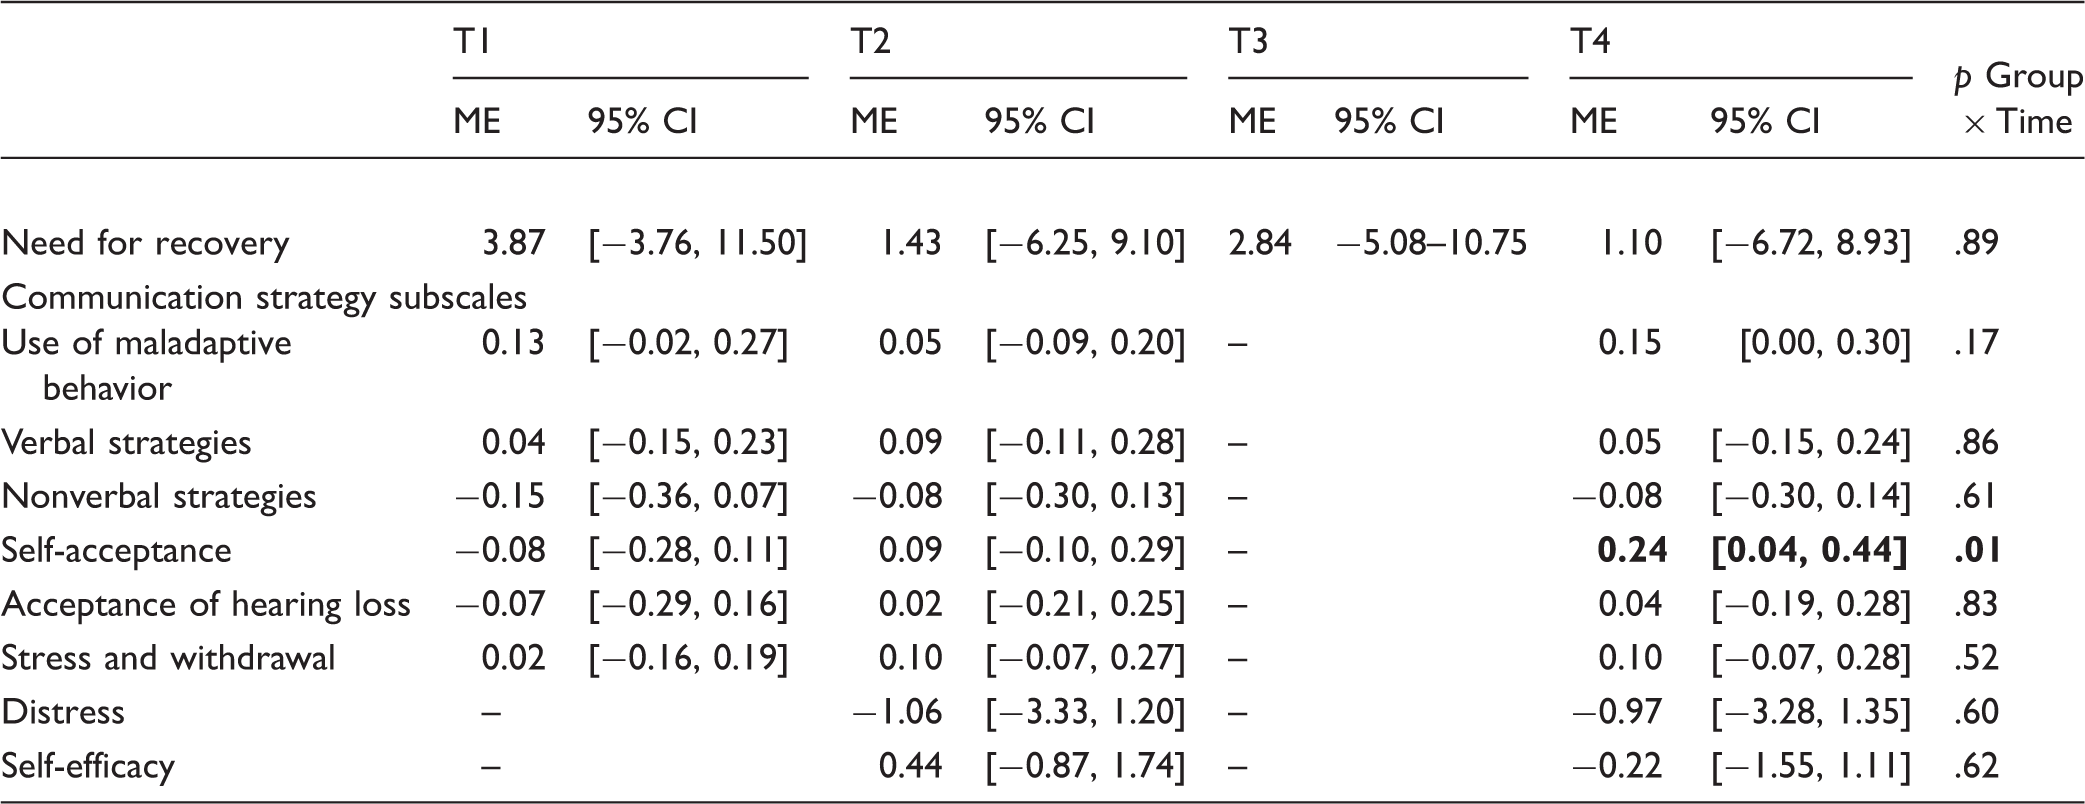
Note. ME: mean estimated mixed model effect. For the outcomes communication strategy subscales and self-efficacy, a positive ME means a difference in favor of the intervention group compared with the control group after follow-up measurement. For the outcomes NFR and distress, a negative ME is in favor of the intervention group compared with the control group after follow-up measurement. Significant intervention effects (p ≤ .05) are printed in bold font. : Outcome variable was not measured in the follow-up questionnaire.
There was no significant overall intervention effect for NFR (p = .89). We observed a significant overall effect of the VEP for the communication strategy subscale “self-acceptance” (p = .01). Employees in the intervention group showed a slight improvement on self-acceptance at 12-month follow-up compared with those in the control group. The mean difference between the two groups was 0.24 (95% CI [0.04, 0.44], p = .02), on a scale of 1 to 5. No significant differences were found for the other five communication strategy subscales, for distress, or for self-efficacy.
Intervention Effect on the Prevalence of High NFR
In addition to examining the differences in NFR (previous paragraph), we also investigated the difference between groups in the occurrence of high NFR (NFR score ≥ 54.5). Figure 2 presents the descriptives of high NFR. The prevalence rates changed from 52.9% at T0 to 40.0% at T4 in the intervention group and from 44.1% at T0 to 47.5% at T4 in the control group. Table 4 shows the results of the logistic mixed effect model for the prevalence of high NFR. Intervention effects are expressed in odds ratios. Neither a significant overall intervention effect (p = .23) nor an intervention effect at any of the time points (i.e., after 3, 6, 9, or 12 months) was found for the prevalence of high NFR.
Prevalence of high need for recovery (NFR) at baseline (T0), follow-up at 3 months (T1), 6 months(T2), 9 months (T3), and 12 months (T4) for the intervention and control group. NFR: Need For Recovery; VEP: Vocational Enablement Protocol. Estimated Intervention Effects of the Prevalence of High Need for Recovery After 3 Months (T1), 6 Months (T2), 9 Months (T3), and 12 Months (T4): Results From the Main Analyses With a Logistic Mixed Effect Model. Note. OR: odds ratio. An OR smaller than 1 indicates that the odds for high need for recovery (NFRscore ≥ 54.5) is lower in the intervention group compared with he control group after follow-up measurement.

Outcomes of the Adjusted Analyses and “Per Protocol” Analyses
We tested whether the potential confounders influenced our analyses, but none of these factors were identified as confounders. Therefore, further analysis using corrected mixed models was not required.
In the per-protocol analyses, participants who had actually visited the audiology clinic and participated in the VEP were included in the intervention group (N = 66) and compared with the control group (N = 68). See also Figure 1. The results of the per-protocol analyses did not differ from the intention-to-treat analyses results. The mean difference between the two groups in self-acceptance was slightly larger in the per-protocol analysis than in the intention-to-treat analysis: 0.26 (95% CI [0.07, 0.46], p = .01).
Discussion
To our knowledge, this is the first prospective randomized controlled trial evaluating the effectiveness of a vocational enablement program for employees with hearing difficulties. We did not find a significant effect of the VEP for the primary outcome measure of this study (NFR) and failed to find an effect for the vast majority of the secondary outcomes. We found a significant positive effect of the VEP for one subscale of the CPHI after 12 months follow-up. In the intervention group, self-acceptance increased significantly but marginally.
We can think of several explanations for the absence of a significant effect of the VEP on NFR. The most plausible one is related to the distribution of NFR scores in the samples at the time of inclusion. At baseline, 26% of the participants had NFR scores ranging from 0% to 20%. We regard these scores as being low, based on a study by Van Veldhoven and Broersen (2003) who demonstrated that the mean NFR score of a representative group of 68,775 workers in the Netherlands was 27.3%. A relatively large group of participants with scores within the range of 0% to 20% may indicate that we had a floor effect and this may have prevented us from finding a significant reduction in NFR. To further verify this, we examined NFR scores of a regular clinical sample of employees referred to the VEP. This sample is described in Kramer et al. (2008). The baseline mean NFR in that sample (n = 87) was remarkably higher (mean: 64; SD = 33, data not shown) compared with the baseline NFR of our study participants (mean: 46; SD = 31). The level of NFR at baseline seems thus a critical measure to identify candidates who should be referred to the VEP. For our study, eligibility was based on the HDS. This is a quick screener. It contains only five items (see Gussenhoven et al., 2012). The quick HDS was chosen to reduce burden and inconveniences to the participants. Having set a minimum score on the NFR scale a priori additional to or instead of the HDS might have prevented us from finding a floor effect. This is an issue that should be considered in future studies and in clinical practice when designing referral pathways for the VEP in the future. We hypothesize that the success of this intervention would have been larger if employees with a higher NFR had been included in this study.
Another explanation for the lack of an effect is the modest implementation rate of the advice provided in the VEP. In our previous article, we presented the data of a qualitative study that was conducted in conjunction with this RCT (Gussenhoven et al., 2015). This process evaluation of the VEP revealed that after 6 months, approximately one third (29%) of the total advice and instructions were perceived by the participants as being implemented (Gussenhoven et al., 2015). This relatively low percentage may have diminished the effect on the outcomes in this study. The study of Nachtegaal, Festen, and Kramer (2012) underlines the importance of social support at the workplace for people with reduced hearing ability. Results of that study indicated that among people experiencing little social support, the self-rated absolute productivity declined slightly with poorer hearing ability in noise. Closer contact with relevant stakeholders at the workplace or return visits to the clinic could have improved compliance with the recommendations given and thereby improved study outcomes. The introduction of a case manager in the VEP may be considered as a potentially useful addition to improve compliance with the recommendations given and thus to improve the effectiveness of the VEP. A case manager is held responsible for the coordination and implementation of recommendations and communication between all stakeholders at the workplace and in health care. In studies focusing on a multidisciplinary intervention for patients with hand eczema (van Gils et al., 2012) and chronic low back pain (Lambeek, van Mechelen, Knol, Loisel, & Anema, 2010), a case manager is described.
However, the absence of an effect for NFR could also indicate that this measure may not have adequately captured what is covered in the VEP (see also Bentler & Kramer, 2000). This brings us to the positive effect found for the secondary outcome self-acceptance. A qualitative study by Detaille et al. (2003) showed that increased self-acceptance was one of the most important needs of employees with hearing impairment to be able to continue working with their disability. Self-acceptance is seen as the basis for the employees’ willingness to recognize and accept limitations at work associated with their hearing loss. It refers to an individual’s feeling about himself and involves awareness of one’s strengths and weaknesses (Shepard, 1979). Lower levels of self-acceptance are associated with greater likelihood to conceal or “mask” an experienced stigmatized identity in the workplace (Spiegel, De Bel, & Steverink, 2016). Southall et al. (2011) emphasized the need for audiological rehabilitation programs that address identity management strategies specific to concealing and disclosing hearing loss in the workplace. Usual care does not seem to improve self-acceptance, at least not as much as the VEP does. Similarly, other types of rehabilitation in audiology appear to be rarely effective with regard to enhancing an hearing impaired individual’s self-acceptance (Barker, Mackenzie, Elliott, Jones, and de Lusignan, 2016; Chisolm et al., 2004; Hawkins, 2005). In that respect, the result of the current study may be considered unique and encouraging.
It must be noted, however, that the positive effect on self-acceptance was small. We observed a change of 0.24 points on the self-acceptance scale ranging from 1 to 5. To the best of our knowledge, there is no information in the literature available about the minimal clinically important change (MIC) for each of the CPHI subscales separately. Demorest & Erdman (1988) reported a MIC of 0.92 for the Verbal Strategies scale. If we adopt this value as the MIC for all subscales, a change of 0.24 cannot be considered clinically relevant. Because integrating hearing loss into one’s life may take years (Herth, 1998), it may be that the process of self-identity and behavior change takes longer than 12 months and that a longer follow-up period is needed to observe additional benefits from the VEP. This may also be the case for the effect on NFR. As shown in Figure 2, the prevalence of high NFR decreased to 40% at T4 in the intervention group. Although not significant, we speculate that this trend in the intervention group would have continued if we had chosen an even longer follow-up period (see also next paragraph). Future research may address this issue.
Strengths and Limitations of the Study
Some limitations of this study need to be discussed. Although the number of participants’ loss to follow-up was minimal (15%), selection bias cannot be ruled out. This study may have resulted in a selection of the more motivated participants in the study. Second, due to the nature of the intervention, it was not possible to blind the participants and professionals of the multidisciplinary team. The third concern is the limited statistical power for the secondary outcomes (e.g., self-acceptance). We chose to base the sample size calculation on the number of participants needed to identify an effect on the primary outcome (NFR) at 12 months and not on the other outcome measures (i.e., communication strategies, distress and self-efficacy). Using a larger sample size would have diminished the confidence intervals and might have led to statistically significant intervention effects. As mentioned, relevant intervention effects may have been found if a longer follow-up period had been chosen or if the participants had experienced a higher NFR at baseline.
One major strength is that this study is the first one prospectively examining the effectiveness of a VEP for employees with hearing difficulties in a randomized controlled trial design, which is the most reliable design for intervention studies (Hulley, Cummings, & Browner, 2007). The second strength is the longitudinal follow-up of 12 months, making it possible to evaluate the intervention on different time intervals. This is quite unique compared with other studies on the efficacy of interventions for people with hearing loss (Collins, Liu, Taylor, Souza, & Yueh, 2013; Maes, Joore, Cima, Vlaeyen, & Anteunis, 2011; Ringdahl & Grimby, 2000). Owing to the broad inclusion criteria, the effectiveness of the VEP was evaluated in employees with a variety of hearing difficulties from a range of work sectors. For this reason, the external validity of the study results can be considered reasonable.
Conclusions
As it is expected that hearing difficulties in the workplace will become more common in the future, interventions to support employees with hearing difficulties in the workplace may become more important. The VEP is an example of such an intervention. This study did not show an effect of the intervention for the primary outcome (NFR). This measure may not have adequately captured what is covered in the VEP. It is also possible that the considerable proportion of participants (26%) with low (optimal) NFR scores at baseline may have prevented us from seeing the full potential of the intervention. Although the significant effect on self-acceptance was marginal, the result is encouraging given that positive effects on self-acceptance have rarely been shown for audiological rehabilitation programs. Future research should determine if particular elements could be omitted or should be added to the VEP to improve its effectiveness.
Footnotes
Declaration of Conflicting Interests
The authors declared the following potential conflicts of interest with respect to the research, authorship, and/or publication of this article: Kramer and Goverts were each involved in this study in potentially conflicting roles as both author and clinician. Kramer was involved as a psychologist and Goverts as an audiologist in the VEP.
Funding
The authors disclosed receipt of the following financial support for the research, authorship, and/or publication of this article: This study was funded by the Netherlands Organization for Health Research and Development (ZonMw).