
Abstract
Multiple redundant acoustic cues can contribute to the perception of a single phonemic contrast. This study investigated the effect of spectral degradation on the discriminability and perceptual saliency of acoustic cues for identification of word-final fricative voicing in “loss” versus “laws”, and possible changes that occurred when low-frequency acoustic cues were restored. Three acoustic cues that contribute to the word-final /s/-/z/ contrast (first formant frequency [F1] offset, vowel–consonant duration ratio, and consonant voicing duration) were systematically varied in synthesized words. A discrimination task measured listeners’ ability to discriminate differences among stimuli within a single cue dimension. A categorization task examined the extent to which listeners make use of a given cue to label a syllable as “loss” versus “laws” when multiple cues are available. Normal-hearing listeners were presented with stimuli that were either unprocessed, processed with an eight-channel noise-band vocoder to approximate spectral degradation in cochlear implants, or low-pass filtered. Listeners were tested in four listening conditions: unprocessed, vocoder, low-pass, and a combined vocoder + low-pass condition that simulated bimodal hearing. Results showed a negative impact of spectral degradation on F1 cue discrimination and a trading relation between spectral and temporal cues in which listeners relied more heavily on the temporal cues for “loss-laws” identification when spectral cues were degraded. Furthermore, the addition of low-frequency fine-structure cues in simulated bimodal hearing increased the perceptual saliency of the F1 cue for “loss-laws” identification compared with vocoded speech. Findings suggest an interplay between the quality of sensory input and cue importance.
Introduction
Multiple redundant acoustic cues can contribute to the perception of a single phonemic contrast (Repp, 1982). For example, the perception of voiced versus voiceless stop consonants (i.e., /b/ vs. /p/, /d/ vs. /t/, /g/ vs. /k/) can be signaled by either voice onset time (Abramson & Lisker, 1985) or formant transitions (Jiang, Chen, & Alwan, 2006; Lisker, 1975). However, listeners may adjust their perceptual weighting of individual cues depending on the listening condition and perceptual task. As described by Repp (1982), a trading relation is observed when changes in one cue dimension are offset by changes in another cue dimension. For example, when spectral and temporal cues are both viable cues associated with a particular speech contrast, individuals with normal hearing are likely to weight the spectral cues to a greater extent than individuals with hearing impairment (Revoile, Pickett, Holden, & Talkin, 1982) or a cochlear implant (CI) (Winn, Chatterjee, & Idsardi, 2012). Further, as the spectral quality of the signal decreases, listeners tend to rely more strongly on temporal cues than spectral cues for the perception of English phonemes (e.g., Nie, Barco, & Zeng, 2006; Xu, Thompson, & Pfingst, 2005) and Mandarin lexical tones (Xu & Pfingst, 2003), although this pattern may reverse in conditions of noise and limited audible bandwidth (Winn, Chatterjee, & Idsardi, 2013). The weighting of individual acoustic cues may also vary with listeners’ age (e.g., Mayo, Scobbie, Hewlitt, & Waters, 2003; Nittrouer, 1996; 2005; Nittrouer & Studdert-Kennedy, 1987; Wardrip-Fruin & Peach, 1984) and language experience (e.g., Broersma, 2005; 2010; Miyawaki et al., 1975; Strange, 1992; Underbakke, Polka, Gottfried, & Strange, 1988).
CI processing preserves the slowly varying temporal envelope information in the speech signal (i.e., cues related to amplitude changes over time) but provides only a coarse representation of the spectral envelope. Thus, it offers a unique opportunity to examine how listeners change their weighting strategies to emphasize the more reliable cues received through the CI over cues that are less reliable. Reduced spectral resolution could cause listeners to shift their cue weighting toward other acoustic dimensions (e.g., the temporal dimension) that, while not weighted strongly by normal-hearing listeners, are transmitted more robustly through the CI and thus are relatively more informative with CI listening (Hedrick & Carney, 1997; Iverson, 2003; Iverson, Smith, & Evan, 2003; Moberly, Lowenstein, & Nittrouer, 2016; Winn et al., 2012; Winn & Litovsky, 2015). This effect was demonstrated by Winn et al. (2012), who studied perceptual cue weights for two spectral resolution conditions (four and eight channels) using a noise channel vocoder. When spectral resolution was reduced, listeners tended to rely more strongly on temporal cues (e.g., vowel duration) than spectral cues (e.g., formant frequency) for identification of both consonant and vowel features.
Recent work by Moberly et al. (2014, 2016) demonstrated the importance of cue weighting strategy on speech recognition performance in adult CI users. An initial study systematically examined the relationship between sensitivity and cue importance for the /ba/-/wa/ contrast (Moberly et al., 2014). The /ba/-/wa/ continuum was manipulated in both time-varying spectral structure (formant rise time) and temporal structure (amplitude rise time). Subjects labeled each synthesized stimulus as /ba/ or /wa/ and completed a same or different discrimination task. Perceptual saliency for the two cue dimensions was found to vary across subjects; however, listeners’ weighting of formant rise time was related, to some extent, to their sensitivity to spectral structure. This finding suggested that sensitivity to the spectral cue is a requisite for weighting the formant rise time strongly. A similar relationship between sensitivity and perceptual saliency, however, was not observed for the temporal dimension. Importantly, Moberly et al. found that sensitivity to spectral structure did not predict speech recognition performance with monosyllabic words, whereas subjects’ weighting of spectrally based cues explained a significant proportion of variance in word recognition. This led them to emphasize the importance of cue-weighting strategies for phonemic contrast perception. In other words, absolute sensitivity is not sufficient in the linguistic domain; listeners must prioritize some dimensions when they perform sound categorization. These general findings were confirmed by later experiments with different phonemic contrasts (Moberly et al., 2016; Winn & Litovsky, 2015), further implicating the importance of weighting strategies on speech recognition.
In recent years, combined electric–acoustic stimulation with a CI, one in ear and low-frequency residual hearing in the other, known as bimodal hearing, has become more prevalent due to the relaxation of CI candidacy criteria. As mentioned earlier, CIs provide coarse spectral envelope cues, which have been demonstrated to be similar to four to eight functional spectral channels across a broad frequency range (Fishman, Shannon, & Slattery, 1997; Friesen, Shannon, Başkent, & Wang, 2001; Stickney, Zeng, Litovsky, & Assmann, 2004). In bimodal stimulation, the addition of low-frequency residual hearing improves spectral resolution in the low-frequency range, for example, below 1,000 Hz for a typical bimodal listener. It has been shown that bimodal stimulation improves performance for perceptual tasks that require fine spectral resolution, such as speech recognition in noise, tone recognition, and melody recognition (e.g., Dorman & Gifford, 2010; Dorman, Gifford, Spahr, & McKarns, 2008; Kong, Stickney, & Zeng, 2005; Li, Zhang, Galvin, & Fu, 2014). Further, it has been shown that low-frequency fine-structure cues enhance the perception of consonant voicing and manner of articulation features, and first formant (F1) frequency for vowels (Brown & Bacon, 2009a, 2009b; Carroll, Tiaden, & Zeng, 2011; Ching, van Wanrooy, & Dillon, 2007; Kong & Braida, 2011; Kong & Carolyn, 2007; Neuman & Svirsky, 2013; Sheffield & Zeng, 2012; Visram, Azadpour, Kluk, & McKay, 2012; Zhang, Dorman, & Spahr, 2010).
The purpose of the present study is to examine the effect of spectral degradation and the addition of low-frequency fine-structure cues on listeners’ discriminability and perceptual weighting of spectral and temporal cues that signal word-final voicing in “loss” versus “laws.”
The key research questions addressed by the study are
How does spectral degradation via channel vocoding affect the discriminability and perceptual weighting of the spectral and temporal cues that signal the final consonant voicing for a “loss-laws” distinction. Specifically, is the perceptual weighting of spectral and temporal cues influenced by the discriminability of those cues? Is there a change in listeners’ reliance on different temporal or spectral cues when unprocessed low-frequency speech information is restored (bimodal stimulation) as compared with vocoder-alone stimulation?
We test the hypothesis that the availability of fine-structure cues enhances the discriminability as well as the perceptual saliency of the low-frequency formant cues (i.e., F1 offset). Simulations of CI and bimodal hearing, which allows for a better control of the degree of spectral resolution and audibility for the low-pass stimuli, were used to probe the basic theoretical question of the systematic shift of weighting strategies from natural speech to vocoded speech and to the enhanced spectral resolution in the low-frequency region. In this experiment, normal-hearing listeners performed a categorization task for the minimal pair of “loss” and “laws” where the pronunciation of these words only differs in the voicing of the final fricative consonant, with a voiceless consonant /s/ and voiced consonant /z/, respectively. The /s/-/z/ contrast provides a good opportunity to investigate the potential change of weighting strategies with enhanced low-frequency spectral cues. Three cue dimensions for this contrast were manipulated, including the F1 offset of the vowel, vowel-to-consonant duration ratio, and the duration of low-frequency modulation (glottal voicing) within the final consonant (as done in the study by Winn et al., 2012). Both the vowel duration and the low-frequency formant transition cue should be preserved with the inclusion of the low-frequency fine-structure information. To examine the relationship between perceptual weights and sensitivity to the acoustic cues, each listener performed a discrimination task using a three-interval forced-choice paradigm for each cue dimension.
Methods
Subjects
A total of 10 normal-hearing listeners aged between 20 and 26 years participated in this study. All were monolingual native speakers of American English. Each listener passed a hearing screening at 20 dB HL (125–8000 Hz) in both ears.
Stimuli
Acoustic Parameter Levels Defining the Three Factors for the Stimuli.

Note. VCR: vowel-consonant duration ratio; F1: first formant frequency; CVoicing:.
Speech stimuli were created by manipulating natural speech sounds using a modification of the procedure described by Winn and Litovsky (2015). A natural recording of “laws” spoken by a native speaker of North American English was used as a template for modification. It was decomposed into source and filter parameters using the linear predictive coding (LPC) estimation and inverse filtering method available in the Praat software (Boersma & Weenink, 2014). Four formants were estimated below 3700 Hz, resulting in a 7400 Hz sampling frequency for LPC estimation. The LPC object was converted into a FormantGrid object, which was systematically modified to yield five levels of F1 offset frequency (ranging from 294 Hz for [Vz] to 621 Hz for [Vs]) that were equally spaced in Bark frequency, using the formula provided by Traunmüller (1990); all other formants were left at the same level as that from the original sound. The formant manipulation was applied only to the final 20% of the vowel, as follows: FormantGrid points in the final 20% were deleted, and a single point was inserted at vowel offset; upon conversion from FormantGrid to Formant object in Praat, linear interpolation was applied every 10 ms to slope the formant frequency from its steady-state value of 590 to its target value in the continuum. The resulting altered FormantGrid was convolved with the residual glottal source sound to yield a sound with modified formant trajectories. This sound was upsampled and low-pass (LP) filtered below 2000 Hz (with symmetrical 1500 Hz filter rolloff implemented using inverse fast Fourier transform) and added to the high-pass energy (above 2000 Hz with the aforementioned rolloff) from the original sound. The resulting composite sounds thus had modified first formants, with no modification of upper formants, and preserved all energy above 2000 Hz. This procedure deviated from that used in the study by Winn et al. (2012), which used just two levels of F1, created by either preserving or truncating the vowel before the [z] transition.
Following vowel formant manipulation, vowel duration was altered in a five-step continuum that was logarithmically spaced between 175 ms (for [s]) and 325 ms (for [z]). All fricative energy was excised from stimuli following this step, so that controlled fricatives could be appended to the vocalic portion.
Fricatives were generated by combining 0, 30, or 50 ms of the onset of voiced [z] segments with the complete [s] segment. The resulting mixes were then truncated to create a five-step continuum that was logarithmically spaced between 250 ms (for [s]) and 100 ms (for [z]). Following truncation, a cosine-shaped falling amplitude contour was applied to the final 50 ms of the sound. The presence of low-frequency voicing energy for [z] altered the spectrum of the [s] segments with which it was blended but was considered here to be a primarily temporal cue, as it did not change the spectrum of the frication noise itself because it contributed temporal (amplitude) modulations and because it was manipulated in terms of its duration.
The concatenation of the vocalic and fricative portions of the stimuli yielded vowel:consonant duration ratios spanning a range from 0.7 to 3.25, consistent with those used by Winn et al. (2012), which were based on values from natural productions reported by House (1961) and Stevens, Blumstein, Glicksman, Burton, and Kurowski (1992) and used by Flege and Hillenbrand (1985) in prior experiments.
The final set of vocalic and fricative segments were combined in five corresponding pairs using a 10-ms cross-fading concatenation using Praat, yielding a total of 75 stimuli that varied on three cue dimensions (F1, VCR, and CVoicing).
Signal Processing
All 75 synthesized speech stimuli underwent two separate types of signal processing: noise-band channel vocoding to simulate the temporal-envelope based CI speech processing and LP filtering to simulate residual acoustic hearing in bimodal stimulation.
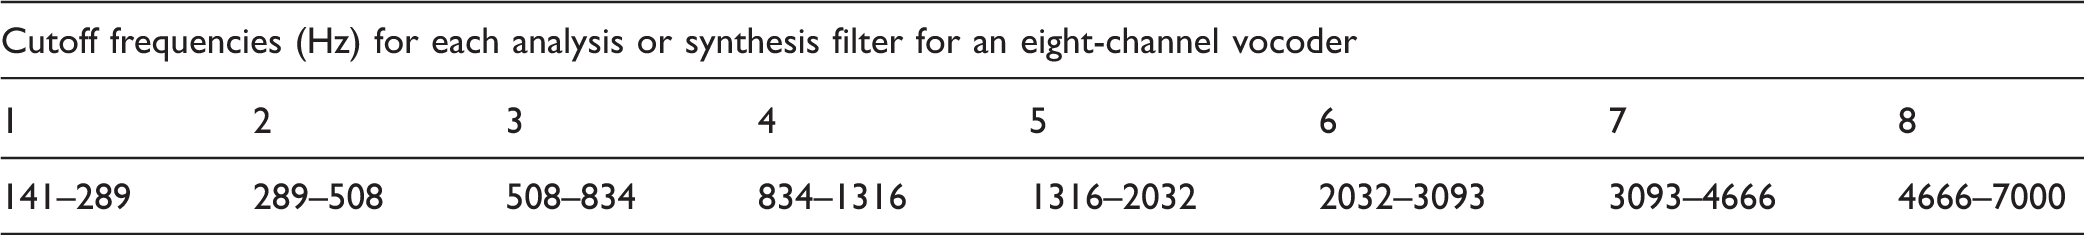
Noise-band channel vocoding
Cutoff Frequencies for Vocoder Processing.
LP filtering
To preserve the fine spectral and timing information in the low frequencies, speech stimuli were LP filtered using the Hann filter procedure in the Praat software. The filter had a pass band from 0 to 750 Hz with a symmetrical 250 Hz smoothing bandwidth, resulting in 100% energy at 625 Hz, 50% energy at 750 Hz, and 0% energy at 875 Hz.
Procedures
Test conditions
Each subject was tested with the unprocessed full-spectrum speech, vocoder speech alone, LP speech alone, and vocoder + LP speech where the vocoder speech was presented to one ear and the LP speech to the other. The unprocessed speech condition served as the baseline condition for individual normal-hearing listeners’ weighting of cues for the “loss”-“laws” contrast.
Stimulus presentation and loudness balance
All stimuli were presented from a LynxTwo sound card using 16-bit resolution at a 44.1-kHz sampling rate, routed to a Tucker-Davis headphone buffer (Tucker Davis Technology, Alachua, FL) and transmitted through Sennheiser HD 600 headphones to the listener, who was seated inside a sound-attenuated room.
The unprocessed and vocoder speech stimuli were presented at a root-mean-square level of 68 dBA, a listening level indicated by our subjects to be comfortable. Unprocessed speech was presented to both ears and vocoded speech was present monaurally.
The presentation level for the LP speech stimuli was determined using a loudness balancing procedure, in which LP speech in one ear was adjusted to have the same loudness as vocoded speech in the opposite ear. This step was important because the benefit achieved with bimodal hearing can be influenced by the perceived loudness of the low-frequency acoustic cues, with the largest benefit achieved when the acoustic signals are balanced in loudness with the CI signal (Dorman, et al., 2014). In addition, listeners may have a bias toward the louder signal; thus, equating the loudness between the vocoded and LP speech minimizes the effect of loudness on the listener’s weighting strategies. A single speech stimulus was used for the loudness balancing task. First, the vocoded stimulus was presented alone five times at a fixed level of 68 dBA. Then, the LP speech was presented alone in the opposite ear five times, at the same level as the vocoded stimulus. The listener was asked to indicate how the perceived loudness of the LP speech compared with the vocoded speech. In our subject group, all subjects either indicated that the LP speech had the same loudness as the vocoded speech or the LP speech sounded softer. We then used a bracketing technique in which the level of the LP speech was increased in steps of 1 dB, and the comparison between vocoded and LP speech was repeated at each new LP level. When the subject indicated that the LP speech was perceived as being louder than the vocoded speech, the level of LP speech was decreased in 1 dB steps until it was perceived as being softer. This procedure was completed three times to determine the equal-loudness level of the LP speech stimulus. To further confirm that the stimuli were loudness balanced across ears, both the vocoded and LP speech were presented simultaneously to allow for direct comparison. For the majority of the subjects, the final presentation level of the LP speech was 70 dBA, that is, 2 dB higher than the level of the vocoded speech.
Half the subjects received vocoded stimuli in the left ear and LP stimuli in the right ear; the other half received stimuli in the opposite configuration. Before the main experiment, a categorization task was used to confirm that each subject could correctly label the extreme unprocessed tokens of “loss” and “laws”. During the main experiment, each subject was tested with the unprocessed speech first. The order of the processed listening conditions (i.e., vocoder alone, LP alone, and vocoder + LP) was randomized across subjects. Each subject performed two tasks in each listening condition—a categorization and a discrimination task. Half of the subjects were tested with the categorization task first followed by the discrimination task, and the other half performed the tasks in the reverse order.
Discrimination task
Discrimination testing was performed for each of the three cue dimensions (F1, VCR, and CVoicing) in each of three listening conditions: unprocessed, vocoder alone, and LP alone. A three-interval two-alternative forced-choice paradigm was used. The first interval was the standard and subjects were asked to detect which of the second or third interval sounds differed from the first interval sound.
Stimuli used for the discrimination task were extracted from the synthesized “loss-laws” stimuli. F1 offset was extracted from the vowel portion of the stimuli; VCR was extracted from both the vowel and the final consonant portion of the stimuli; CVoicing was extracted from the final consonant portion of the stimuli. For the discrimination task, acoustical information varied only in one cue dimension while holding the other cue dimensions constant within each test trial. F1 offset discrimination was performed separately at two levels of VCR (Levels 1 and 5) while fixing CVoicing at Level 1. VCR discrimination was performed at Level 1 of F1 offset and Level 1 of CVoicing. CVoicing discrimination was performed at Level 1 of F1 offset and Level 1 of VCR. 1 Each discrimination task was performed for the unprocessed, vocoder alone, and LP alone conditions, except for CVoicing, in which the LP alone condition was not tested because the voiceless final consonant lacked energy in the low frequencies.
Three test blocks were completed for each cue dimension, with three pairs of contrasts within each block. Each contrast pair was tested 20 times, resulting in 60 trials per block. Each of the three contrasts compared two levels (low vs. mid), (mid vs. high), and (low vs. high) across the continuum for each cue dimension. For example, the contrasts for F1 offset discrimination were [294 vs. 447], [447 vs. 621], and [294 vs. 621]. Percent correct discrimination was calculated on the basis of 60 test trials (3 blocks × 20 trials per block) for each paired contrast.
Categorization task
The categorization task was performed in all four listening conditions (unprocessed, vocoder alone, LP alone, and vocoder + LP). Procedures were similar to those used in Winn et al. (2012). The 75 synthesized stimuli were presented in random order. Each token was presented once and subjects were asked to select one of the two words, “loss” or “laws,” displayed on a computer screen. Five blocks of stimuli were tested for each listening condition, resulting in a total of 375 trials per listening condition per subject.
Analysis
Listeners’ binary responses (“loss” or “laws”) in the categorization task were fit using a generalized linear (logistic) mixed-effects model (GLMM) in the R software interface (R Development Core Team, 2010), using the lme4 package (Bates, Maechler, Bolker, & Walker, 2014). The binomial analysis used the logit linking function, and parameter levels were centered relative to the mean, since the R GLM call function sets “0” as the default level while estimating other parameters. The statistical model included main effects of the three cue dimensions, listening condition, and the interactions between acoustic cues and listening condition (i.e., how the influence of the cues changed across the different conditions of unprocessed or vocoder or LP or vocoder + LP). This model includes random intercepts of subject, condition, and subject by condition, and by-subject random slopes of F1 and VCR. No cue-by-cue interactions were included, as phonetic cue trading (c.f. Repp, 1982) tends to emerge at central (i.e., ambiguous) levels of cues rather than scaling linearly with cue value, as would be assumed by a linear model. Expression of the model is as follows:

Results
Discrimination Task
A repeated-measures analysis-of-variance was performed independently on RAU scores in each cue dimension.
VCR discrimination
Figure 1 (left panel) shows percent correct discrimination for VCR for each listening condition and contrast. The patterns of results were similar across listening conditions. The two main effects, listening condition: F(2,18) = 4.15, p = .041; contrast: F(2,18) = 290.91, p < .0001, were significant. The interaction effect was not significant, F(4,36) = 2.29, p > .05. For each listening condition, discrimination performance for the [2.04 vs. 3.25] contrast was significantly poorer than that for the other two contrasts (p < .001). Listening condition did not produce a significant difference in performance for any contrast, except for the [2.04 vs. 3.25] contrast where the LP condition produced poorer performance than the vocoder condition by 7.5 percentage points, t(9) = 2.94, p = .017.
Discrimination results for three acoustic cues for each contrast and listening condition. DNT = Did not test.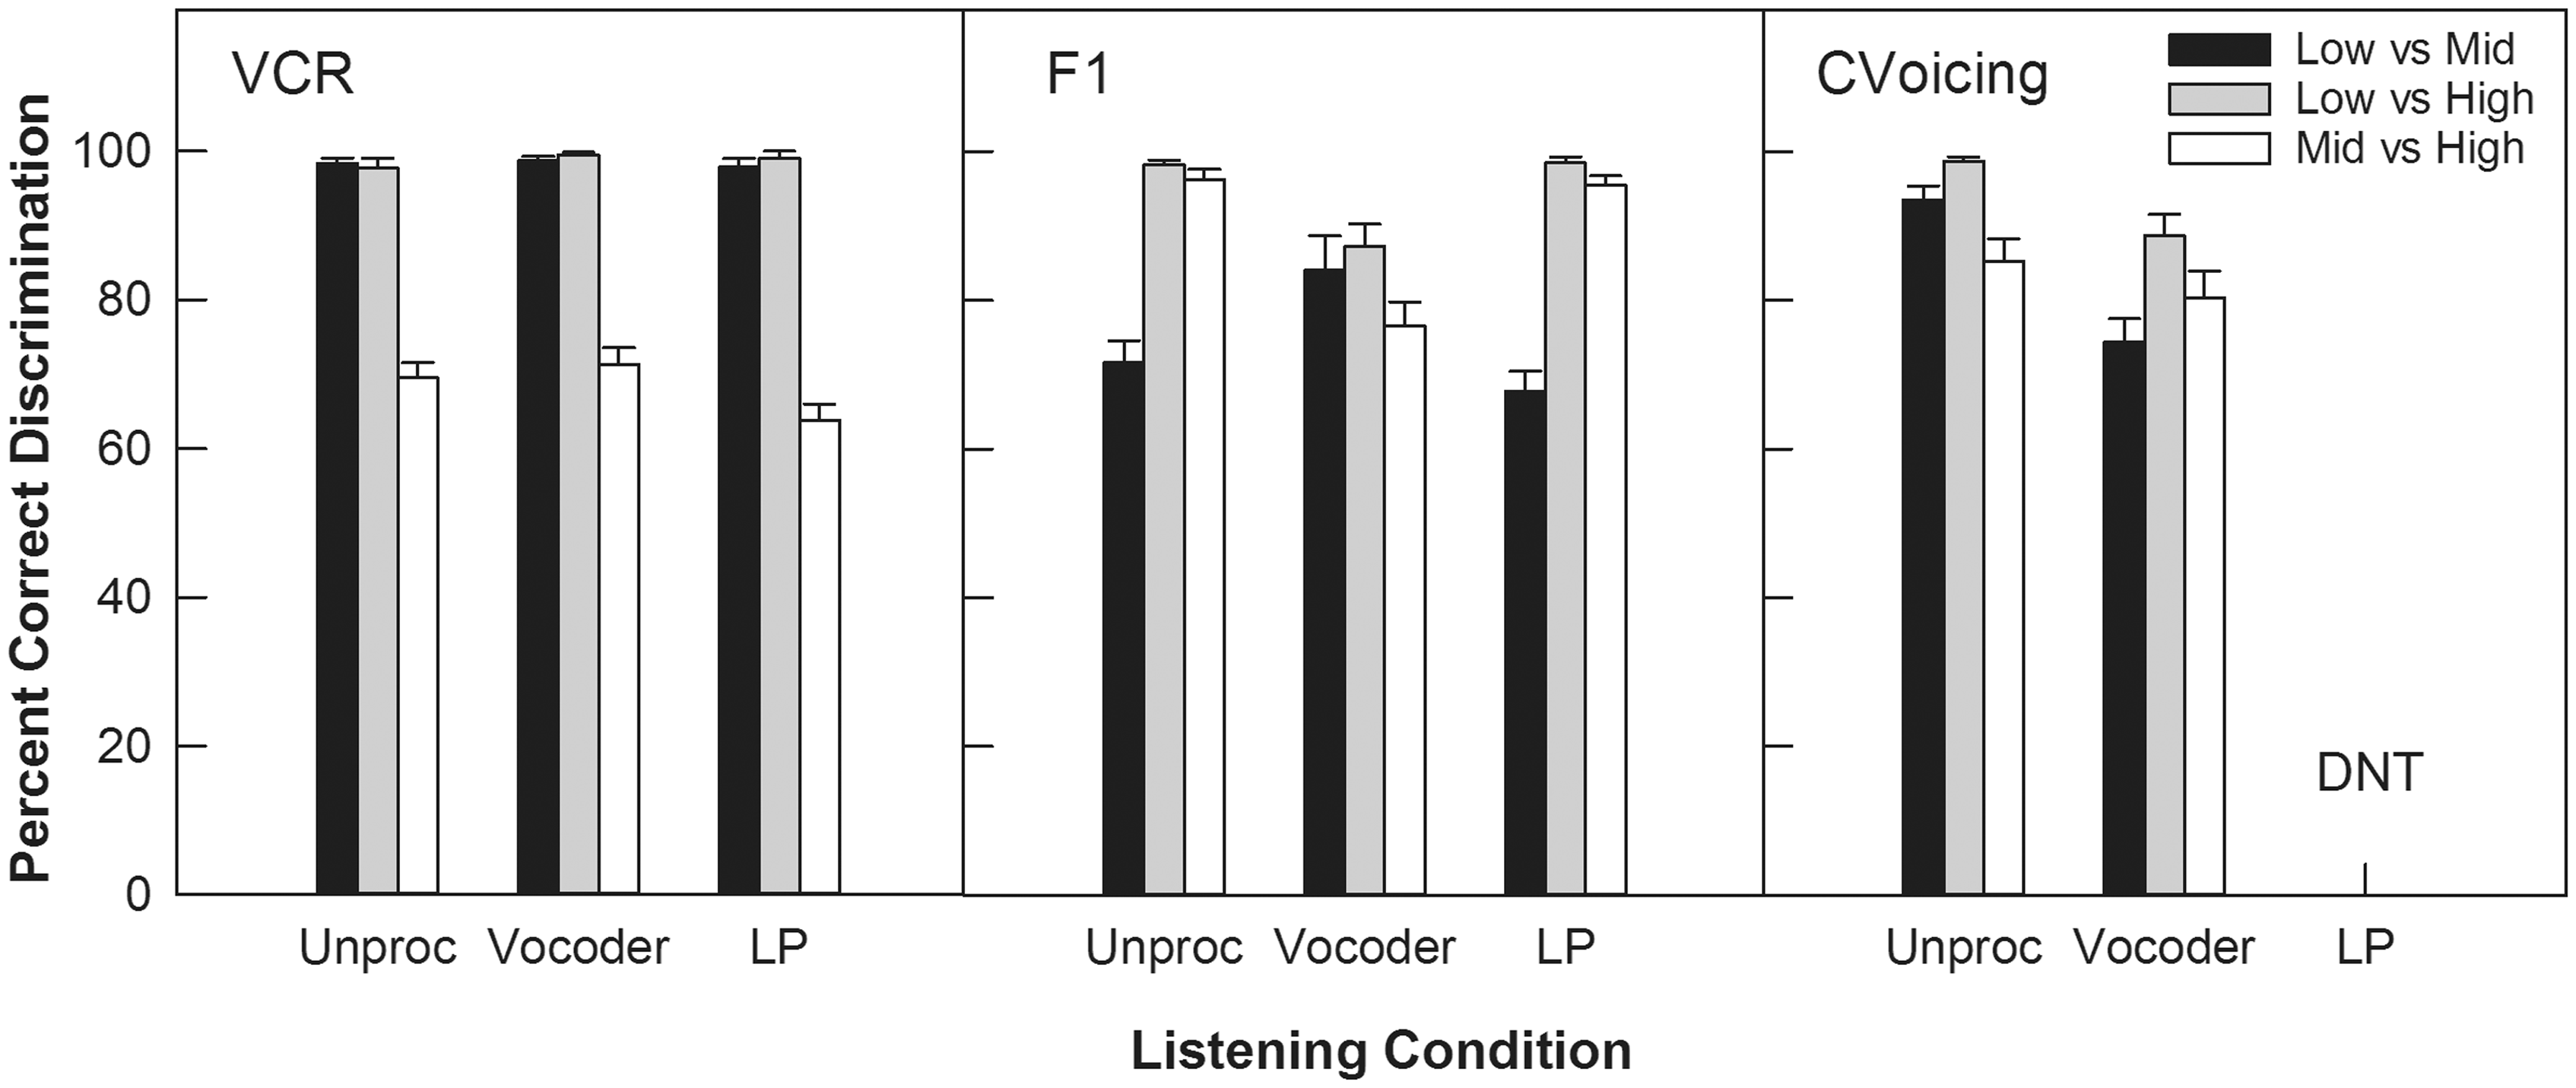
F1 offset discrimination
A three-factor analysis was performed to determine the effect of listening condition, contrast, and VCR on F1 discrimination performance. The main effects of listening condition, F(2,18) = 7.00, p = .023, and contrast, F(2,18) = 191.00, p < .0001, were significant, but the main effect of VCR, F(1,9) = 0.57, p = .49, did not reach significance. The two-way interaction (listening condition × contrast) was significant, F(4, 36) = 48.45, p < .0001, but other interactions were not (p > .05).
Subsequent analyses were performed at each level of listening condition and contrast with scores averaged across the two levels of VCR. Figure 1 (middle panel) shows the percent correct discrimination scores for each listening and contrast condition, averaged across the two levels of VCR. A significant effect of listening condition was found for all three contrast pairs (p = .005). Pairwise comparisons for the simple effect at each level of contrast (with Bonferroni correction where alpha = 0.05/3 = 0.017) showed a significant difference between the unprocessed and vocoder conditions, and between the vocoder and LP conditions. Discrimination scores in the vocoder alone condition were significantly poorer than those in the unprocessed and LP conditions (p < .001) for two out of the three contrasts [447 vs. 621] and [294 vs. 621]. For the remaining contrast [294 vs. 447], vocoder alone performance was better than performance in the unprocessed and LP conditions (p < .01). The unprocessed and LP conditions were not significantly different for any contrasts (p > .05).
Within each listening condition, discrimination scores were significantly different across the contrasts (p < .005). Pairwise comparisons were performed for contrasts in each listening condition (alpha = 0.017 after Bonferroni correction). In general, the unprocessed and LP conditions showed similar patterns of results, in which the discrimination scores reached at 100% correct for the [447 vs. 621 Hz] and [294 vs. 621 Hz] contrasts, and performance dropped significantly by 20 to 30 percentage points for the [294 vs. 447 Hz] contrast. However, the pattern of results was different in the vocoder condition compared with the unprocessed and LP conditions. For the vocoder condition, the [294 vs. 621 Hz] and [294 vs. 447 Hz] contrasts were discriminated better than the [447 vs. 621 Hz] contrast.
CVoicing
Figure 1 (right panel) shows percent correct discrimination for CVoicing for each contrast in the unprocessed and vocoder conditions. Performance for consonant voicing discrimination was similar across these two listening conditions. The two main effects, listening condition: F(1,9) = 35.20, p < .0001; contrast: F(2,18) = 34.21, p < .0001, and the interaction, F(2,18) = 11.05, p = .002, were all significant. For each listening condition, the contrast [0 vs. 50 ms] had the highest discrimination score (p < .017). The unprocessed condition was significantly better than the vocoder condition for the contrasts [0 vs. 30 ms] and [0 vs. 50 ms] (p < .01), but not for the [30 vs. 50 ms] contrast.
Cue-Weighting or Categorization Task
Figure 2 shows the categorization functions for each level of the VCR (left), F1 (middle), and CVoicing (right) cues for all listening conditions, averaged across the levels of the other two cues. Results of this GLMM are shown in Table 3.
Categorization functions for three acoustic cues across four listening conditions. Results of Generalized Linear Mixed-Effects Model. Note. VCR: vowel-consonant duration ratio; F1: first formant frequency; CVoicing: consonant voicing. *significance of the asterisks is indicated by the p-values (numbers right next to the asterisks).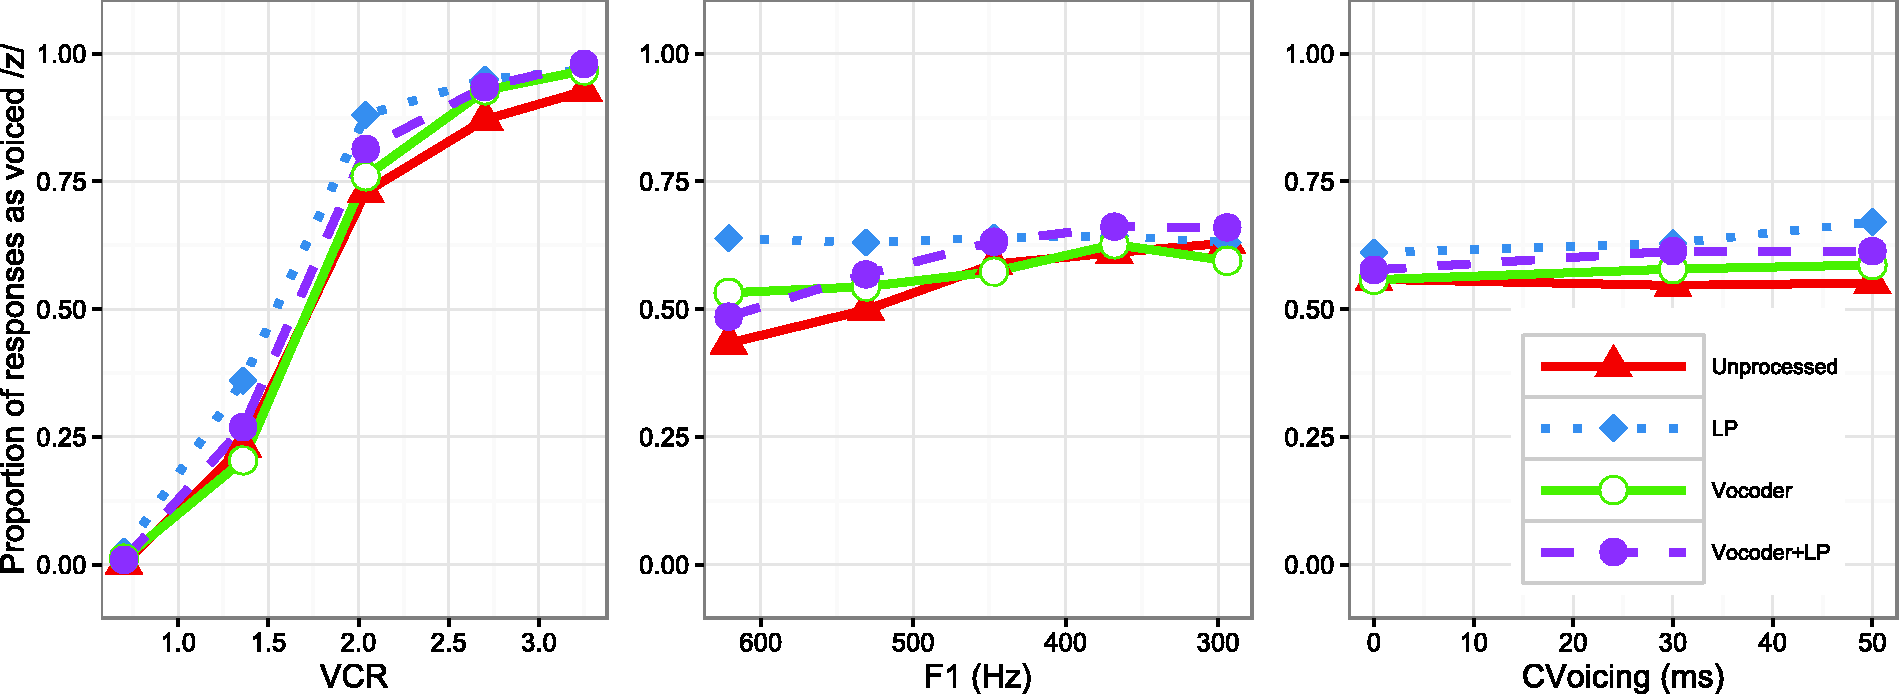

The vocoder condition was the default for the GLMM, meaning that all other conditions were compared for significant differences relative to the vocoder condition. All main effects of acoustic cues (F1, VCR, and CVoicing) reached significance (VCR p < .001; CVoicing p < .01; F1 p < .05) in the vocoder condition. Among the three cue dimensions, VCR had the largest effect overall and CVoicing had a very small effect.
In the unprocessed full-spectrum speech condition, there was significantly greater reliance on F1 (p < .001), significantly less reliance upon VCR (p < .001), and significantly less reliance upon consonant voicing duration (p < .05) compared with the vocoder condition. In other words, the better spectral resolution resulted in more reliance on spectral cues and less reliance on temporal cues, consistent with the results of Winn et al. (2012).
The important comparison was between the vocoder and vocoder + LP conditions. This comparison was designed to elucidate the changes in cue-weighting strategy that occur when unprocessed low-frequency energy is added to a broadband degraded stimulus, akin to adding low-frequency hearing to a CI. In this condition, listeners made significantly greater use of F1 (p < .001) and also more use of VCR (p < .05) than in the vocoder alone condition, suggesting more consistent categorization of cues in both the spectral and temporal domains. While the benefit of F1 perception was predictable, the increased weighting of VCR was not explicitly predicted. It is likely that the additional low-passed acoustic energy helped to more clearly define vowel duration and distinguish the vowel from the consonant, thereby yielding better access to this acoustic cue.
Responses in the LP condition were generally more heavily biased toward “voiced” perceptions (p < .05 for the main effect of this condition on the intercept), while no other condition differed significantly from the vocoder condition in this respect. The only other significant change in categorization in the LP condition was that the F1 cue was used less (p < .001).
The perceptual weights (expressed as GLMM factor estimates) for all three cues and all four listening conditions are shown in Figure 3. Compared with unprocessed speech, a trading relation was identified for vocoded speech, in which a decrease in the perceptual weight for the spectral cue (F1) was associated with a significant increase in weights for the temporal cues; the GLMM produced negative coefficients for the interaction of the unprocessed condition with the simple effects of both VCR and CVoicing, which reflect less use of those cues in the unprocessed condition compared with the vocoder condition (the default comparison). The opposite pattern (positive interaction coefficient) emerged for the F1 cue, reflecting increased weighting for the unprocessed condition. However, the cue-trading effect between spectral and temporal cues was less clear for the vocoder + LP speech. In this case, a higher perceptual weight for the spectral cue did not result in lower weights for the temporal cues, compared with the weights observed for unprocessed speech or vocoded speech.
Perceptual weights of all three cues and all four listening conditions, expressed as factor estimates from the GLMM group model. These scores reflect the log odds change in perception resulting from change in one unit of the cue (i.e., change in 1.0 in VC ratio, or 1 Hz F1 frequency, or 1 ms consonant voicing duration), and thus reflect cue weight within the context of the range of values taken by each cue domain.
Individual Differences
Figure 4 shows the relationship between individuals’ discrimination performance for each cue and their reliance upon the cue in the categorization task. As a group, the average F1 offset discrimination performance was better for the unprocessed condition than for the vocoder condition, t(9) = 3.98, p = .003]. An examination of the categorization functions and cue weights from individual subjects showed that there were large individual differences in the weighting of the F1 cue, even for the unprocessed condition. While all subjects achieved >80% correct F1 discrimination performance for the unprocessed stimuli, two-thirds of the subjects showed an increase proportion of labeling “laws” with decreasing F1 offset frequency and one-third showed a flat response function (F1 logistic coefficient < 0.001). However, as shown in Figure 4 (middle panel), cue weights did not significantly correlate with individual subjects’ discrimination scores for any of the listening conditions (unproc: r2 = .07, p = .17; vocoder: r2 = .13, p = .05; LP: r2 = .00, p = .96). An interesting finding is that while F1 discrimination ability was generally good in the LP condition (similar to that for the unprocessed speech), categorization functions were highly variable, including some that were the reverse of what would be expected of a typical listener based on previous acoustic and perceptual studies. This observation is illustrated as individual cue weight estimates left of the “0” mark in the middle panel of Figure 4.
Relationship between cue weight (x axis) and average performance for cue level discrimination (y axis). Cue weights are expressed as factor estimates from the group GLMM.
Weighting of VCR was uniformly high across listening conditions, and did not show a significant relationship with cue discriminability (Figure 4, left panel). In contrast, CVoicing weighting was uniformly low across listening conditions, and showed a peculiar apparent relationship that reversed direction when the condition was changed between unprocessed and vocoded speech (Figure 4, right panel).
Discussion
The present study investigated the effect of spectral resolution on perceptual weighting strategies in simulated cochlear-implant and bimodal hearing. Specifically, it examined how the perceptual saliency of a spectrally based cue (the F1 offset cue for “loss-laws” identification) was affected when low-frequency fine-structure information was available (i.e., unprocessed speech and vocoder + LP speech). A discrimination task for each of the three cue dimensions (F1, VCR, and CVoicing) provided information on the reliability of cues presented alone in the unprocessed, vocoder, and LP speech conditions. A categorization task for stimuli in the “loss-laws” continuum varied cues simultaneously, allowing us to probe listeners’ weighting strategies in different listening conditions.
Our general findings are as follows: (a) There was a tradeoff between spectral and temporal cues for “loss-laws” identification for spectrally degraded speech, (b) there was an effect of cue reliability on perceptual weighting strategies for broadband speech, and (c) there was considerable variation in the weighting strategies used by individual listeners and differences were not explained by the listeners’ sensitivity to the cue dimensions.
Effect of Spectral Resolution on the Cue-Trading Relation for “Loss-Laws” Identification
Consistent with findings of Winn et al. (2012), listeners showed less use of spectral cues (i.e., F1), but greater use of temporal cues (i.e., VCR) for spectrally degraded speech (vocoder) compared with unprocessed speech. Despite the individual differences in the cue weights, the GLMM showed that the effect of F1 offset was smaller, and the effect of VCR was greater, in the vocoder condition than in the unprocessed condition. As a group, there was a trading relation of down-weighting of spectral cues (for F1) accompanied by significant up-weighting of temporal cues (notably VCR) for vocoded speech.
Unlike the trade-off between spectral and temporal cue weighting for vocoded speech, both types of cues were used more strongly in the simulated bimodal hearing condition (cf. Figure 3), where low-frequency fine-structure information was added to the vocoded speech. It has been suggested that low-frequency fine-structure cues provide greater perceptual saliency in both the spectral dimension (music perception: e.g., Dorman et al., 2008; Kong et al., 2005; voicing and F1 cue recognition for speech perception: Ching et al., 2007; Kong & Braida, 2011; Sheffield & Zeng, 2012; Zhang et al., 2010) and temporal dimension (speech segmentation: Dorman & Gifford, 2010; Kong, Donaldson, & Somarowthu, 2015; Most, Harel, Shpak, & Luntz, 2011; Spitzer, Liss, Spahr, Dorman, & Lansford, 2009), allowing listeners to focus on both types of cues simultaneously. The presence of extra low-frequency acoustic information could also more clearly define the segmental boundaries between the vowel and consonant (impacting VCR), and more effectively transit low-frequency glottal voicing (impacting CVoicing). However, the weighting of these two cues (VCR and CVoicing) did not vary dramatically across listening conditions.
Relationship Between Discriminability and Perceptual Saliency for F1 Offset Cue for “Loss-Laws” Identification
When comparing different listening conditions, we observed a relationship between perceptual acuity and perceptual weighting for the F1 offset cue for “loss-laws” identification for broadband speech. Both the F1 discrimination score and the weighting of the F1 offset cue for “loss-laws” identification were lower for vocoded stimuli than for the unprocessed stimuli. This finding suggests that reliance on the F1 cue is reduced when the cue becomes less discriminable due to spectral degradation in the vocoder condition.
However, weighting strategies varied across subjects, especially for F1 offset cue. Although the majority of the subjects utilized the F1 cue for identification of “loss-laws” in the unprocessed speech condition, 3 out of 10 subjects did not. The three individuals who did not use the F1 cue in the unprocessed condition also did not use this cue in the vocoder condition. A similar proportion of subjects (two out of eleven) tested by Winn et al. (2012) showed negligible weighting of this cue. The inter-subject variability observed in the present study did not seem to be related to the discriminability of the F1 cue for any listening condition (cf. Figure 4). This finding is consistent with the lack of a clear relationship on an individual basis between cue importance and perceptual sensitivity to the cue for other phonemic contrasts, as reported by Moberly et al. (2014, 2016).
With the addition of low-frequency fine-structure cues, the F1 z-score increased for the vocoder + LP condition compared with the vocoder alone (see Table 3), likely owing to the improved F1 discrimination provided by the LP ear. The increased weighting of the F1 offset cue in the vocoder + LP condition (compared with vocoder alone or LP alone) suggests (a) that listeners were able to integrate the vocoder and LP signals across ears and (b) that fine-structure information increases the perceptual saliency of the spectral cue. As discussed by Moberly et al. (2014; 2016), sensitivity to the spectral cue is a requisite for weighting this cue strongly. The additional low-frequency fine-structure cue provided by the LP ear, in this case, enhanced the listeners’ F1 sensitivity to a level where it could be used for the identification of consonant voicing contrasts such as the one tested here.
An unexpected finding was that listeners relied more heavily on the VCR cue in the LP condition, even though LP speech preserves considerable F1 information. Weighting of the F1 offset cue was significantly weaker in the LP condition compared with the vocoder condition. Thus, it appears that F1 information is used more heavily in the context of a broadband signal. This could be related to the notion of how perceptual weighting strategies are influenced by language experience (i.e., broadband signal) to which the normal-hearing listeners are accustomed. Taken together, the vocoder + LP and LP alone data suggest that sensitivity to the spectral cue is necessary but not sufficient for spectral weighting (Moberly et al., 2014).
Effect of Stimulus Manipulations on the Importance of Individual Cues
Although the patterns of results for the unprocessed and vocoder conditions were similar between the current study and that by Winn et al. (2012), VCR cues were used more heavily and the other cues were less salient in the present study. For example, for the listeners tested by Winn et al. (2012), the proportion of stimuli labeled “laws” changed from 0.20 to 0.70 as F1 offset decreased from 635 to 450 Hz. A similar change in F1 offset (621 to 447 Hz) resulted in a smaller change in “laws” response, from 0.4 to 0.6, in the current study. This could reflect, in part, differences in the stimulus sets used in the two studies. First, Winn et al. used only two levels for the F1 offset cue, as compared with five levels in the current study. The increased number of levels in this somewhat less salient cue dimension may have further lessened the use of this cue by our listeners. Second, vowel and consonant durations were linked in the current stimulus set (VCR cue), unlike the orthogonal manipulation used by Winn et al.; mutual reinforcement of the durational cue between the vowel and the final consonant may have led to stronger weighting of the VCR cue in the present study. Also, the values and the number of VCR selected in the current study may have biased listeners toward the VCR cue, in which three out of the five VCR levels resulted in 80% to 90% identification of “laws.” It seems less likely that differences were due to differences in subject groups, given that both studies used young normal-hearing listeners.
To evaluate the impact of introducing multiple cue levels in the F1 domain, a follow-up experiment was conducted, using a restricted range of VCR (ranging from 1.0 to 2.5), while otherwise testing the same cues examined in the main study. Restricting the range of VCRs was intended to mitigate the strong bias for /z/ perception in two ways: first, it did not include the highest VCRs; and second, it was less variable, suggesting that it might not be as salient. These steps were taken to free responses to vary more widely between /s/ and /z/ along the other cue dimensions. The same 10 subjects were tested as in the main experiment, and the same procedures for the categorization task were used. Figure 5 demonstrates the categorization functions for the restricted set of stimuli. It can be seen that the resulting responses and GLMM analysis confirmed stronger effects of listening condition on the weighting of the F1 cue; the vocoder and LP conditions yielded nearly flat categorization functions, with substantial increases in slope for unprocessed and vocoder + LP conditions.
Categorization functions for three acoustic cues across four listening conditions when the VCR cue was restricted to only three levels.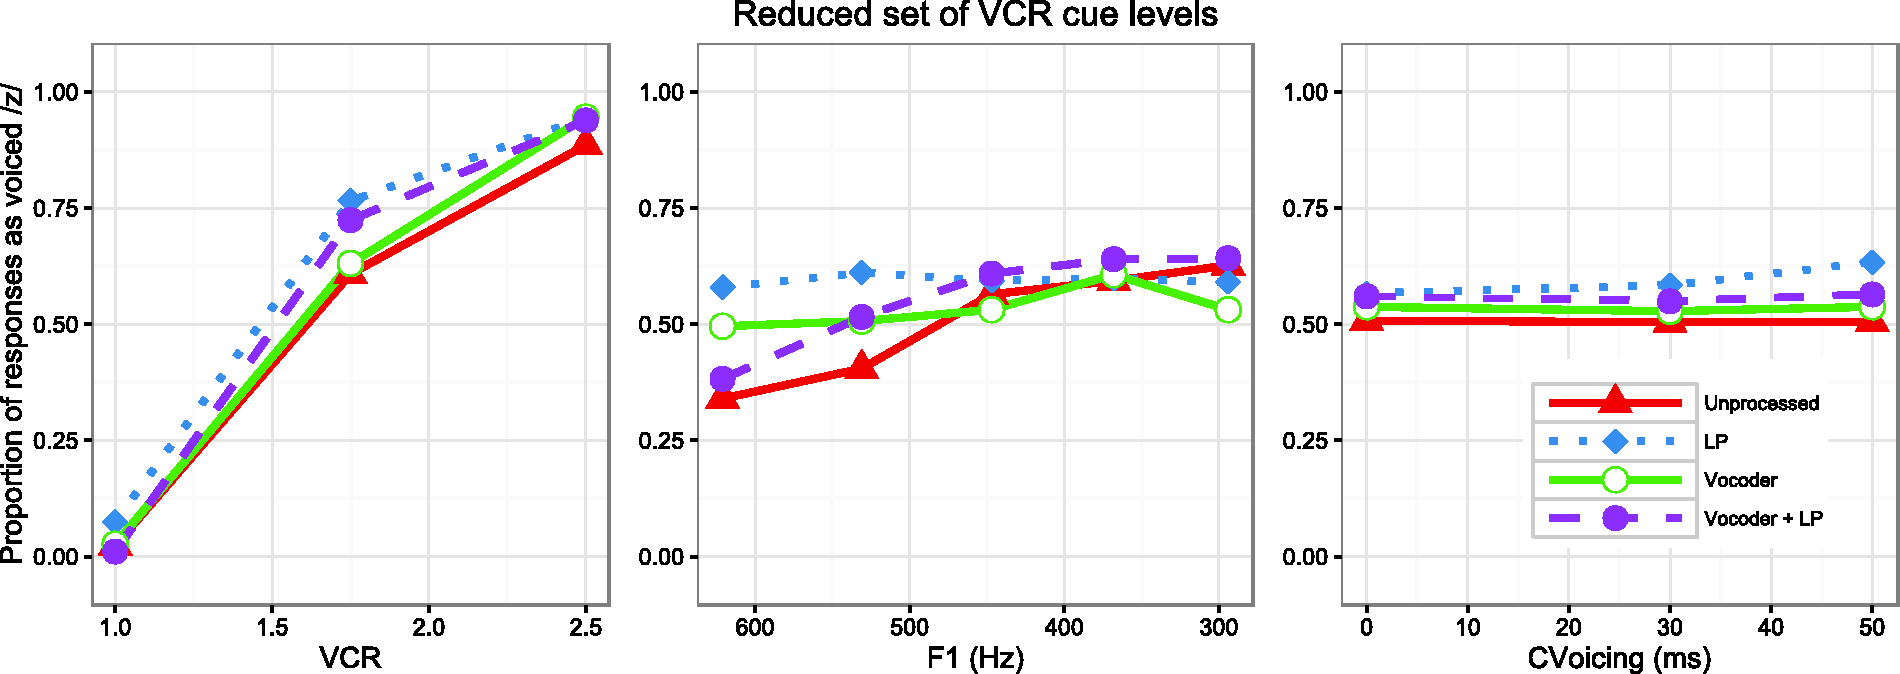
A second follow-up study used stimuli identical to those used by Winn et al. (2012) to assess subject group variability and the effect of a restricted set of F1 values. Eight of the same 10 subjects from the main experiment completed this follow-up study. The experimental procedures for the categorization task described in the Methods section were used. There was at least one-week lapse time between studies for each subject. The results of this study revealed a stronger effect of F1 than that reported in Table 3 for the main experiment in the current study. Additionally, separate effects of vowel and consonant duration were identified, consistent with the results of Winn et al. (2012). Figure 6 demonstrates the categorization functions for the stimuli used by Winn et al. in the four listening conditions in this study. For this replication, the effect of listening condition on the weighting of F1 is more straightforward: it is weakest in the vocoder condition, slightly higher in the LP condition, and considerably higher in the unprocessed and vocoder + LP condition. It can also be seen that consonant duration has an effect independent of vowel duration, which is understandably weakest in the LP condition, where the consonant would be rendered nearly inaudible.
Categorization responses to stimuli used in the study by Winn et al. (2012) in the four listening conditions used in the current study. Notable differences include the independence of vowel and consonant duration, and the use of only two different levels of F1.
Results of the second follow-up study (Figure 6) illustrate the influence of stimulus dimensions on the estimation of cue weighting. Separating the contribution of vowel and consonant duration (rather than tying them together in a “double-cue” fashion) apparently allowed for more influence of the F1 offset cue, which was most readily accessible in the unprocessed speech and vocoder + LP conditions. Hence, when in a listening condition that promotes the use of spectral cues, listeners can take advantage of acoustic fine-structure to categorize speech cues.
Clinical Implications
As a group, listeners in the present study weighted spectral cues more strongly in the simulated bimodal condition than in the vocoder alone and LP alone conditions. Importantly, this finding shows that listeners can integrate cues across ears and subsequently attend to the enhanced spectral information when labeling stimuli along the “loss”-“laws” continuum.
As pointed out in previous studies (e.g., Kirk, Tye-Murray, & Hurtig, 1992; Kong & Braida, 2011; Kong, et al., 2015; Moberly et al., 2016; Moberly et al., 2014; Winn et al., 2012; Winn & Litovsky, 2015), variability in CI and bimodal hearing outcomes likely reflect factors beyond sensitivity to spectral or temporal cues. Indeed, it is likely that performance on simple discrimination tasks (e.g., spectral ripple: Aronoff & Landsberger, 2013; Azadpour & McKay, 2012) cannot satisfactorily account for variability in speech recognition performance in CI users.
Previous studies have provided evidence that top–down processing (e.g., context effect, phonemic restoration, cue-integration) plays a role in speech recognition when listeners receive spectrally degraded speech signals (e.g., Başkent, 2012; Kong & Braida, 2011; Kong et al., 2015; Loebach, Pisoni, & Svirsky, 2010; Peng, Chatterjee, & Lu, 2012; Sheffield, Schuchman, & Bernstein, 2015; Yang & Zeng, 2013). The current study extends that work by demonstrating a shift of cue-weighting strategy in a listening situation where one of the cues is perceptually degraded. This finding supports the earlier conclusion of Moberly et al. (2014; 2016) that cue-integration and optimal weighting of cues plays an important role in successful speech perception.
Footnotes
Acknowledgments
We would like to thank Ala Somarowthu for technical support. We also thank the two anonymous reviewers for their helpful comments on an earlier version of the manuscript.