
Abstract
Keratin is a natural biopolymer with excellent biocompatibility and biodegradability properties. It is widely used in biomaterial construction. The secondary structure of keratin is essential in its applications. This structure is associated with its regeneration. In this study, the structure of regenerated keratin from wool was analyzed using the amide I, II, and III bands from second-order derivation Fourier transform infrared spectroscopy. The results showed that the regenerated wool keratin retained its molecular backbone with the cleavage of disulfide bonds. The amide I and II bands indicated that the content ratio of α-helix to non-α-helix structure was less in the regenerated keratin than that of raw wool. The amide III band confirmed the contents of α-helix/β-sheet/β-turn/random coil for raw wool (35%/31%/22%/13%) and regenerated keratin (26%/35%/23%/15%).
Introduction
Wool is composed of 95 wt% keratin content, which has good biocompatibility properties.1–4 Wool is an important textile material with interesting cloth-related performance, including good elasticity, strong hygroscopicity, and excellent warmth. Furthermore, wool dyed with natural dyes has a higher value because the wearability is improved.5–8 However, the wide use of wool in the textile industry also results in a great amount of waste being produced every year. 9
Regenerating keratin is an efficient way of recycling waste wool.10,11 However, regeneration is hampered by the dense and complicated secondary structures, including α-helix and β-sheets in the polypeptide structure of wool keratin, due to the sequence of amino acids at a string being linked by hydrogen bonds to the other string. The polypeptide backbone of the α-helix structure is coiled in a right-handed helix, where hydrogen bonding occurs between successive turns of the helix. In a β-sheet structure, the stretched strings of polypeptide are placed either parallel or antiparallel to one another and hydrogen bonds form between them; furthermore, disulfide bonds also contribute to the stability of the wool keratin structure.12,13 When protein is treated by some physical or chemical agents, including high temperature, radiation, acids, and bases, the disulfide and hydrogen bonds are unavoidably broken, which results in the change of secondary structure content.14,15 This process is generally called protein denaturation. 16
At present, the facile test method for the alteration of keratin secondary structures during treatment and regeneration is not suitable or beneficial for its further application. Circular dichroism spectroscopy (CD) is a method to determine the secondary structure of protein by using the optically active chromophores in protein molecules to absorb different circularly polarized light. 17 CD needs to be conducted on a dilute protein solution, and the more α-helix structures a protein has, the more accurate the CD result is. 18 In the study of Ramya et al., 19 a 0.3 mg/mL keratin solution was prepared using 50 mM of phosphate buffer saline (pH 7.4), but the detailed secondary structure content was not given. Ye et al. 20 used CD to obtain the secondary structure content of regenerated keratin by the reduction method, indicating that the α-helix structure content decreased. However, before the CD test, the non-water-soluble keratin was removed to obtain a clear solution, which resulted in the content loss of the secondary structure. Overall, CD is not suitable for natural wool keratin analysis due to its water insolubility and relative complicated procedures.
Protein crystal structure can be determined by X-ray diffraction (XRD) analysis; the secondary structure content can be obtained by further analysis of crystallinity.21,22 However, tested samples need to be obtained as a high quality single crystal; therefore, for the keratin macromolecule with its complex structure, this method is not suitable. Shavandi et al. 23 determined the secondary structure content of regenerated wool keratin by peracetic acid treatment using XRD and the results showed that peaks of keratin at about 9° and 21° were stronger and sharper than these of wool. This indicated that regenerated keratin had a higher content of β-sheet structure. However, dissection of the peaks is limited by the fact that it cannot distinguish characteristic peaks of wool keratin at 2θ = 17.8° and 19°. 24 A similar result was also reported by Li et al.; 25 the disappearance of the peak about 9° indicated that the α-helix structure was destroyed during the dissolving process.
Fourier transform infrared (FTIR) spectroscopy is a simple procedure with few interference factors and can be used to determine the cleavage degree of disulfide bonds.26–28 Protein FTIR spectra are composed of a series of amide absorption bands, which are referred to as amide A, amide I, amide II, and amide III bands.29–31 FTIR has potential in protein conformation research.
In this work, wool keratin was regenerated and the macromolecular backbone and disulfide bond alterations were investigated by FTIR spectra. The secondary structure of keratin was investigated by second-order derivation FTIR of amide I, amide II, and amide III bands. Moreover, this analysis method was applied on silk protein for determining its general applicability. The aim of this study was to investigate the results of the regeneration process on the protein secondary structure using second-order derivation FTIR spectra to avoid problems encountered in other analysis methods such as the need for an aqueous phase system, complex operations, and lack of data visualization. The present work provides a useful and facile path for the secondary structure determination of protein-containing materials like wool and other polymers with similar structures after treatment, such as surface modification, regeneration, and grafting.
Experimental
Material
Wool fiber was obtained from Xiexin Co. Ltd (Jiangsu, China). It was cleaned and defatted in a Soxhlet extractor using acetone. Degummed silk fibers were supplied by Xinyuan Silk Co. Ltd (Nantong, China). Analytically, pure choline chloride and urea were purchased from Sinopharm Chemical Reagent Co. Ltd (Shanghai, China).
Methods
Preparation of Deep Eutectic Solvent
The deep eutectic solvent was prepared according to established procedures. 32 Choline chloride and urea were dried at 80°C for 48 h in a vacuum oven. They were then mixed and heated until the solvent became homogeneous.
Regeneration of Wool Keratin
Cleaned wool fiber was added to the deep eutectic solvent at 130°C and stirred to complete dissolution. The mass ratio of wool to solvent was 1:50. Regenerated keratin was obtained by using a dialysis membrane (molecular weight cutoff point was 3500 Da) and freeze drying.
FTIR Analysis
FTIR spectra of the raw wool and regenerated keratin were determined using a Thermo Nicolet iS 10 spectrometer with the attenuated total reflectance (ATR) technique. Each sample was subjected to 32 scans and they were taken at a resolution of 4 cm−1. The spectral scanning frequency range was from 500 to 4000 cm−1.
Derivative FTIR Spectra
Before obtaining the second-order derivative, each FTIR spectrum was smoothed twice using a smoothing factor of 25. Smoothing was performed to eliminate any possible noise in the spectra.
Determination of the General Applicability Using Silk Protein
The derivative FTIR spectra of the raw silk and extracted protein were determined and analyzed according to the above methods.
Results and Discussion
FTIR Analysis
The FTIR spectra of raw wool and regenerated keratin are shown in Figure 1. The medium absorption band in the range of 3283–3273 cm−1 was attributed to N–H stretching (amide A). A strong absorption peak in the range of 1640–1614 cm−1 was attributed to C=O (amide I). A medium strong peak was observed in the range of 1580–1480 cm−1 and attributed to C–N stretching and N–H in-plane bending vibrations (amide II). The weak band (1234–1242 cm−1) indicated C–N, C–O stretching, and N–H and O=C–N bending vibrations (amide III). 33 Compared with raw wool, there were no additional peaks in the FTIR spectra of the regenerated keratin. This implies that the regeneration process did not disrupt the main macromolecular backbone of wool keratin. However, the peaks of regenerated keratin moved to a higher wave number, which may be due to hydrogen bond cleavages (Figure 1).
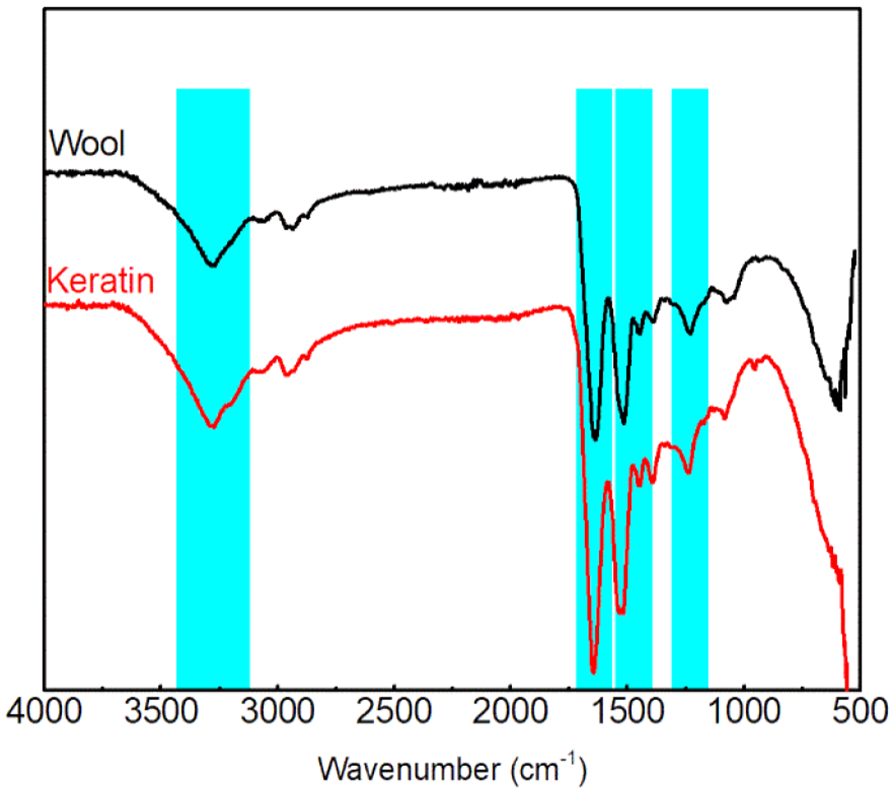
ATR-FTIR of wool and keratin.
S–O Finger FTIR Spectrum Analysis
Disulfide bonds maintain the stable structure of wool keratin. Keratin regeneration is, therefore, accompanied by disulfide bond cleavage. Changes in the S–O finger FTIR spectrum reflect the cleavage degree of disulfide bonds. The S–O finger FTIR spectrum of raw wool and regenerated keratin is shown in Figure 2. For the raw wool, the oxidation peaks of cystine products were attributed to oxygen in the air. Compared with raw wool, the S–O intensity in the spectra of regenerated keratin was strengthened. This indicated the oxidation and cleavage of disulfide bonds.
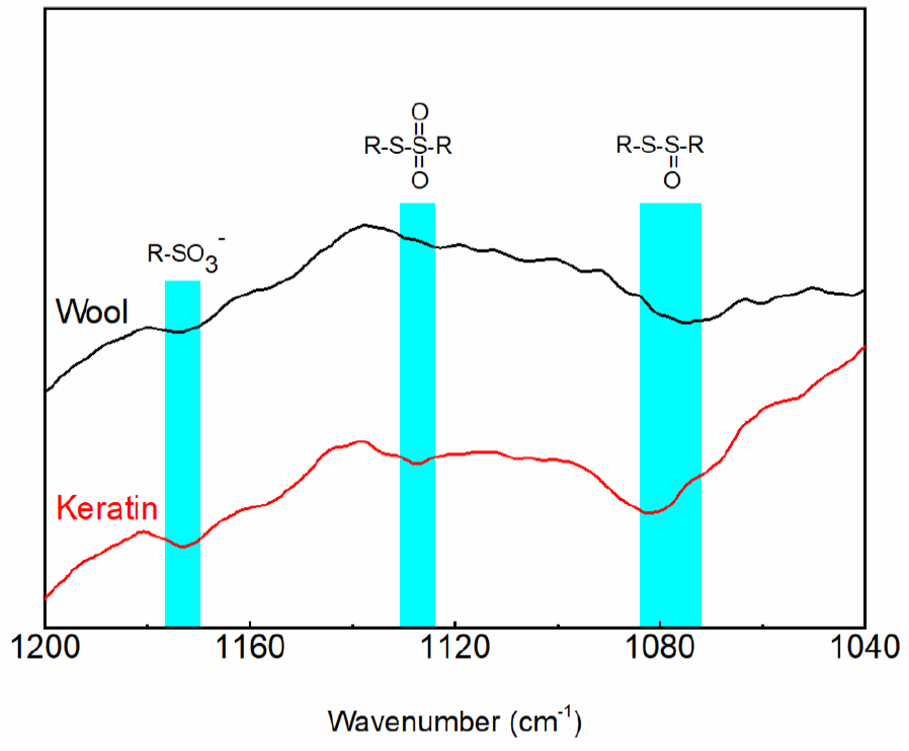
S–O FTIR analysis of wool and keratin.
Secondary Structural Analysis
Analysis of Secondary Structure by Amide I Band
The amide I band was used to analyze the secondary structure of wool keratin. 34 The second derivative procedures were performed in the region between 1660 and 1600 cm−1 (Figure 3). In the second derivation of amide I bands, the peak at 1654 cm−1 was attributed to the α-helix structure, while the peak at 1626 cm−1 was attributed to the non-helix structure, including β-sheets and random coils. Compared with the 1626 cm−1 band, there was a decrease in the intensity of the absorption band at 1654 cm−1 (Table 1). This implied that low α-helical structure amounts were contained in the regenerated wool keratin with respect to the raw wool.
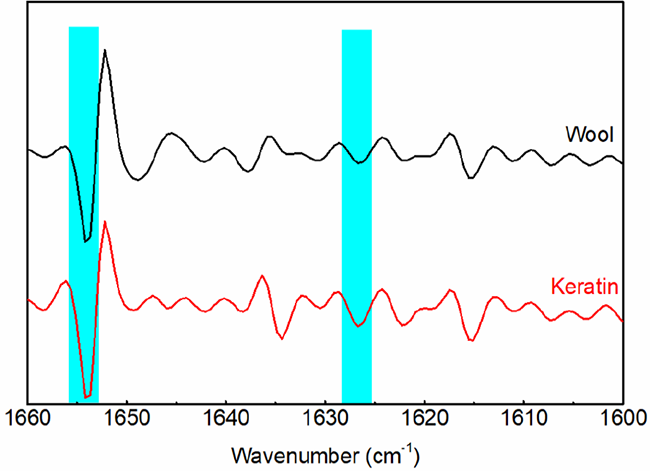
Second-order derivation of amide I in the FTIR spectra of wool and keratin.
Calculated peak intensity ratio of FTIR second-order derivation for amide I in wool and keratin.
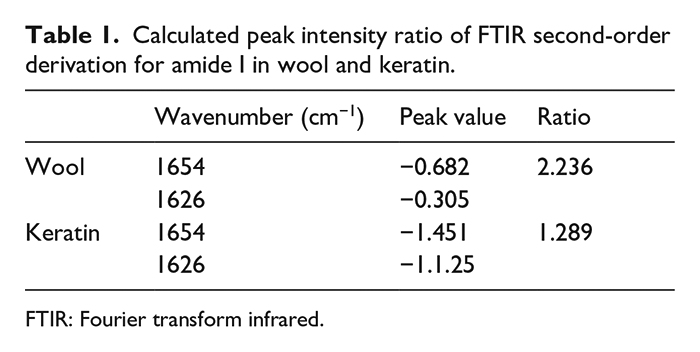
FTIR: Fourier transform infrared.
Analysis of Secondary Structure by Amide II Band
The amide II band can also be used to analyze the secondary structure of wool keratin. 35 The second-derivative procedures were done in the region between 1550 and 1510 cm−1 (Figure 4). For the second derivation of amide II bands, the peak at 1549 cm−1 was attributed to the α-helix structure, while the 1512 cm−1 peak was attributed to the β-sheet structure and random coils. Compared with raw wool, the peak intensity ratio of α-helix to β-sheets and random coils decreased (Table 2). This implied that the α-helix structure was transformed to β-sheet and random coil structures.
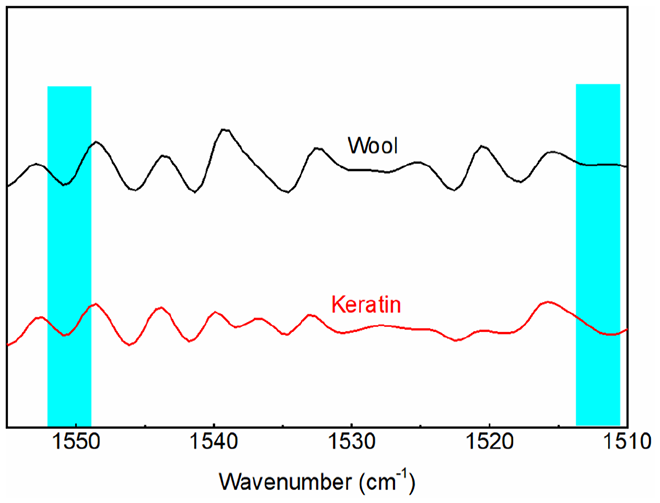
Second-order derivation of amide II in FTIR spectra of wool and keratin.
Calculated peak intensity ratio of FTIR second-order derivation for amide II in wool and keratin.
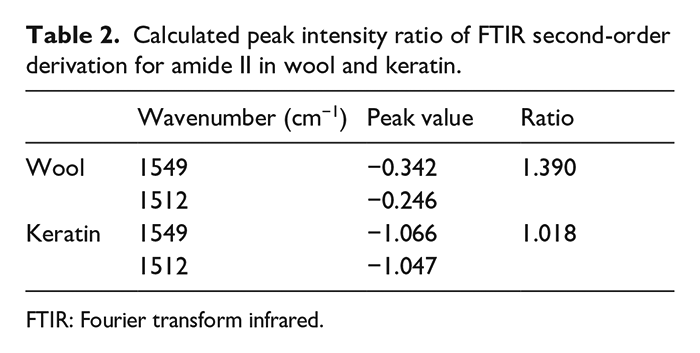
FTIR: Fourier transform infrared.
Analysis of Secondary Structure by Amide III Band
Figure 5 shows the second-order derivation of the amide III band and band attribution, while Figure 6 shows the structure content. Absorption in the range of 1330–1295 cm−1 indicated the presence of the α-helix structure, while the band in the range of 1295–1270 cm−1 was attributed to the β-turn structure. The band observed in the range of 1270–1250 cm−1 was attributed to a disordered structure. The band recorded in the range of 1250–1220 cm−1 was attributed to the β-sheet structure. 36 The peak area result implied that the regenerated keratin retained the secondary structure of the raw wool. Furthermore, the α-helix structure was transformed to β-sheets and disordered structures during the dissolution and regeneration process, while the β-turn structure was basically unchanged.
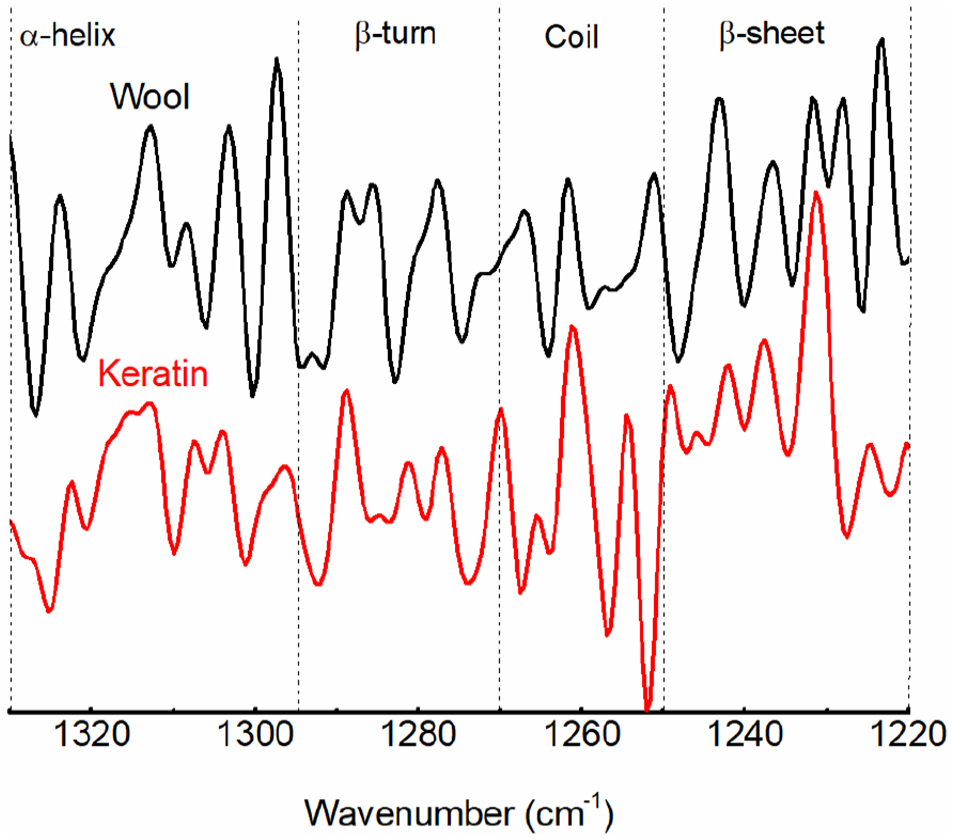
Second-order derivation FTIR spectra of amide III band of wool and keratin.
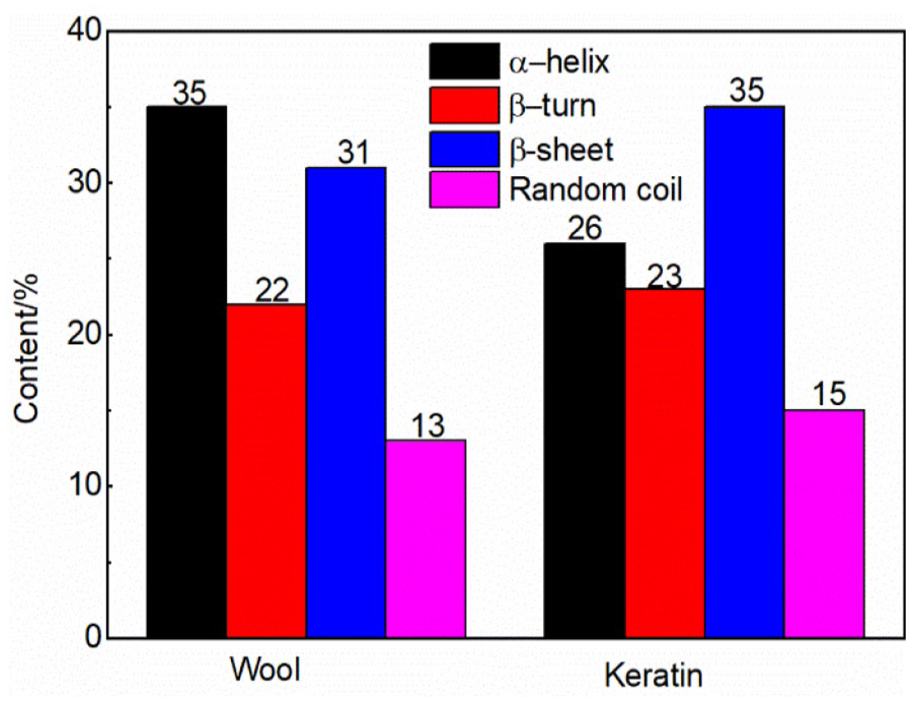
Peak area calculation results of secondary structure content of wool and keratin.
Derivative FTIR Spectra of the Raw Silk and Extracted Protein
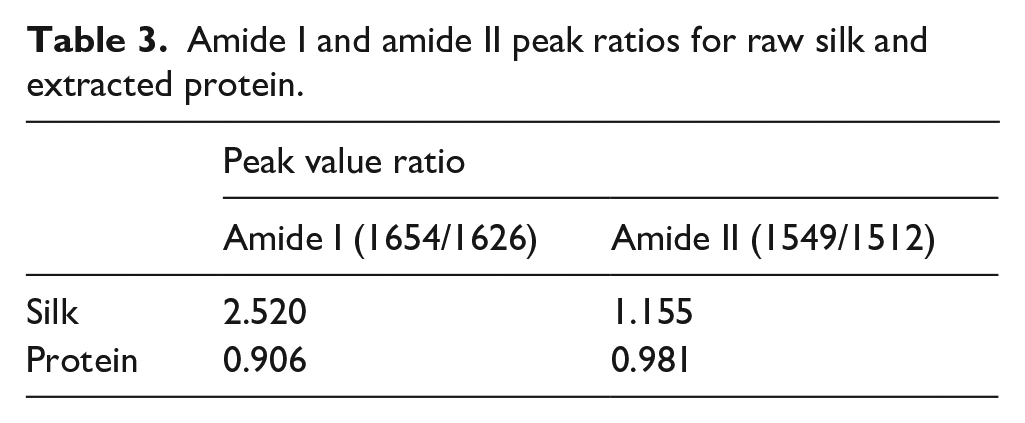
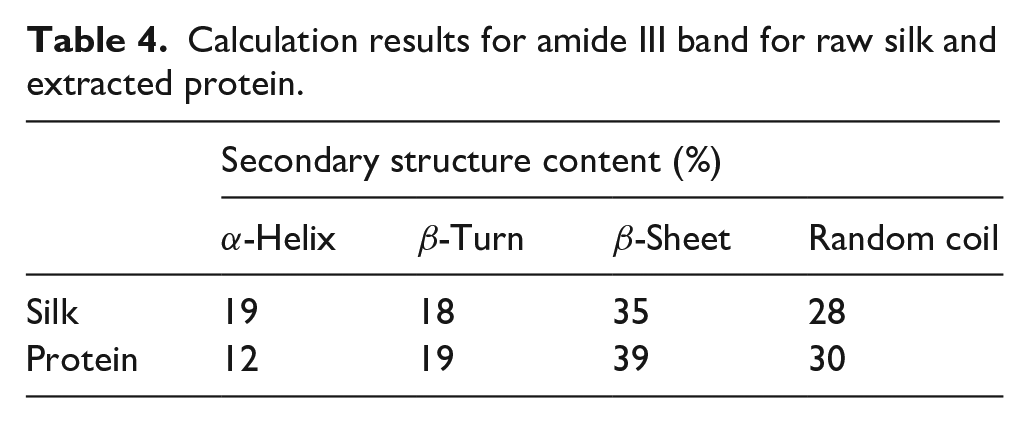
For determining whether the analysis method could be applied to different kinds of proteins or not, the second-order derivation FTIR spectra of the silk and extracted protein were collected and analyzed. The FTIR spectra and second-order derivation FTIR spectra of samples are shown in Figure 7. The calculation results are listed in Tables 3 and 4. The results from amide I, II, and III indicated that the α-helix structure was transformed to other secondary structures in the extraction process. It was also shown that this method could work on different kinds of proteins.
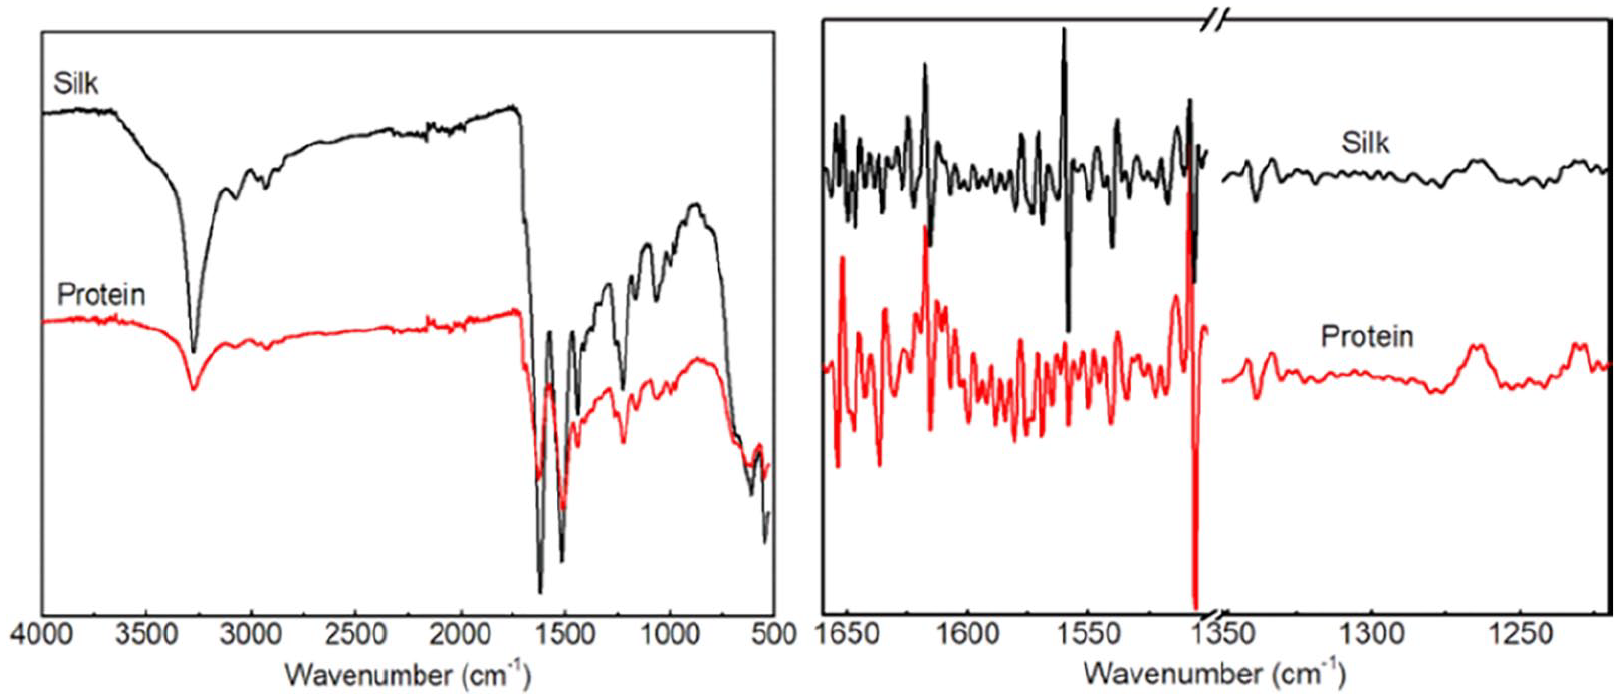
FTIR spectra of the raw silk and the protein and their derivation.
Amide I and amide II peak ratios for raw silk and extracted protein.
Calculation results for amide III band for raw silk and extracted protein.
Conclusion
The second-order FTIR spectra protein derivation can be used to characterize secondary structural changes. The amide I, amide II, and amide III bands of the regenerated wool keratin in the FTIR spectra can be used in transformational analysis; however, the amide III band is more appropriate. For the regenerated keratin using deep eutectic solvent, analysis revealed that it retained its macromolecular structure and disulfide bonds were broken. The α-helix structure was transformed to a β-sheet structure and random coil structure, while the β-turn structure was unaltered. The successful determination of the second structure change of silk protein indicated this method had a potential for other proteins. This study provides a simple and accurate method to compare secondary structural changes of protein-based textiles.
Footnotes
Declaration of conflicting interests
The author(s) declared no potential conflicts of interest with respect to the research, authorship, and/or publication of this article.
Funding
The author(s) received no financial support for the research, authorship, and/or publication of this article.