
Abstract
We analyze diversity, equity, and inclusion (DEI) reports from the top 20 Fortune 500 companies to particularly examine how these companies use visual design and representation to present an aspirational future that valorizes their current DEI efforts. We contend that if large corporations have the ability to affect outcomes among employees, stakeholders, and citizens, then educators have an obligation to prepare students to be well positioned to make change and to participate in conversations about change.
Introduction
“Disney workers protest the company’s response to the so called ‘Don’t Say Gay’ bill” (NPR, March 22, 2023); “Black executives call on ‘all of corporate America to publicly and directly oppose new laws that would restrict the rights of Black voters’” (NYT, April 2, 2021); “Abortion ruling thrusts companies into divisive arena” (AP, June 21, 2022). These are a few of the stories that have captured headlines in our national media over the last few years. The stories have stoked the fires of corporate America to take action, including making public statements in support of civil rights, donating funds to nonprofit agencies, and leading the charge on eradicating the wealth gap (as JP Morgan Chase (n.d.) has done). The Boston College Center for Corporate Citizenship (2023), which has tracked the growing trend in “corporate social advocacy,” attributes this change to stakeholder, employee, and investor expectations. In the wake of the Supreme Court ruling in Dobbs, for example, Apple declared its support for “employees’ rights to make their own decisions regarding their reproductive health” (Gurman, 2022). For Black History month, Deloitte (2022) featured “uncensored stories of Black professionals”. And still more companies have centralized the needs of military veterans and individuals with disabilities. In all these cases, the consensus appears to be that corporations can play a direct role in caring for people who have long been marginalized. Still, we have to wonder, is corporate America wielding its might to bring about social change? Can corporations take the lead in changing the culture of inequity that permeates U.S. society?
Taking a cue from the manner in which large corporations are asserting a great deal of leverage to engage in social advocacy, we look to an emerging genre in corporate discourse, the diversity, equity, and inclusion (DEI) report. We wish to better understand the rhetorical function of DEI reports within corporate reporting. Østergaard and Bundgaard (2015) explain that “genres emerge as amendments, accommodations or suitable modifications of already existing text types with a view to provide an adequate discursive response to a novel kind of situation” (p. 124). As we will show, while DEI is not a novel kind of situation, it has emerged as a touchpoint through the prominent murders of African Americans by police and the resultant Black Lives Matter protests. Likewise, while there has been important research in Technical and Professional Communication (TPC) about genre (Bazerman & Bonini, 2009; Miller, 1984; Russell, 1997; Spinuzzi, 2003), less attention has been paid to the rhetorical function of visual representations to fulfill persuasive goals in report writing.
In this study, we analyze diversity reports from the top 20 Fortune 500 companies to particularly examine how these companies use visual design and representation to present an aspirational future and how that translates to public perception. We contend that if large corporations have the ability to affect outcomes among employees, stakeholders, and citizens, then educators have an obligation to prepare students to be well positioned to make change and to participate in conversations about change. Students need to realize this is an important and valid issue in corporate America and they may be asked—or may want—to be social advocates in the workplace. Teaching them how to engage with and compose a genre such as a diversity report can be a powerful tactic for social change.
Background
Corporations employ different rhetorical strategies to communicate a vision, operationalize strategy, and create value for their companies (Casadesus-Masanell & Ricart, 2010). Previous research has investigated corporate annual reports, ESG reports, and shareholder communications, among others (Kim & Kim, 2019; Lord, 2002; Rossetti & Van Waes, 2022; Uysal et al., 2018). Some of that research has focused on specific areas such as the discourse in annual corporate reports (Qian, 2020); visual content in narrating annual reports (David, 2001); and visual representation of companies’ business model (Havemo, 2018a, 2018b). An additional justification for annual reports is to communicate business performance, which Venkatraman and Ramanujam (1986) have described as the “fulfillment of economic goals of a company” (p. 803). Historically, these annual reports rely on written narratives to frame the internal company philosophy and how it forms the present and the future, as well as state economic strength for the benefit of shareholders and interested publics.
In addition to narrative, companies use visuals, which have been labeled key components of CSR reports (Pesci & Costa, 2014). Corporations have found that visual elements improve readability (Helfaya et al., 2019), communicate content, and project the companies’ own image (Garcia & Greenwood, 2015). Moreover, because corporations wield a lot of influence and have obtained identities as autonomous beings, their affirmation of diverse identities through diversity reports is critical in visualizing the marginalized workforce.
TPC research has established the rhetorical function of visuals and visual design in business and technical report writing (David, 2001; Havemo, 2018a; Kostelnick, 2007; Toth, 2013). Infographics, as Toth (2013) points out, now dominate business communications because “audiences can process visual information much more quickly than traditional prose” (p. 450). Likewise, Havemo (2018b), who studies the use of Ericsson’s use of visuals in their annual reports over time, argues that corporations use visuals “to show what the corporation strives to become rather than what it is or has been” (p. 320), implying that such visuals serve as a form of impression management. David (2001) has characterized some visual work in annual reports as “mythmaking” (p. 197). In short, these scholars have established that visuals convey the kind of weighted information that affects public opinion. Visuals, including pictures, photographs, videos, infographics, and charts/graphs, are the primary means by which companies are making meaning and constructing narratives about themselves.
The discoursal nature of annual reports reflects the social conditions of the moment. Thus, it is not uncommon for annual reports to tap into communal and even global interests. Laskin and Mikhailovna Nesova (2022), for example, connect the rise of corporate sustainability reporting to the call for sustainable development practices in the 1987 United Nations report, Our Common Future. Since the publication of Our Common Future, corporate sustainability reports have become a mainstay of annual reports for reasons related to branding and public relations (e.g., demonstrate social consciousness). However, as Laskin and Mikhailovna Nesova (2022) have found, such reports are hardly an accurate reflection of the companies’ sustainability work, which has led to the term “greenwashing” (p. 80). Indeed, it appears, these reports are more reflective of internal corporate outreach than they are changes to their core business strategy. The visual design of these reports, then, would feed into this desire to respond to the social conditions of the moment.
Other reports in this category are the Diversity Report and the Corporate Social Responsibility report (CSR). The Diversity or DEI Report like the CSR report is designed to communicate the company’s socially responsible activities (Rossetti & Van Waes, 2022). Rossetti and Van Waes (2022) argue that the CSR can be a powerful influence on consumers and stakeholders. They specifically focus on CSR reports as a means by which companies disclose their ethical commitments to the environment and social movements in clear and transparent ways despite the challenging nature of the data being presented. In showcasing these commitments, corporations are “able to influence customers’ loyalty, purchase intentions, investments, and employment-seeking strategies” (p. 54).
Similar to CSR reports, DEI reports intentionally project a progressive image of a diverse workforce sustained by inclusive and equitable corporate initiatives. The creation of such an image, though, can be deceptive, much like Dayley (2022) has argued with college recruitment materials. Some researchers have gone so far as to call this “diversity dishonesty,” showing that companies intentionally deceive stakeholders into believing that they are more diverse and inclusive than they are (Fisher, 2022; Wilton et al., 2020). However, we would argue that DEI reports might be better positioned within the traditions of impression management (Martínez-Ferrero et al., 2019) and corporate mythmaking (David, 2001). That is, DEI reports intentionally present an image of what companies aspire to look like, but that image is not always what they truly are.
Even so, some stakeholders and even general publics might not value what they perceive as an “aggressive” corporate stance on social issues, according to Rossetti and Van Waes (2022). We have witnessed that, for example, companies such as Target, Bud Light, and even Disney are on the receiving end of public and political backlash after standing up for LGBTQIA rights. Even Chick Fil A has come under fire for simply having a DEI corporate officer. In sum, all corporate reporting is about disclosure—what companies are willing to disclose and what calculations they make concerning how that information will be received by the public is critical.
In what follows, we outline our methodology, explaining how we chose reports by Fortune 500 companies, the methods we took to analyze the content, and how we coded the data. Then we discuss the implications of our findings and their potential impact on pedagogical practices in TPC.
Methodology
To better understand how the DEI report functions rhetorically in the corporate ecology, we analyzed yearly DEI reports of the top 20 Fortune 500 companies of 2021. We chose the top 20 Fortune 500 companies because, often, these companies serve as models for others in the corporate world, have an incredible market share in their areas of interest, and turn high company profits. These 20 companies are considered leaders because of that profit margin. While they may not be the largest companies, they are the most lucrative and thus in the United States are some of the most powerful corporate entities with a lot of leverage.
To collect these public reports, during the summer of 2022, we went to the website for each of these 20 corporations and performed a search for “diversity report” and “diversity, equity, and inclusion report.” In cases where we did not find a report on the company website, we used Google to search for the name of the company plus the same boolean phrases of “diversity report” and “diversity, equity, and inclusion report.” Once we found a report for the company, we downloaded a copy and saved the url.
We followed a hand collecting and coding approach as outlined by Lauer et al. (2018) because of the diversity of our data set and the difficulty in comparing different forms of information (website, PDF, video) in a fairly recent and emergent genre.
Unlike the annual report, which is an established genre, an emerging genre like the DEI report has fewer common elements. However, because it is an emerging genre, DEI reports all prominently feature visuals and images representing a diverse workforce. Based on past trends (see David, 2001), we can speculate that the DEI reports feature images that convey a positive disposition of the company, that is, the myth of what it wants to be rather than what it really is.
Given what the research says about the rhetorical function of images and visuals in report writing, it made sense to focus on the look and feel of the reports. Specifically, structural attributes, design, and visual representation “underscore the credibility of the text by evoking an emotional response” from readers (David, 2001, p. 203). Therefore, the way that diversity and inclusion is visually represented is just as important as the text or content conveyed. Research suggests that visual representation of marginalized individuals is important for establishing a sense of trust and belonging (Davison, 2010). Design also provides a look and feel for the organization, which again establishes a rhetorical foundation for connection and trust. Structural attributes indicate the more traditional genre features or delivery methods for the report form. We note that the data in these reports is rich and deep, and we were forced to limit the subcategories we could analyze in terms of meaning and manageability.
We each read through the content of each report and together compiled a list of what we saw as the basic visual representation and design features. We chose these elements because we wanted to compare basic attributes, such as format, titles, length, design, as well as how each report presented diversity visually. Looking at these elements allows us to compare the reports and understand their common visual features. We follow Greenwood et al.’s (2019) methodology for analyzing visuals in corporate reports. In analyzing these reports, we make assumptions about the reasoning behind the choices deployed, not because we want to ascribe motive but to show how audiences might encounter or perceive these reports.
Results
We present our results below. As you will see, we try to use images from the reports and websites to show the distinctions between the different choices that companies make in presenting data.
Attributes
Table 1 presents the basic attributes of each report, including company name, date of report, title of report, format (PDF/web), and length of report. For corporate DEI reports in only-website formats, we did not include the length because of difficulty measuring and comparing to print-based reports. Only 1 company among the 20, Berkshire Hathaway, had no diversity and inclusion report or initiatives listed.
Structural Elements of DEI Reports.
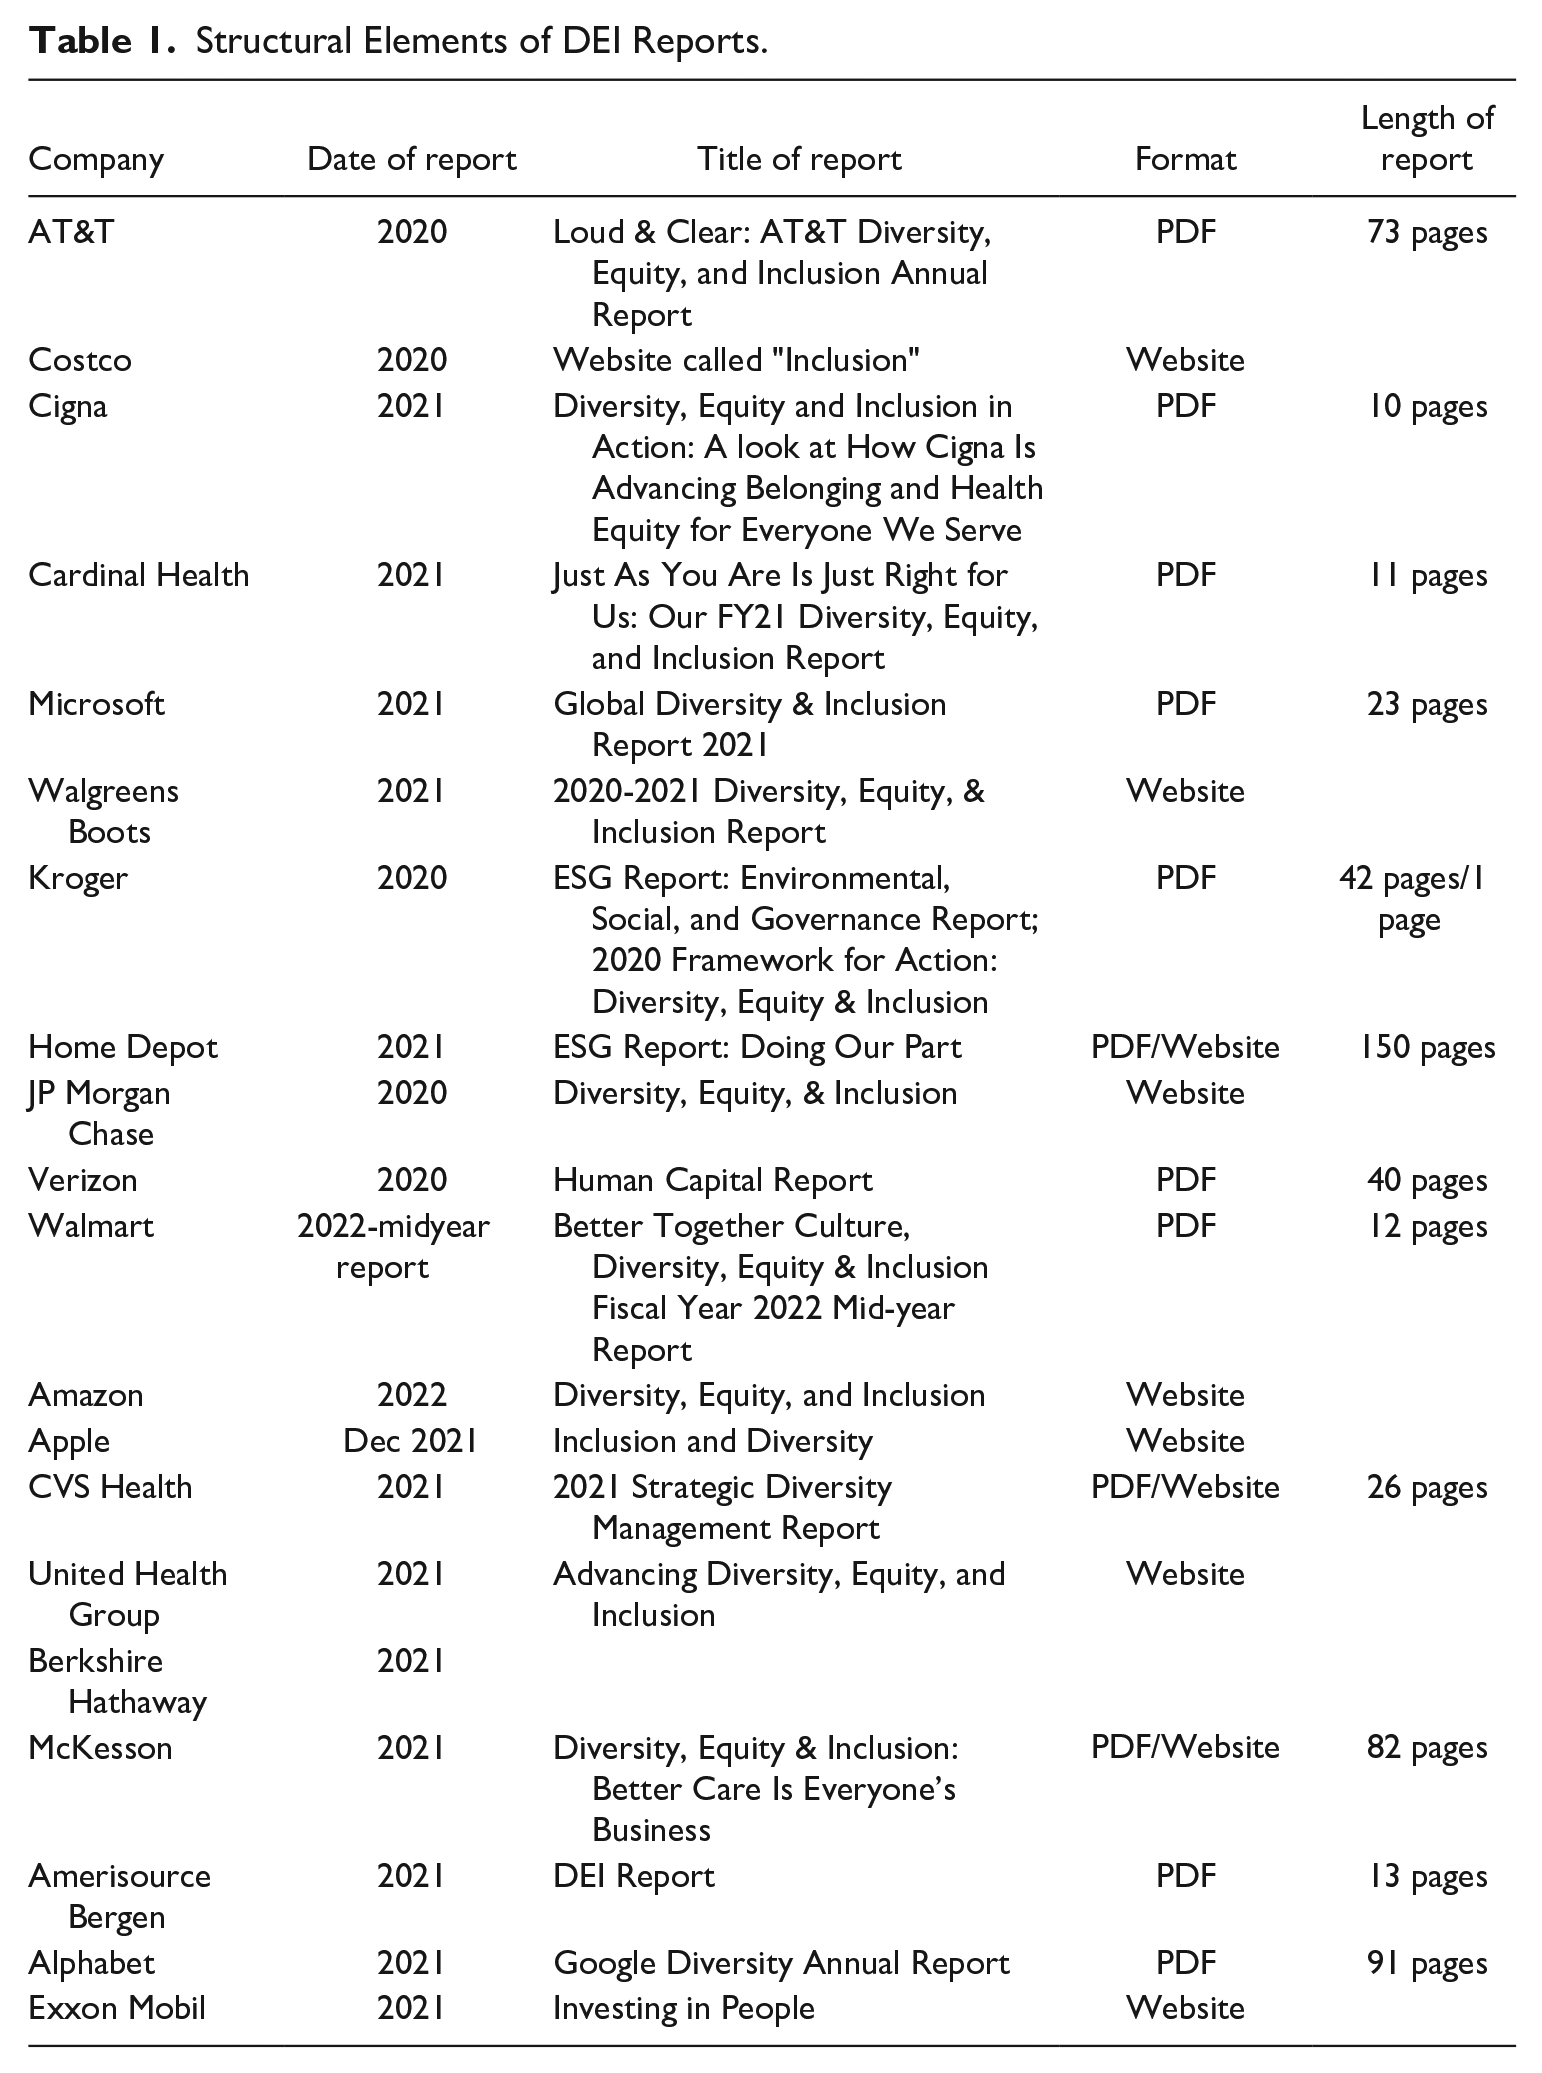
When we searched for reports in the summer of 2022, most were dated between 2020 and 2022: 5 were from 2020; 12 were from 2021; and only 2 from 2022 (Amazon and Walmart). Three companies had reports going back several years, namely, Apple (2014), Alphabet (2018), and AT&T (2018). In terms of format, 9 companies had websites only and 10 offered PDF reports, but most of these also had a website with additional information, or an executive summary and links to a PDF report. The PDF reports range from 10 pages to 150 pages. To be fair, some of the reports were titled “Environment, Sustainability, and Governance” (ESG) reports, which only contained some DEI information. In these types of reports, DEI is a subset of sustainability and is used to stress the importance of cultivating strong leadership now and going forward.
Most reports are titled with a variation of the terms Inclusion and Diversity or Diversity, Equity, and Inclusion. Titles that use DEI with all three terms include those of AT&T, Cardinal Health, Cigna, Walgreens, JP Morgan Chase; Walmart, Amazon, McKesson, and Kroger. Ten titles use a different variation of DEI or a twist on the same idea such as “Human Capital Report” (Verizon) or “Investing in People” (Exxon Mobil).
Overall, most companies still tend to use the terms diversity, equity, and inclusion in the titles of their reports, which reflects their common usage (See Figure 1). Readers of all levels will understand DEI as it is popularly identified and historically understood, and using these commonly understood terms may help readers identify the company with a greater commitment to DEI. More specific titles of these reports might project a sense of agency, a sort of “we’re taking action” on issues of diversity, equity, inclusion. Companies that use their own unique titles may do so in order to distinguish themselves, connect to their own branding, or even distance themselves from DEI. For example, the title “Investing in People” by Exxon Mobil could be perceived as depoliticizing DEI programming and reporting. Likewise, including DEI within ESG reports may be easier for the company so there is not a separate report. However, it might also distance the company from an explicitly moral or ethical commitment to DEI, relegating it to part of improved company culture and environment. In these instances, DEI is emphasized as an asset to the company’s image, which follows David’s (2001) theories that corporate report imaging contributes to a sort of mythmaking. We cannot prescribe motives for these actions, but in climates where legislatures and areas are hostile to DEI, such as in the states of Florida or Texas, we can see where choosing a less identifiably liberal title could be advantageous.
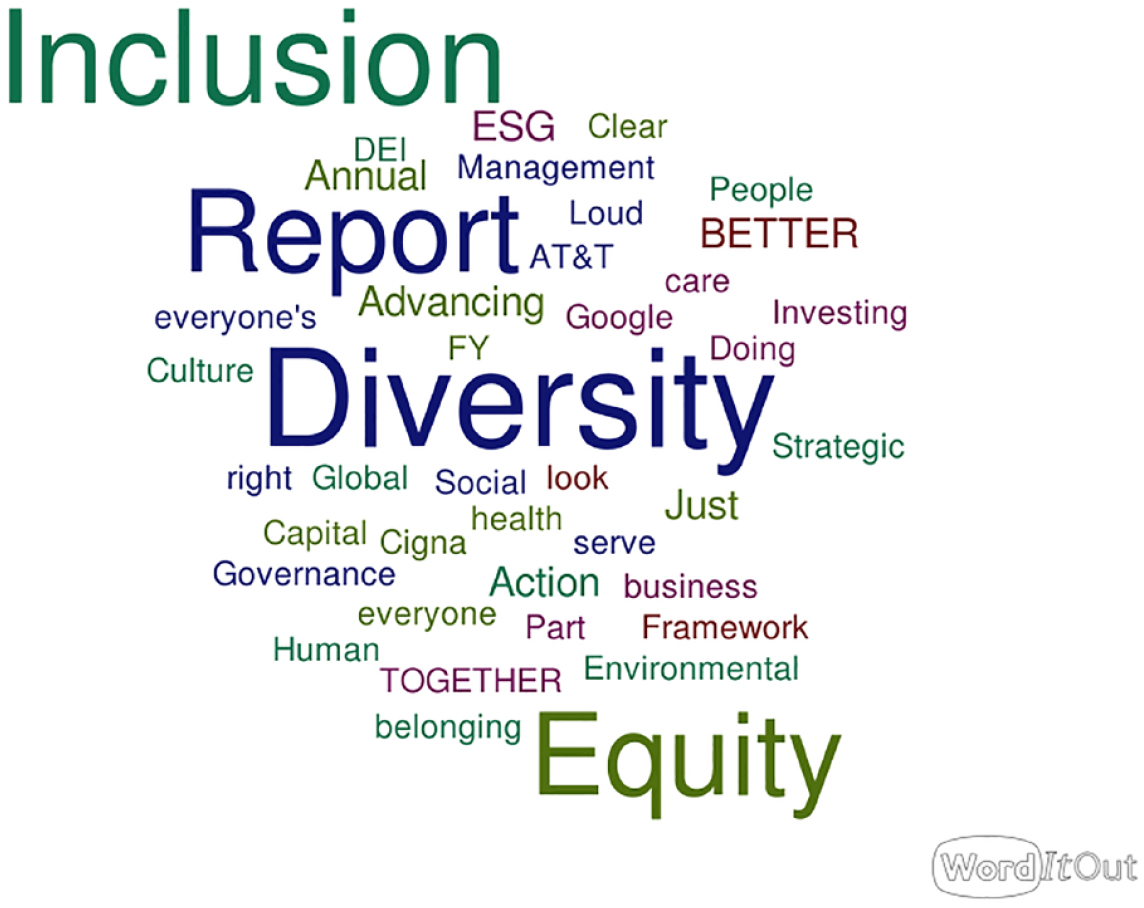
Report titles.
In terms of the form of the report, we observe that PDF versions that are printable might be easier to distribute at board and shareholder meetings, as well as being accessible to investors and for corporate filings, whereas web documents may be more accessible for public consumption, including for international audiences. Still, it may be that the lack of consistency in form might also be attributable to trying to publicly claim or demonstrate a commitment to DEI. Web pages that outline initiatives may be more accessible and open than PDFs or documents that might be printed for meetings.
Design and Visual Elements
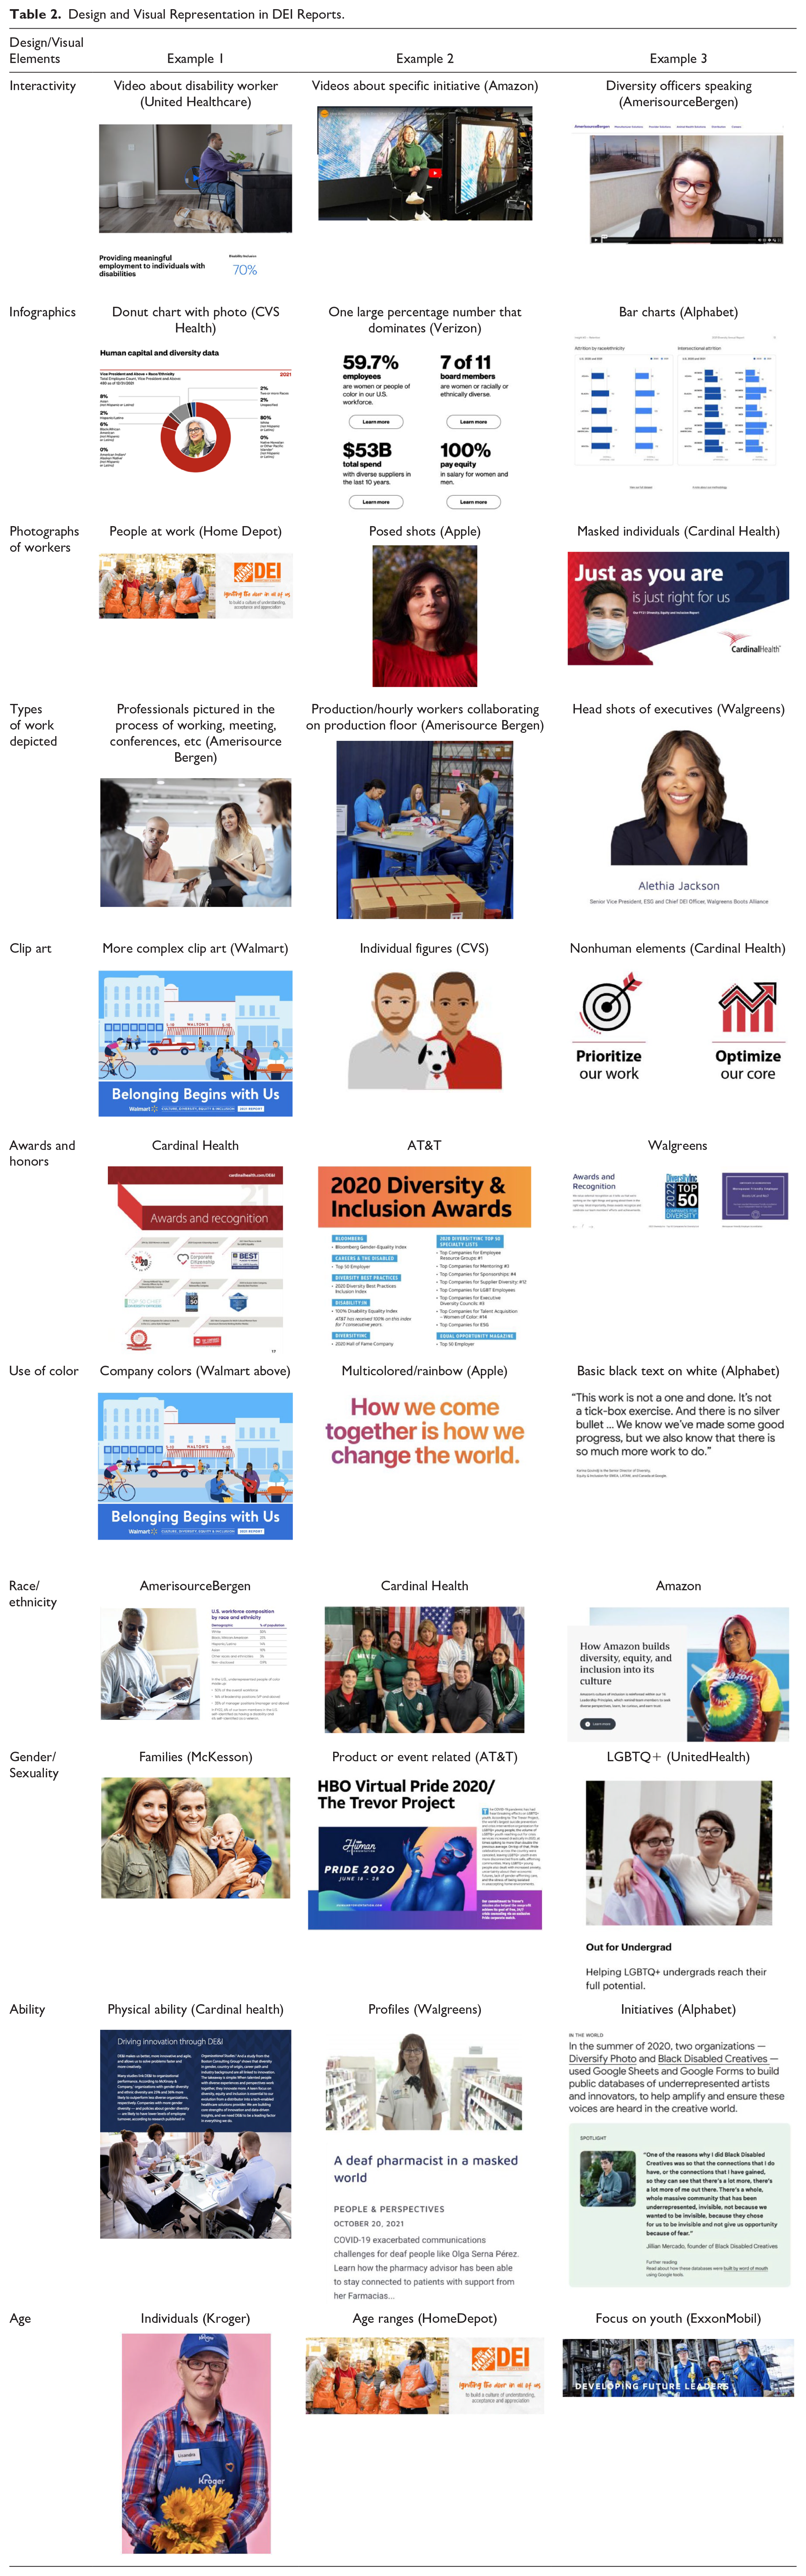
Design and visual representation is our main category for analysis, and in Table 2, we include screenshots and actual images to demonstrate the different ways that companies include various design elements in their DEI reports. There are two main foci here: visual elements such as infographics, photographs, and color and categories of difference, which might include race, gender, age, and ability. The categories that emerged from hand coding include the following:
• Interactivity
• Infographics
• Photographs of workers
• Types of work depicted
• Clip art
• Color
• Race/ethnicity
• Gender/sexuality
• Ability
• Age
Design and Visual Representation in DEI Reports.
As previously noted, these reports take a variety of forms: web and/or PDF. Each adopts a high-quality genre of research report, complete with photos, visuals, and color combinations projecting the company image. The reports are mostly designed with black text on white background, even for web-based information. Where there is need for emphasis, company colors are used as background or in banners to call out text and draw attention to particular content. Some headings are in all caps; paragraphs lead with an informative phrase in bold text, which has the effect of calling attention to that text.
Visuals take the forms of photos of a diverse group of employees and or representing diverse employees in race, gender, ability, veteran/military status and even working parents. Visuals also include graphs, charts, and tables conceptualizing the data in, say, categories of workers (e.g., clinical, technology); employment of women, working parents, disabled individuals, etc. Such figures also capture the global workforce of the company and the number of countries in which it operates. Data visualization techniques are used extensively throughout the reports. Some companies just use a large numerical percentage versus more complex data visuals like graphs or pie charts. Often, corporate intentionality manifests via common DEI initiatives that value representational knowledge focusing on how such initiatives are critical to the workplace and essential to DEI. Tension may arise, however, where employees may be more focused on working in socially just workplaces, while corporations are more interested in what diversity can do for their bottomline (as we discuss below).
Interactive elements we observed include a variety of types of videos, most commonly either promotional videos about a corporate diversity initiative or a diversity officer/executive speaking about the importance of diversity and inclusion at the company. These videos were mostly shorter in length, only 2 minutes or less, and appeared only for companies with web-based DEI materials.
All of the reports, both PDFs and web-based, contained infographics to report demographic information. Companies used a wide variety of infographics, including traditional tables, charts, and graphs augmented with photos and other visual elements to explain and highlight certain information. Many companies also used infographics that featured one large percentage or statistic to focus the reader’s attention on that specific piece of data. Verizon, for example, used a large image of 59.7% to indicate the number of employees who identify as women and people of color.
Like infographics, high-quality photographs appeared in all corporate DEI reports. We identified three trends in these photographs: photos of people at work, posed shots, and single individuals (masked or unmasked). Photos of people at work included both professionals in collaborative situations (such as around a table or a laptop) or production/hourly workers doing their jobs, such as appeared in Home Depot materials. In both situations, the workers were diversely represented across visible categories, including ethnicity, race, gender, age, and ability. Some companies also employed “posed shots,” which were clearly not of actual workers doing their jobs, but carefully selected groups of people or employees that were featured. This was true for both the people-at-work photos and the individual shots. Finally, we noted the interesting feature of individual photos of diverse individuals specifically masked, such as in Cardinal Health’s report. Masked individuals almost exclusively appeared in reports from health care companies (or companies invested in health care), which was another demonstration of their commitment to protecting marginalized individuals.
Photography was also used to depict different types of work. There was a clear split between images of professionals collaborating and production/hourly workers working. As mentioned earlier, these groups were diversely represented and clearly divided among the types of work being completed, with professionals much more likely to be collaborating around books and laptops and production workers completing more manual, hands-on labor. The third type of work depicted came in the form of head shots of diversity leaders and executives. All companies featured photos of a DEI officer or DEI executive in their reports, usually with a head shot and/or written text from that individual. We include headshots here to emphasize that leading diversity and inclusion initiatives is a form of work, and since these leaders are often people of color, it also emphasizes that it is these individuals who are still doing the work of diversity and inclusion.
Interestingly, several companies also used clip art in their reports. What we are calling clip art here is any simplistic, computer-generated image that is not intended to be realistic as much as iconic. Walmart, for instance, used a complex clip art image as the cover for their report, while CVS used individual clip art figures to represent individuals’ diverse attributes. Some companies also used what looked like stock clip art such as a bull’s-eye to depict priorities.
Similar to clipart, many companies featured various awards and honors given to the company because of their diversity efforts. These were clearly evident in many reports, often appearing at the end or bottom of the page/website. Some companies would provide “logos” showing that they received an award or honor from a national business organization while others would simply list their awards and honors. In both cases, there were more than one award shown, and often, like AT&T, multiple categories for awards and honors.
Companies used a great deal of color to emphasize brand identity and priorities. Many reports relied on company colors, such as the iconic Walmart blue or Verizon’s signature red and black. Of interest is that most companies did use traditional black text on a white background for both print and web text. Apple was the only company that used rainbow colors in an animated gif to depict their tag line for DEI, “How we come together is how we change the world.”
As we have already reported, in photographs and clip art, these reports depict a wide variety of diversity among employees, notably, race/ethnicity, gender/sexuality, ability, and age. These photos were often positioned next to discussions of particular initiatives or programs supporting inclusion and creating equity. African Americans were prominently featured in the DEI reports we analyzed, as were Latinx and other ethnic groups too diverse to name here. African Americans were specifically featured next to or nearby text that either reported on workforce demographics or specific DEI programs. When families were depicted, they were clearly either heterosexual or homosexual couples with and without children, and the photos were often positioned close to reporting on a family-focused program or initiative. Ability was also widely depicted in one of two ways: images of someone with a disability that was visually evident, and images of those with a disability that was not visible coupled with text that highlighted that disability. For example, Cardinal Health featured a group of employees working around a table, which included a person in a wheelchair, whereas Walgreens featured an image of a pharmacist with a story about being a deaf pharmacist in a masked world. Age was also a focus in DEI reports and focused on depicting a range of age groups working together, programs that focused on youth, and images of older working adults.
Discussion and Analysis
Corporate reports are rhetorical artifacts (Greenwood et al., 2019) and so are subject to rhetorical criticism, which, as Bitzer and Black (1971) have noted, has long been applied to “any human act, process, artifact, which . . . may formulate, sustain, or modify attention, perceptions, attitudes or behavior” (p. 220). Corporate reports “communicate directions, instructions, organizational messages, or emphasis” (Horn, 1998, p. 181). As we mentioned in the introduction, we are interested to see the rhetorical function of these reports, and the nature of their design is a key indicator. Corporate DEI reports can be considered as tools for achieving a desired equitable future—an epideictic display of the ideas of diversity, equity, and inclusion. To be clear, we do think that the mere presence of the reports indicates that companies have taken a stand for DEI, unlike Berkshire Hathaway, which has chosen to remain neutral. However, remaining neutral is also a stand that stands to be interpreted.
We want to focus on a few specific trends we noticed from each area and some of the conclusions that can be drawn from them. This analysis is by no means exhaustive as there are many different elements in these reports that could be addressed.
The features of the style and substance of DEI reports function as rhetorical components for publicity. They fit within the rhetorical dimension of constructing, promoting, and amplifying a set of interpretations to promote public perception of the corporation. For example, there is diversity in ways that companies visually represent diversity and inclusion, as well as how they design their reports. Of course, there are some commonalities in report writing, but one striking point is the lack of interactivity for most reports, whether web-based or PDF. Only a few corporate DEI websites contained videos or any kind of animation. Apple provides an animation at the opening of its website on DEI. United Healthcare provides a video on accessibility and a few companies provide videos of CEOs talking, but the lack of interactivity seems to indicate that DEI are issues to be reported on rather than interacted with.
As might appear obvious, all reports contained multiple data visualizations, further reinforcing the connections between TPC and data science (Hart, 2013; Kostelnick, 2020). These data visualizations are mostly used to report demographics of the company’s workforce. While those demographics are often divided between categories of workers, such as the difference between executives and production line workers, they can also be lumped together or distinguished by U.S.-based and international data, further supporting the idea that the way diversity is physically represented in reports can operate in a mythmaking capacity.
While diversity is visually represented through charts and graphs, photographic representation is a common way to signify diversity and inclusion. The function of photography is to convey “apparent truthfulness” and “things as they really are” (Brown, 2010, p. 485), and, given that “human capacity to interpret visual patterns is superior” to reading text, photographs are a strategic addition to reports (García-Sánchez & Araújo-Bernardo, 2020). On the other hand, clip art and other nonphotographic components are less likely, unless they are used as design features rather than attempts to represent human people. Walmart, for example, uses a complex piece of clipart as the header for its DEI report. These kinds of images are considered “coded” and are rendered in ways that are impressionable to readers of the report (Greenwood et al., 2019, p. 807). Some companies choose to highlight their diversity officers/executives in their reports by showing their photographic images, quotes, videos, or other statements. These choices function to increase impact by directing the reader toward connection between those images and the intended message.
Most companies prominently featured photos of a DEI officer or executive in their reports, either with a head shot or quote from that individual. The existence of a diversity officer in the report often functions as a way to represent strong leadership for DEI in that company.
Readers might assume that the company is taking action or instituting change because there is a DEI leadership position, despite the fact that statistics still show that it is mostly white men who are in positions of power at U.S. corporations (Guynn & Fraser, 2023). This leadership position, then, serves almost as a narrator for DEI efforts at the company.
Overall, there were more photographs that were posed or staged than there were actual people at work doing their everyday jobs. A notable exception is Home Depot, which showed many photos of workers in warehouses on the job. While these Home Depot photos were of course staged, they still took place in an actual Home Depot store with workers in uniform. We would argue that the fact that photos of diversity must be staged further supports the notion that the reports seek to present a future image of what a company wants DEI to be and not what is actually happening in the company. As García-Sánchez and Araújo-Bernardo (2020) have observed, “systematic studies of the use of photographs in corporate reports suggest rhetorical purposes to convey certain aspects of corporate identity and performance, while hiding others (p. 1120). In their work on sustainability reports, they show that “companies present images that do not reflect reality in a neutral and transparent manner, creating an idealised representation of the company, its alleged concern for the environment, or its positive relationships with stakeholders. They can even hide the negative externalities that are found in reality” (García-Sánchez & Araújo-Bernardo, 2020, p. 1120).
In the design of the reports, we can see their emphasis on certain content—such as juxtaposing images of Black people with stats on hiring; or presenting individuals with visible disabilities with the intent to reinforce some rhetorical significance. In those instances, accompanying text shapes the meaning of that image to promote a desired company ethos. Furthermore, many DEI reports and webpages depict ethnically diverse individuals rather than diverse groups working together. In many cases, we see these images as attempts to cover every category of difference by providing visual evidence of that difference. Many reports will contain pages of images depicting individuals representing marginalized groups such as LGBTQ+, veterans, working families, physically disabled employees, people of color, and more. Through these depictions, diversity seems to indicate a singular feature exemplified by an individual category that can be depicted visually. While DEI representation is constituted by a discernible and visible difference, we know that there are various forms of invisible disability that have no visible markers. And such choices, as Greenwood et al. (2019) noted, set the tone for how the report should be read, directing the reader to the ethos of the corporation.
Finally, one trend we noticed that we struggled to classify was the use of “badges” for diversity awards given to the company. These were numerous and evident in many reports, often appearing at the end of the document. AT&T, for instance, provides a long list of diversity and inclusion awards. Walgreens provides a couple of awards, including an image for being one of the “top 50 companies for diversity” and a “menopause friendly” employer accreditation. We theorize that these images function almost as a badge of honor, or a rhetorical device to demonstrate that peer institutions have recognized them for their diversity efforts and so the efforts contained in the report must be effective. These awards serve as a form of impression management in which the listing of awards provides evidence that the company’s diversity initiatives are valid and meaningful.
As we reviewed these reports, we saw impression management as part of a larger tension between different discourses that support DEI in the workplace. Byrd and Sparkman (2022) outline two such discourses: the business case and the justice case. The business case is predicated on three tenets: businesses should recruit from a wide range of backgrounds, identities, and cultural groups to attract and retain the highest quality talent; a diverse workforce is required to reach a global customer base; and a heterogeneous workforce outperforms a homogenous one in problem-solving and creative activities (p. 80). As such, the business case privileges organizational image and economics (p. 80), which is part of impression management, mythmaking, and aspirational futures. In contrast, the social justice case for DEI “uses a moral perspective for viewing the lived experiences of socially marginalized groups. Morality and lived experiences of social marginalization are therefore strong influencers for the social justice case” (p. 84). The social justice case acknowledges inequity and focuses on DEI as a way to create just structures and enact equity. We saw evidence of arguments for both of these cases throughout the DEI reports we analyzed, indicating that companies use them to speak to audiences amenable to both cases. Of course, as Colton and Holmes (2018) have argued, emphasizing equity aligns with intentional, rhetorically effective practices (p. 12). And we cannot definitively conclude that this is the case.
To that end, the panoply of content featured in DEI reports features internally driven initiatives such as hiring and retention of diverse populations, establishment of affinity groups, military/veteran, family programs, and other antiracist efforts (Glassman & Glassman, 2017). The key components of diversity—training, valuing others, self-development, team building, mentoring, nurturing, etc.—feature prominently in these reports to project a positive corporate image and build public trust and confidence. But if employees want a just working environment, we argue that companies want to appear to create that working environment. And that often happens through external documents such as DEI reports. As such, the content appears to build a business case for DEI more than a moral or social justice one. The business case is not just about how good diversity is for business but also about retention and projecting a public image of inclusiveness. In building a public image of a DEI advocate, these reports rely on a utilitarian ethics masquerading as care. After all, if companies comprehensively practiced equity and inclusion, the DEI report might look very different.
Conclusion and Future Directions
We began this article with a catalog of prominent instances of direct corporate intervention in the social issues of our time—an observable trend, which, along with the proliferation of corporate DEI reports, motivated our study. We live in a nation that historically has marginalized individuals on the basis of race, gender, and disability, among others, which has motivated individual, legislative, and social movements to eliminate these inequities. Thus, when we noticed initiatives for DEI in the workplace, we hypothesized that corporations were using their identity as autonomous beings to advance a just and inclusive society.
Through examining the rhetorical functions of corporate DEI reports, our analysis reveals design choices that are largely supportive of corporate interests and public perception of their DEI initiatives. Corporate DEI initiatives are themselves an invention of capitalism and are good for business both in terms of productivity and customer reach. Thus, Byrd and Sparkman’s “business case” argument is more about creating the impression of an aspirational future than supporting an existing or soon-to-be established reality. And yet recent moves by state legislatures to compel companies to ditch these efforts is rooted in the misguided association of DEI with big government mandates (Williams, 2022). Our analysis of design and visual representation indicates that for the most part, these reports advanced a business case that masquerades as a justice one, making readers feel good about the activities of these companies. In reality, justice-based rhetorical strategies are used to bolster the business case, potentially confusing readers in understanding what is social justice and what is good business.
Colton and Holmes (2018) outline the difference between active and passive equality, noting that many forms of social justice today can be seen as passive models of enactment: “passive equality describes systems of political organization, wherein humans are viewed as receivers of equality distributed by an organization or a state rather than active enactors of equality” (p. 5). We can see that the business case for DEI models itself on the idea of passive equality; the company or organization promotes programs that provide an image of distributed equality, but there is very little active engagement or change on the part of individual employees, the company, or the public. True social justice would follow the seven guiding principles for DEI as outlined by Beach and Segars (2022): build a moral case, encourage willful interrogation, develop new models, adopt entrepreneurial leadership, ensure accountability, Expand the boundary, and be ambitious (p. 31). Each of these principles make DEI a priority by enacting change at both individual and corporate levels, not because it is good for the bottom line but because it is the right thing to do. Indeed as Chen and Hamilton (2015) found, historically marginalized persons consider an organization diverse if the marginalized are not only represented but socially accepted.
Connections to Teaching and Learning
While our analysis exposes elements of these reports as a form of corporate “mythmaking” (David, 2001), the general population may see these reports as solid evidence of progress. We see the classroom as one space where we can educate students on the impact of their rhetorical choices in report writing given that DEI reports can seemingly promote active equality when really they are using the idea of equity as a visual representation to bolster corporate image. We feel strongly that it is important to incorporate DEI reports into the Technical and Business Writing classrooms because students need to understand how to read and write them, for what is both visible and invisible. As corporations blur the lines between business and advocacy for people and the environment, we can use these reports as pedagogical tools to help students examine how capitalism is being reimagined as a vehicle for social responsibility—one that values the entire strata of a business entity, not just shareholders.
DEI reports not only introduce students to a new genre of corporate reporting and disclosure, they also enable them to pay attention to the functions performed by the observable patterns of the discourse of DEI reports. Students, as future employees and executives, can analyze DEI reports to see what are considered active and passive forms of equality. Student perspectives on the effectiveness of different rhetorical functions can serve as openings for discussing biases with respect to coworkers and ways to innovate approaches to presenting DEI progress in an organizational context. As pedagogical tools, corporate DEI reports can develop students’ recognition and understanding of certain rhetorical functions.
Visual representation/design is a core learning outcome for most TPC courses so incorporating visual analysis of DEI reports allows instructors to educate for equity within standard course expectations. We see two related approaches for educating students about DEI reports: analysis and production. Students can be asked, first, to analyze an existing DEI report. Following that, students can be asked to theorize the choice of report titles and names, analyze the design choices the report takes, detail and compare the contents, and position all of that information within the larger corporate ecosystem. Such an analysis can be a fruitful initial stab at better understanding the rhetorical function of these reports. Students could be challenged further to comment on the contents of reports by asking questions like, What constitutes progress with respect to DEI? What are external indicators of progress and what serves as just window dressing? How do these reports function rhetorically? How are they circulated? Who are their audiences? Just answering these questions can open up a rich discussion of the ways that business documents function for organizations.
An additional assignment that might be used asks students to analyze at least one DEI initiative and position it within the context of the corporate sphere. If we establish that company initiatives such as affinity groups are necessitated by the historical inequalities embedded in company structures and society as a whole, we can assess these initiatives for what they are: attempts to shore up diversity and promote equity and inclusion in the workplace in a very passive way. Companies may not be able to eliminate discrimination, but they can promote the well-being of all people through actively creating inclusive workplaces that eschew or, better yet, not subject individuals to interpersonal bias and prejudice. Having students analyze these initiatives and their importance can help introduce them before graduation to the significance of approaches that help marginalized employees and other stakeholders. As Bay (2022) has shown, this is not without some resistance, but it is a productive resistance.
Finally, we feel strongly that students can learn by practicing writing DEI reports themselves. Students could rewrite and redesign sections or entire reports based on earlier analysis of DEI reports while posing questions such as, What approaches did they find persuasive and why? How did those reports present information in a way that was appealing and what made them appealing? What are the implications of those rhetorical choices, especially with respect to different audiences? We also see such an assignment fitting into an engagement approach where students could work with small business owners or local governments to consider how their documents can be written and designed to promote equity. All of these assignments can be scaffolded so students have experience with analysis and the different possible components of these reports before they go on to actually write or design one themselves.
If we want students to enact social justice in their workplaces and communities, then we need to show that merely writing a report may not serve as taking action. While this genre can be a powerful indicator for change, the DEI report can also make both consumers and producers feel like they are promoting social justice rather than do the work of creating active equality.
Footnotes
Declaration of Conflicting Interests
The author(s) declared no potential conflicts of interest with respect to the research, authorship, and/or publication of this article.
Funding
The author(s) received no financial support for the research, authorship, and/or publication of this article.