
Abstract
Background:
All-suture anchors (ASAs) are increasingly used in biceps tenodesis (BT), and their fixation strength may vary with cortical bone and surgical position. Defining the influence of bone mineral density (BMD) on ASA pullout strength and failure mode across the high bicipital groove (HG), low bicipital groove suprapectoral position (SUP), and subpectoral (SUB) positions may allow for optimal anchor placement.
Hypothesis:
ASA biomechanical characteristics at each region of the bicipital groove would improve with increasing regional BMD.
Study Design:
Controlled laboratory study.
Methods:
ASAs measuring 2.6 mm were inserted into the HG, SUP, and SUB positions of the bicipital groove of 12 cadaveric specimens. Local measures of bone quality around each anchor were evaluated using micro–computed tomography. Afterward, each ASA was biomechanically loaded to failure to determine the ultimate pullout strength and mode of failure. Repeated-measures correlations were calculated to determine the relationship between measures of bone quality and pullout strength.
Results:
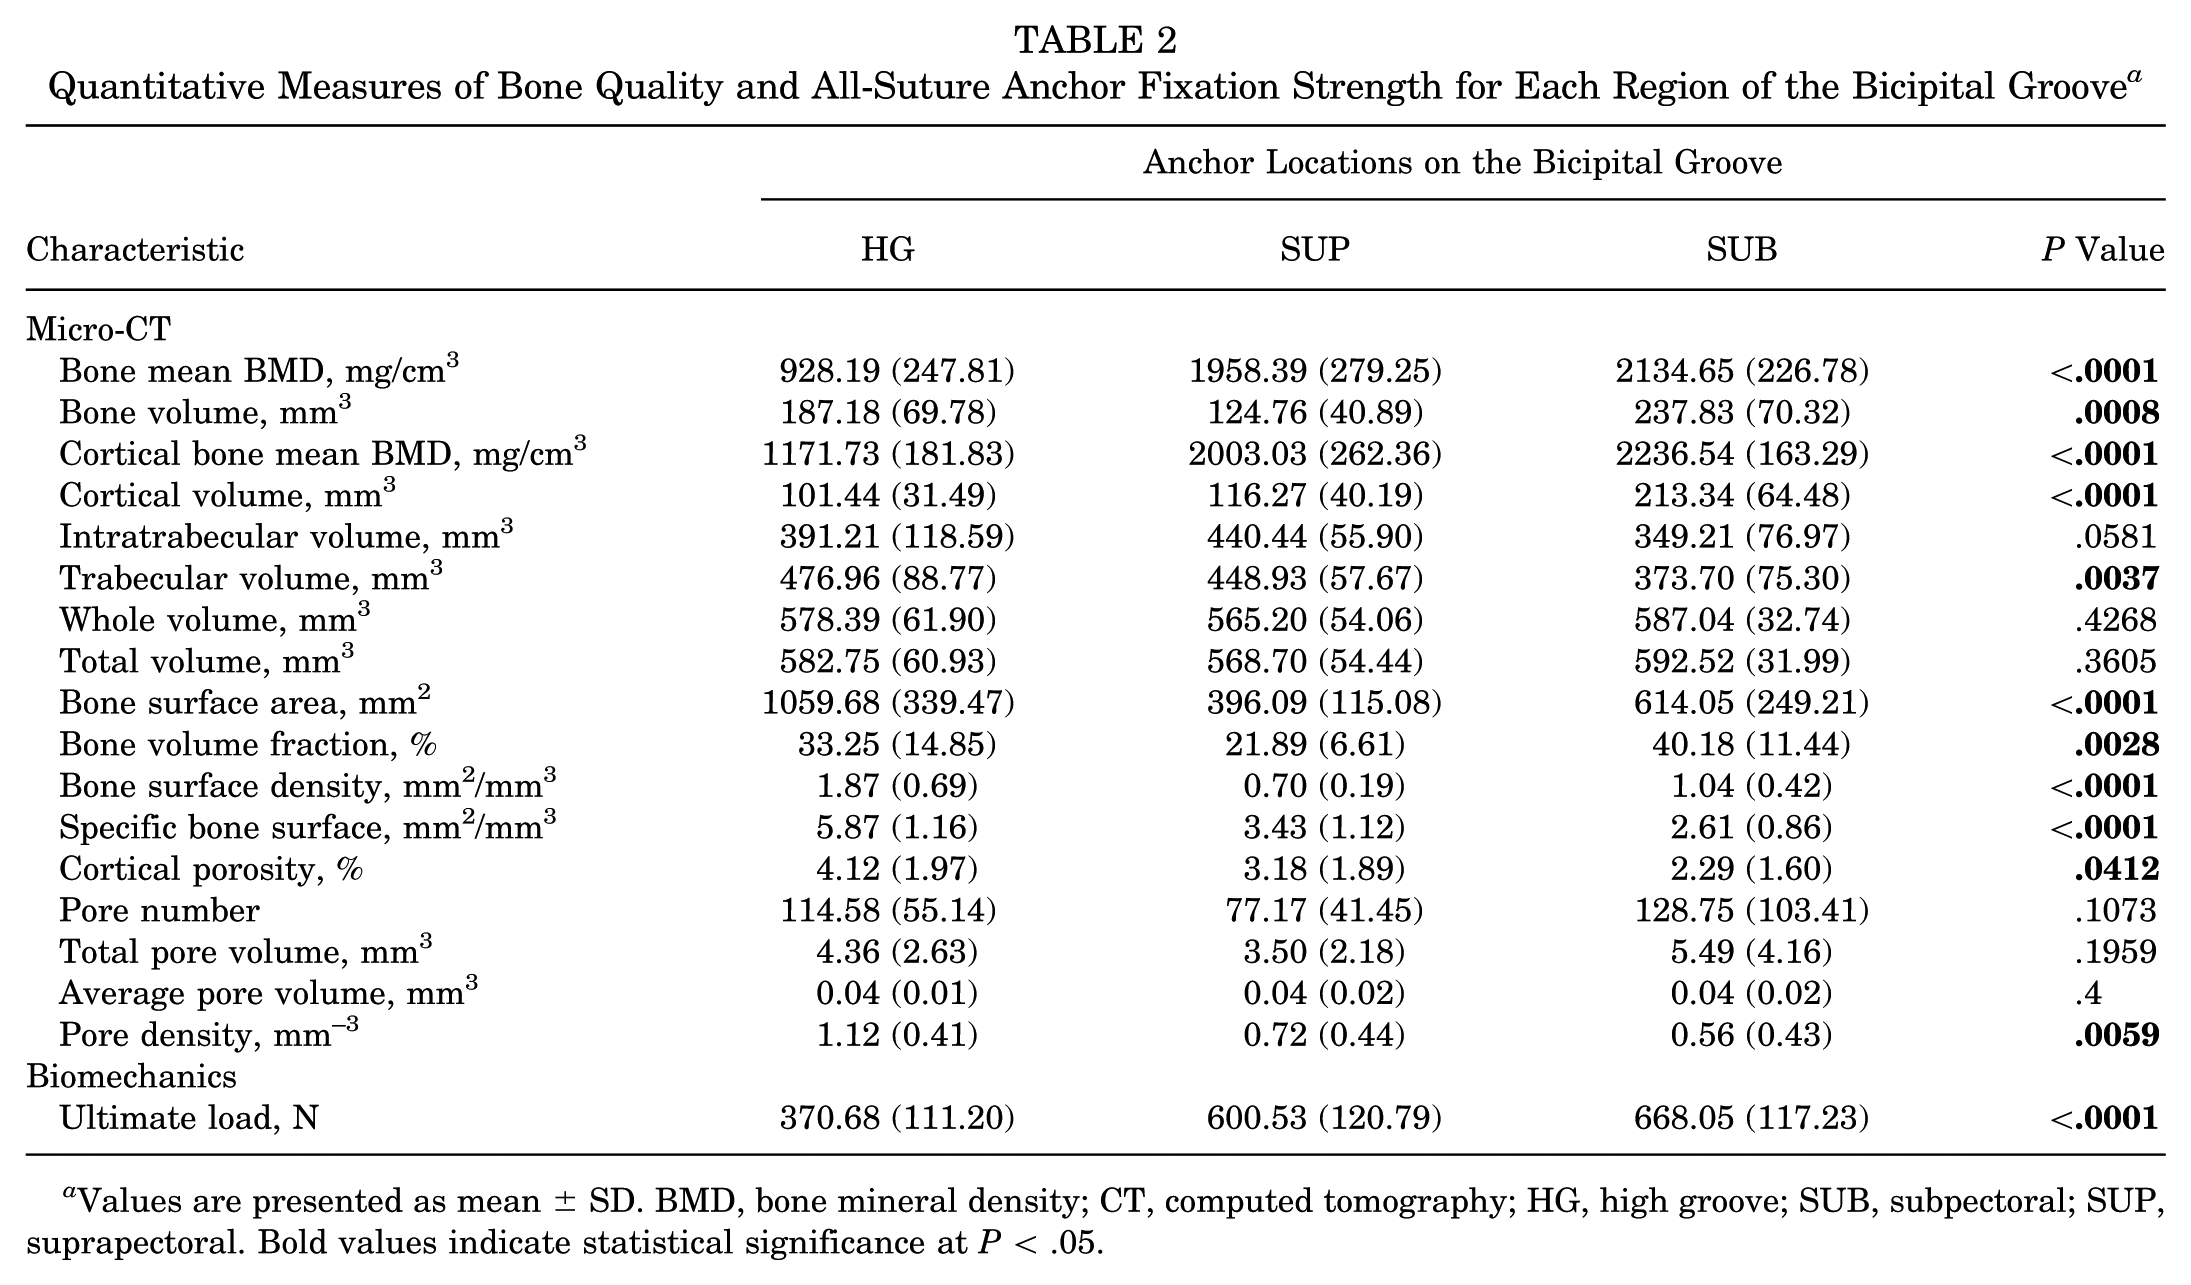
Mean load to failure of ASAs placed in the HG, SUP, and SUB positions were 370.7 ± 111.2 N (95% CI, 300.0-441.3 N), 600.5 ± 120.8 N (95% CI, 523.8-677.3 N), and 668.1 ± 117.2 N (95% CI, 593.6-742.5 N), respectively. Mean load to failure of ASAs placed in the SUP and SUB positions was significantly greater than in the HG position (P < .01). There was no significant difference in mean pullout force between the SUP and SUB positions. The most common mode of failure was anchor pullout in the HG (100%) and suture breakage in the SUP (58%) and SUB (75%) positions. Mean BMD and cortical BMD were significantly greater in the SUP and SUB positions compared to the HG position (P < .05). Pullout force measured throughout the bicipital groove was significantly correlated to cortex mean bone density, cortex volume, mean BMD, and bone volume (P < .01).
Conclusion:
ASA pullout strength was correlated with local cortical BMD. ASA fixation strength and BMD were robust in all tested regions of the bicipital groove but were greatest in the SUP and SUB positions.
Clinical Relevance:
ASAs can effectively be placed throughout the bicipital groove. ASAs in all 3 tested positions can withstand not only the force reportedly placed on the anchor by the native biceps but also the force previously reported to cause failure at the suture-biceps tendon interface. These biomechanical findings add to the growing clinical and basic science evidence supporting the use of ASA for BT.
Keywords
The long head of the biceps tendon (LHBT) is an increasingly recognized source of anterior shoulder pain. 23 Both biceps tenodesis (BT) and biceps tenotomy are effective treatment options for LHBT pathology, but national trends demonstrate that the rate of BT is increasing.7,33,41 A variety of fixation methods have been described and compared for BT, including interference screws, cortical buttons, and either hard body or soft all-suture anchors.* BT may be performed high in the bicipital groove (HG) within the shoulder joint (HG), low in the bicipital groove and suprapectoral (SUP) position, or the subpectoral (SUB) position.14,15 BT in the HG is an arthroscopic procedure, whereas low SUP may be completed either arthroscopically or open, and SUB is performed open.15,23 Advocates of low SUP and SUB BT argue that excising the proximal portion of the LHBT and removing it from the proximal bicipital groove limits residual tenosynovitis within the remaining biceps sheath, which may reduce continued postoperative pain. 23 Alternatively, proponents of arthroscopic HG BT suggest that equivalent clinical outcomes can be achieved with a minimally invasive approach while reducing the risks of infection, neurovascular injury, or wound complications seen with open procedures.17,42
All-suture anchors (ASAs) are the most recent innovation in BT implant materials and are being used more frequently in a variety of clinical applications requiring soft tissue to bone fixation in the shoulder.12,39 Key advantages of ASAs include their small diameter, minimal bone removal, ease of insertion, reduced occupancy of the healing surface, and a reduced risk of complications compared to traditional anchors.1,30,39 In the specific context of BT, the smaller cortical hole required to insert the ASA can potentially decrease the risk of iatrogenic postoperative humeral fractures under torsional stresses.8,11,13,29,34 Furthermore, previous studies suggest that the clinical performance of ASAs for biceps tenodesis is equivalent to hard body anchors.9,12,18,25,39
ASA fixation strength is dependent on the integrity of the supporting cortical bone, which varies throughout the humerus.27,38 Previous studies have detailed the distribution of proximal humerus bone density2,28,38 and that a reduction in cortical bone density increases the risk of ASA failure.16,22,25 There are currently limited data on the relationship between ASA pullout strength and bone quality in the different regions of the bicipital groove where BT is typically performed. Therefore, the purpose of this study was to evaluate and compare ASA pullout strength and regional bone quality of the HG, SUP, and SUB positions in the bicipital groove. In the present study, it was hypothesized that ASA fixation strength at each location would increase with increasing regional BMD.
Methods
Specimen Participation
Institutional review board approval was not required for this laboratory investigation using deidentified cadaveric specimens. Twelve shoulder specimens (6 male and 6 female) with a mean age of 65 ± 6.37 (range, 52-74) years and no signs of deformity or previous shoulder surgeries were procured from an institute-approved tissue bank (Science Care) and stored at −30°C. Prior to testing, each shoulder was dissected to remove all soft tissue, the clavicle, and the scapula to isolate the humerus. Tagging sutures were placed into the superior and inferior aspects of the pectoralis major tendon prior to tendon removal to direct later bicipital groove anchor placement.
Anchor Selection and Insertion
Anchors were placed into the HG, SUP, and SUB positions in the bicipital groove (Table 1 and Figure 1). All measurements were taken via a digital caliper. A 2.6-mm FiberTak (Arthrex) all-suture soft anchor, double-loaded with sliding 1.3-mm SutureTape (Arthrex), was placed into each location and inserted according to the manufacturer's recommended technique. The circumferential teeth drill guide was placed at a 90° angle to the humerus and confirmed using a goniometer. The 2.6-mm drill bit was inserted through the guide and used to predrill a socket for anchor insertion. The drill bit was removed, and the 2.6-mm FiberTak all-suture anchor was inserted through the drill guide and malleted into the bone. The drill guide and anchor inserter were removed. Gentle tension was applied to the sutures to set each anchor on the deep aspect of the humeral cortex. All anchors were confirmed to be appropriately set by tactile feel. The sliding sutures were then hand-tied 3 cm from the humerus with 10 alternating half-hitches.
Anchor Insertion With Anatomic Specifications
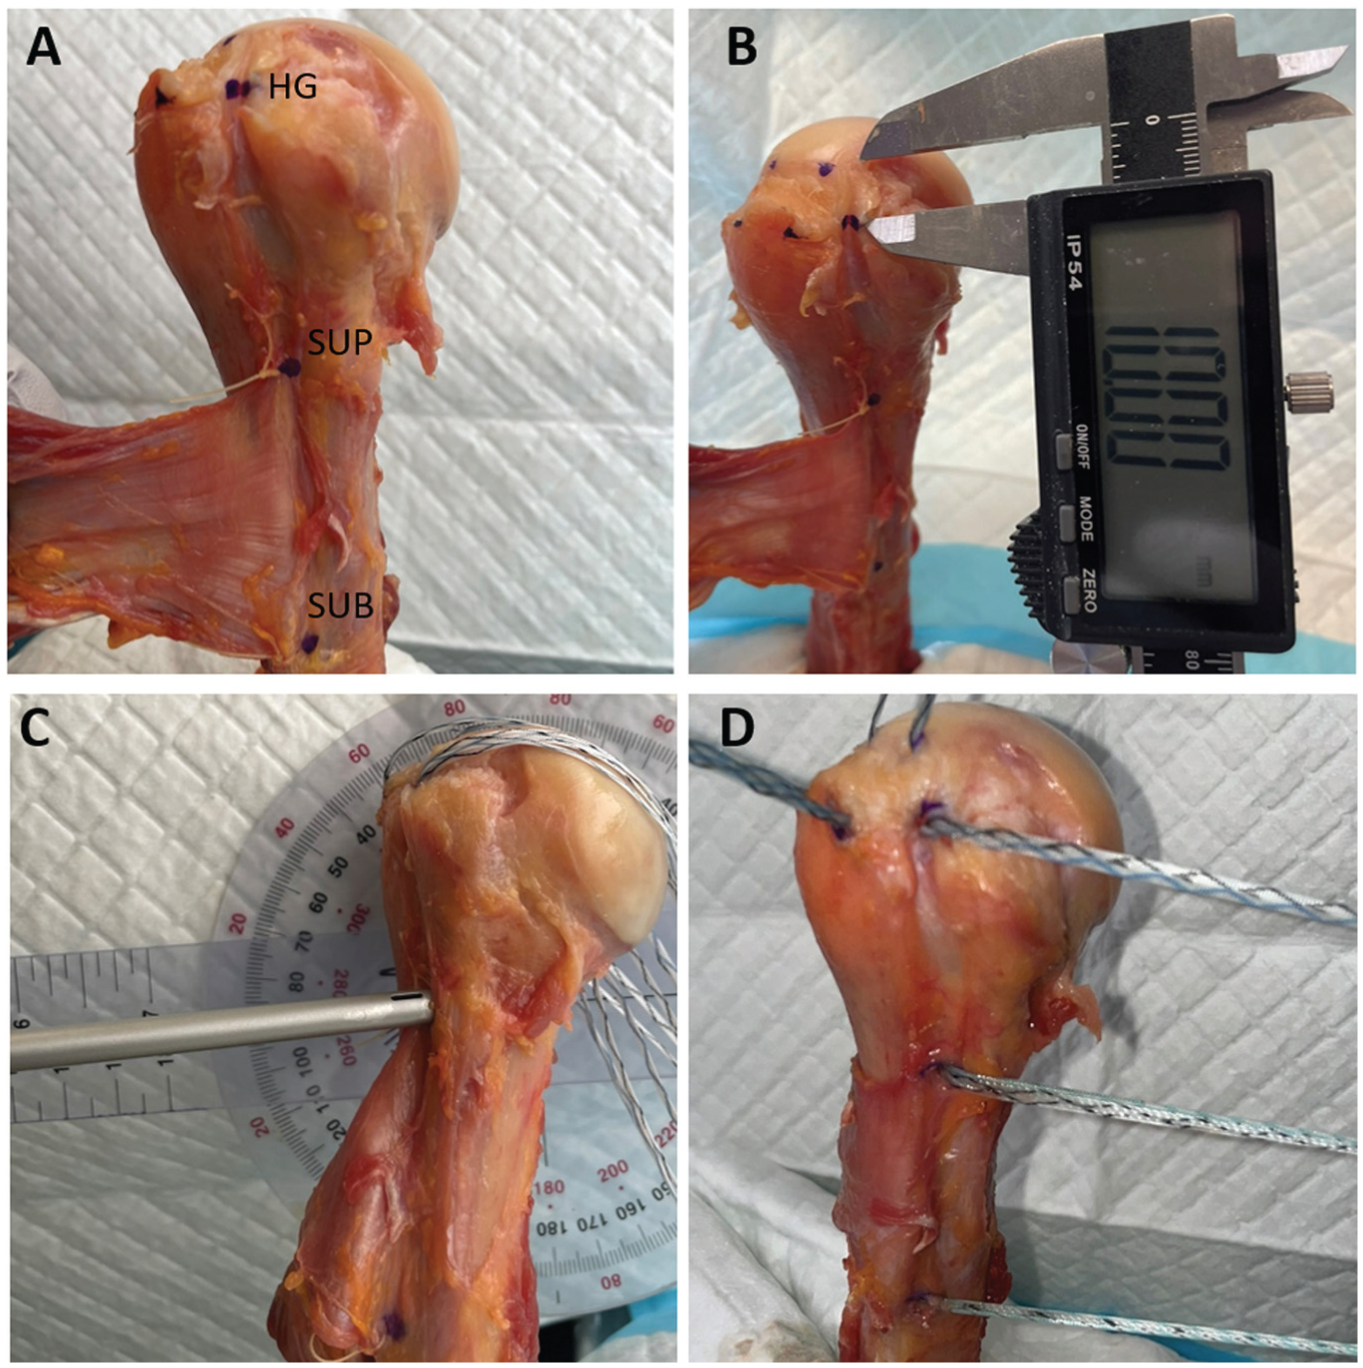
(A) The marked points indicate the insertion locations for the high groove, suprapectoral, and subpectoral anchors into a right cadaveric humerus bicipital groove. (B) The high groove anchor was placed 10 mm distal from the articular margin, the suprapectoral anchor was at the superior margin of the pectoralis major tendon, and the subpectoral anchor was at the inferior margin of the pectoralis major tendon. (C) Anchors were placed at a 90° angle in relation to the humeral axis. (D) A 2.6-mm FiberTak all-suture soft anchor was inserted into each marked location. Four additional anchors were placed into the greater tuberosity for later analysis. HG, high groove; SUB, subpectoral; SUP, suprapectoral.
Micro–Computed Tomography
Bone quality around each anchor was assessed via micro–computed tomography (CT; vivaCT 40; Scanco Medical AG) prior to biomechanical testing. Microtomographic slices were acquired using a 55-kVp potential and reconstructed at a voxel size of 35 μm. Each anchor location was identified, and a spherical volume of interest (VOI) centered on the bone tunnel with a radius of 5 mm was defined for evaluation (Figure 2). Bone microarchitecture was analyzed via image-processing software (Analyze 14.0) to determine the following outcome measures: mean bone mineral density (BMD, mg/cm3), cortical BMD, bone, cortex and trabecular volume (mm3), bone surface area (mm2), bone volume fraction (BV/TV %), surface to volume ratio (BS/BV), and porosity (number and density, mm3).

(A, B) Three-dimensional reconstruction, (C) sagittal microtomographic slide, and (D) axial microtomographic slide of the bicipital groove demonstrating the 5-mm spherical volume of interest.
Biomechanical Testing
The distal humerus was potted and attached to the frame of a mechanical testing system (370.02 Bionix Testing System; MTS Systems Corp) in a custom jig. Specimens were positioned to accommodate a pull inferior and parallel to the humeral axis, simulating the physiological traction of the LHBT (Figure 3). The suture ends of each anchor were secured to a hook attached to the actuator of the MTS machine for load application. After an initial 2-N preload, cyclic loading of 5 to 20 N was applied for 10 cycles. The anchors were then pulled to failure at a rate of 1 mm/s, with failure defined as either anchor disengagement from the bone-anchor interface or suture breakage. The order in which the anchors were tested on each cadaver was randomized. Ultimate load at failure and mode of failure were recorded for each anchor.

Biomechanical testing setup with a left humerus. Sutures were pulled parallel to the humeral axis via a hook that was positioned through a hole in the potting material and attached to the MTS actuator.
Data Analysis
A sample size of 10 was determined to be sufficient based on previously reported means and standard deviations for rotator cuff repairs comparing BMD and metal versus biodegradable sutures, 37 with a calculated effect size of 1.2, an α error of 0.05, and power (1 –β err probability) of 0.80 (G*Power 3.1.97). A mixed linear model with a random effect to account for multiple readings from the same specimen was used to determine differences in pullout strength and measures of bone quality between anchor locations, followed by Tukey pairwise comparison. Repeated-measures correlations were calculated to determine the relationship between measures of bone quality and pullout strength. All statistical analyses were performed using R software (R Core Team), and statistical significance was set at .05.
Results
Micro-CT
There was no significant difference in the average recorded spherical volume of interest for each insertional site (P = .43). The mean BMD and bone volume were significantly greater in the SUP and SUB locations compared to the HG insertion site (P < .001) (Table 2). The mean cortical BMD was significantly different among all 3 locations, with SUB having the greatest BMD (2236.5 mg/cm3), followed by SUB (2003.0 mg/cm3) and HG (1171.7 mg/cm3) (P < .0001). Mean cortical volume (m3) and trabecular volume were both significantly greater in SUP compared to the other 2 locations (P < .0001 and P < .01, respectively).
Quantitative Measures of Bone Quality and All-Suture Anchor Fixation Strength for Each Region of the Bicipital Groove a

Values are presented as mean ± SD. BMD, bone mineral density; CT, computed tomography; HG, high groove; SUB, subpectoral; SUP, suprapectoral. Bold values indicate statistical significance at P < .05.
Biomechanical Testing
Mean load to failure of ASAs placed in the HG, SUP, and SUB positions was 370.7 ± 111.2 N (95% CI, 300.0-441.3 N), 600.5 ± 120.8 N (95% CI, 523.8-677.3 N), and 668.1 ± 117.2 N (95% CI, 593.6-742.5 N), respectively (Table 3). The ultimate load to failure of ASAs placed in the SUB and SUP positions was significantly stronger than in the HG position (P < .01). There was no significant difference in load to failure between anchors placed in the SUP and SUB positions (P = .33). In the HG, all ASAs failed by pulling out of the bone with no suture breakage (Table 3). In the SUP position, ASAs failed by suture breakage and anchor pullout from bone in 58% and 42% of specimens, respectively. In the SUB position, ASAs failed by suture breakage and anchor pullout from bone in 75% and 25% of specimens, respectively. In the SUP and SUB positions, significantly greater load was required to cause suture breakage than anchor pullout. There were no significant differences in load to failure between the SUP and SUB positions when grouped by mode of failure as either suture breakage (P = .27) or anchor pullout (P = .25).
Mechanism of Failure for the 3 All-Suture Anchor Locations a

NA, not applicable.
Overall, the ultimate load to failure was significantly positively correlated to the mean BMD (P < .0001), cortical BMD (P < .0001), and cortical volume (P < .04) (Figure 4). Conversely, ultimate load to failure was significantly negatively correlated to the mean bone volume fraction (P < .001), bone surface density (P < .001), and specific bone surface (P < .01).

(A) Overall bone mineral density and (B) cortical bone mineral density were both significantly correlated to ultimate load to failure. BMD, bone mineral density.
Discussion
The key finding of this study was that mean cortical BMD and fixation strength of ASAs were greatest in the suprapectoral and subpectoral positions of the bicipital groove compared to the high groove position. The hypothesis that ASA biomechanical characteristics throughout the bicipital groove would improve with increasing regional BMD was validated. ASA fixation strength was mechanically sufficient in all 3 tested regions. The ultimate load to failure of ASAs in each position was greater than the reported 110 N placed on the anchor by the native biceps and greater than the reported 250 N required to cause failure at the suture-biceps tendon interface.3,6,10,13,20,36 Clinically, this suggests surgeons can have confidence in the strength of ASAs used for biceps tenodesis in all 3 locations in the bicipital groove.
There is an abundance of literature describing BT techniques and their outcomes; however, there is currently no consensus on the optimal implant choice or surgical technique. Multiple fixation methods have been described for high-groove and low-groove SUP and SUB BT, including interference screws, cortical buttons, and hard- and soft-bodied suture anchors.4,5,10,13,16,19,20 A recent meta-analysis of biomechanical studies 9 reported that the mean load to failure for inference screws, cortical buttons, and sutures anchors was 173.0 N at the SUP position and 191.4 N at the SUB position.5,10,13,16,20 No statistical differences were found between fixation methods or tenodesis locations. 9 In this present study, the mean load to failure in the HG, SUP, and SUB positions was 371 N, 601 N, and 668 N (P < .0001), respectively, which far exceeds the values reported in the meta-analysis. The relatively large difference in load to failure is due to differences in the testing methods between our study and the previously listed studies. Previous studies loaded the cadaver's biceps tendon, which was secured to the humerus via tenodesis anchors, whereas in the present study, the ASAs’ high-strength tape sutures were directly loaded, thus bypassing the suture-tendon interface. The suture-tendon interface is repeatedly cited in anatomic biomechanical studies as the most common mode of BT failure, with suture pullout from the biceps tendon occurring at or below 250 N in most studies.6,10,13,20,36 Our study eliminated this known weak link and recorded the mean load-to-failure values at the bone-anchor interface, which explains the greater values compared to those previously reported in the literature.
The mode of failure in this study in the SUP and SUB positions was either anchor pullout from bone or suture breakage, which occurred at a mean of 527.8 N and 691.2 N, respectively. Clinically, the strength of BT constructs is recommended to exceed 110 N, which is the force needed to hold 1 kg at 90° of elbow flexion, estimating the load during biceps rehabilitation and daily activity.3,20 This present study demonstrates that ASAs placed in all 3 anatomic positions can easily withstand the required 110 N of force placed on the anchor by the native biceps during healing. Furthermore, the load to failure of the ASAs tested far exceeded the 250 N of force required to cause failure at the suture-biceps tendon interface. At forces greater than 250 N, failure would first occur at the suture-biceps tendon interface while the ASA would remain secure to the bone. Ultimately, this biomechanical study supports the use of ASAs placed in all 3 anatomic positions. To further improve BT constructs, future studies are warranted to improve the characteristics of the suture-tendon interface.
In the present study, ASA pullout strength was correlated to BMD. Previously, studies have demonstrated that humeral proximal diaphyseal cortical bone, where the SUP and SUB anchors were placed, is stronger than humeral proximal metaphyseal cortical bone, where the HG anchor was placed.35,40 Our results corroborate these findings as ASA pullout strength was significantly greater in the SUP and SUB positions compared to the HG position. ASAs rely on intact cortical bone for fixation, and previous biomechanical studies have reported the correlation between ASA pullout strength and cortical BMD in cadaveric specimens.25,26,32,37 Ntalos et al 25 demonstrated that ASA pullout force is correlated with humeral cortical thickness and not correlated with cancellous BMD. Oh et al 26 reported that ASAs exhibited higher ultimate load to failure in higher-density bones in a synthetic bone model. In our study, the suture often failed prior to ASA pullout. The highest recorded load to failure was 898 N, which was reported in an ASA in the SUB position. This further highlights ASAs’ fixation strength when placed in robust cortical bone, underscoring their potential clinical value.
There are significant strengths and clinical implications of this present study. While studies have biomechanically compared implants in the SUP and SUB regions of the humerus, our work uniquely compares ASA placement in the proximal high bicipital groove and low immediate suprapectoral bicipital groove positions. Our results demonstrate that BMD and ASA fixation strength are acceptable in the HG, SUB, and SUP regions of the bicipital groove and provide biomechanical support for ASA use in all 3 locations. While the load to failure was greater in the SUB and SUP regions, the strength of the bone-anchor interface for all 3 locations far exceeds previously published failure loads at the suture-tendon interface.6,10,13,20,36 Surgically, this indicates ASAs will be secure if placed in all 3 tested locations.
There are several limitations to this biomechanical cadaveric study. As with any cadaveric study, the BMD in specimens may differ from the BMD in patients undergoing BT, which may limit clinical translation. The reported fixation strength and bone quality tested are at time zero after surgery, without taking into account clinical healing or postoperative changes. Elongation of the construct and suture fraying due to repetitive cyclic loading, which both may be encountered postoperatively, were not evaluated. In addition, this study only evaluated suture anchor pullout from bone and did not assess the suture-tendon interface, which is reportedly the most common mode of BT failure. Finally, there were limitations when comparing our biomechanical and µCT results to previous studies due to differences in testing protocols and acquired specimens. In studies reporting suprapectoral BT, there were likely differences in anchor location, either intra-articular into the high groove or into the low-groove suprapectoral position.
Conclusion
ASA pullout strength was sufficient in all regions of the bicipital groove and was significantly correlated to local cortical BMD. ASA load to failure was greatest in the SUP and SUB positions compared to the HG position. The biomechanical fixation strength of ASAs in all tested positions far exceeds both the clinical requirements and the force required to cause failure at the suture-tendon interface, as this remains the most likely point of failure when using ASAs.
Footnotes
Acknowledgements
The authors thank Arthrex for supporting this research.
Final revision submitted November 17, 2025; accepted December 1, 2025.
One or more of the authors has declared the following potential conflict of interest or source of funding: Funding was provided by an Arthrex (Naples, Florida, USA) Investigator-Initiated Research Grant, Study ID IIRR-01696. O.L. reports a relationship with Arthrex that includes consulting and grant funding. M.M. reports a relationship with Arthrex and ConMed that includes grant funding. AOSSM checks author disclosures against the Open Payments Database (OPD). AOSSM has not conducted an independent investigation on the OPD and disclaims any liability or responsibility relating thereto.