
Abstract
Background:
Knee injuries are among the most common injuries in female basketball players. Despite the growing popularity of professional women's basketball, particularly the Women's National Basketball Association (WNBA), there are limited recent data evaluating the incidence of and risk factors for knee injuries in WNBA athletes.
Hypothesis:
Older age, minutes played per game, number of games played, and player usage rate would be significantly associated with having a knee injury in WNBA players from the 2017 to 2022 seasons.
Study Design:
Descriptive epidemiology study.
Methods:
Publicly available data on the injury history and player records of active WNBA players between the 2017 and 2022 seasons were reviewed to identify players with a knee injury resulting in ≥1 games missed. The primary outcome was the incidence of knee injuries reported per 1000 minutes-exposures (MEs). Player demographics, statistics, and injury characteristics were recorded. Secondary analysis was conducted using bivariate and multivariable logistic regression to investigate risk factors associated with having a knee injury.
Results:
A total of 87 players (10.8% of all players) sustained a combined 104 knee injuries between the 2017 and 2022 seasons, indicating a rate of 6.03 knee injuries per 1000 MEs. Accounting for potential confounders, having a knee injury was significantly associated with older age (OR, 1.11; 95% CI, 1.05-1.18; P = .0002) and higher usage rate (OR, 1.06; 95% CI, 1.02-1.11; P = .02).
Conclusion:
This study showed that knee injuries occurred in 10.8% of players, with an overall rate of 6.03 injuries per 1000 MEs. The most significant risk factors associated with having a knee injury in WNBA athletes were older age and higher player usage rate. Implementing targeted load management strategies for players with higher usage rates or advanced age may help reduce the incidence of knee injuries among female basketball athletes.
Knee injuries account for a substantial proportion of all injuries sustained by female basketball players.5,12,13 Previous studies have shown that female athletes are at a significantly higher risk of knee injuries than male athletes at high school and collegiate levels of play.2,3,7,18,28 These findings are in line with injury incidence studies reporting significant differences between male and female athletes in other sports.1,11
Professional women's basketball is becoming increasingly popular, as indicated by the rising viewership of the most popular women's league in the world, the Women's National Basketball Association (WNBA). Within the 2021 season, WNBA viewership increased 74% just after the first 5 games. 15 Little is known about the injuries and associated risk factors of female professional basketball players. 20 Existing literature regarding knee injuries in WNBA players has been limited by outdated injury incidence data, restricted analysis of singular injury type, and lack of multivariable analysis to assess the risk factors associated with the injuries.4,5,10,12,20,21,30 The purpose of this study was to determine knee injury incidence rates and identify risk factors associated with these injuries in WNBA players from the 2017 to 2022 seasons. We hypothesized that older age, minutes played per game, number of games played, and player usage rate would be significantly associated with having a knee injury.
Methods
Data Collection
This retrospective analysis of WNBA player records, including game statistics and injury reports, followed a previously published methodology.4,5,17 The working database in this study organized information provided by querying Rotowire (rotowire.com) to identify all WNBA players who were active between the 2017 and 2022 seasons. This time frame was chosen given the accessibility of the data. Rotowire serves as an online database that monitors WNBA team injury reports containing information about games missed due to injury, descriptions of injuries, and dates of injuries. Each injury was verified using historical data available on ESPN (espn.com) and confirmed with player game logs on Basketball-Reference (basketball-reference.com) sourced by Sportradar US, the official data provider of the WNBA. These databases have been previously cited in related studies.9,19,23,31,32 No disagreements among us occurred during the data collection in this investigation. This study was deemed exempt from approval by the institutional review board.
Measurements
Player demographics, basketball statistics, injury characteristics, and timing of injury were recorded. Usage rate, an advanced statistic defined as an estimate of the percentage of team plays used by a player while she was on the floor, was also examined (Figure 1).8,27 Minutes per game is a statistic that represents the mean number of minutes played by a player in all regular season and playoff games of a particular season. Player positions included guards, forwards, and centers. A knee injury was defined as any injury to the knee that resulted in an absence of ≥1 games. Knee injuries were categorized by injury type including cartilage injury (ie, cartilage lesions), contusion (ie, bone bruise), inflammation (ie, bursitis), soreness, sprain/strain, tear/rupture (ie, anterior cruciate ligament [ACL] tear, medial collateral ligament tear, and patellar tendon rupture), and unspecified/other (ie, skin infection). Categories were chosen based on information from reports and verified by institutional physicians. A minute-exposure (ME) was characterized by minutes played within the season. The severity of an injury was determined by the following number of consecutive game absences due to injury: minor (1 game absence), moderate (2-10 game absences), and severe (≥10 game absences). This did not include any exposures related to practice or training periods. Injuries that occurred during practice or outside of a game scenario were not included in the data. Of note, 34 games were played during the 2017, 2018, and 2019 seasons; 22 games were played during the 2020 season (due to COVID-19); 32 games were played during the 2021 season; and 36 games were played during the 2022 season.

Usage rate formula, where USG is usage, Tm is team, FGA is field goals attempted, FTA is free throws attempted, MP is minutes played, and TOV is turnovers.
Statistical Analysis
Descriptive statistics were collected for all WNBA players and injury characteristics. The incidence of injury events was calculated per 1000 MEs for each season. Continuous variables are presented as mean ± standard deviation; discrete variables are presented as the number and percentage of patients. All injuries pertinent to the knee were included in this analysis. Bivariate associations between the occurrence of knee injuries and factors such as age, position, number of games played, minutes played per game, player statistics, and usage rate were assessed. For continuous variables, Student t tests and Mann-Whitney U tests were used for parametric and nonparametric data, respectively. Comparisons of categorical variables were performed using chi-square tests or Fisher exact test. The Fisher exact test was applied when expected cell counts were <5. Odds ratio, 95% confidence interval, and P values are reported. All variables were assessed for multicollinearity using variance inflation factors (VIFs). Variables that had a VIF >5 were removed from the logistic regression model. The Hosmer-Lemeshow score, area under the curve (AUC), and pseudo R2 were calculated to assess the validity of the model. P values <.05 were considered statistically significant. All analyses were conducted with R (R Foundation for Statistical Computing).
Results
Characterization of Knee Injuries
There were 892 total player seasons, with 298 unique players within our data set. Within these players, a combined total of 104 knee injuries were sustained by 87 different players over the span of 6 seasons (Table 1), with a total incidence rate of 6.03 per 1000 MEs. Seventeen players experienced knee injuries in ≥2 seasons. The leading category of reported injury types was unspecified/other (1.85 per 1000 MEs), followed by tear/rupture (1.45 per 1000 MEs). The least likely injury type was cartilage injury (0.12 per 1000 MEs).
Knee Injury Totals and Incidences in WNBA Athletes a

ME, minute-exposure; WNBA, Women's National Basketball Association.
Stratified by season, the rate of knee injury was highest in the 2021 season (6.71 per 1000 MEs), with incidence rates in the 2020 season (6.53 per 1000 MEs) and 2017 season (6.20 per 1000 MEs) trailing behind (Table 2). When broken down by severity, the incidence rate of knee injury was highest in moderate injuries (3.48 per 1000 MEs), followed by severe injuries (1.39 per 1000 MEs) and mild injuries (1.16 per 1000 MEs). In terms of age, there was a great range of players, from 20 to 41 years (median age, 28 years), and they were subsequently divided into age groups for analysis. The rate of knee injury was greatest in players aged 25 to 29 years (2.90 per 1000 MEs), followed by players aged ≥30 years (1.91 per 1000 MEs) and players aged ≤24 years (1.22 per 1000 MEs). Lastly, stratified by position, guards and forwards exhibited identical knee injury incidence rates (2.78 per 1000 MEs), followed by centers (0.46 per 1000 MEs) (Table 2).
Knee Injury Stratified by Severity, Season, Age, and Position a

ME, minute-exposure.
Risk of Knee Injury
In bivariate analysis (Table 3), having a knee injury was significantly associated with age (P = .001), games played (P < .001), usage rate (P = .005), and the forward position (P = .046). Other positions, number of games started, minutes played per game, and player statistics (ie, points, blocks, rebounds, true shooting percentage, and player efficiency rating) were not found to have any significant association with risk of knee injury. For the logistic regression analysis, a power analysis was conducted by identifying the number of events per variable (EPV). This resulted in an EPV of 7.25. Given this result, we limited model complexity by testing all variables for multicollinearity using VIF analysis. Minutes played (VIF, 11.63) and points (VIF, 10.33) were removed from the model due to collinearity. In logistic regression analysis (Table 4), having a knee injury was significantly associated with age (OR, 1.11; 95% CI, 1.05-1.18; P < .001), games played (OR, 0.95; 95% CI, 0.93-0.98; P < .001), and usage rate (OR, 1.06; 95% CI, 1.01-1.11; P = .02). The Hosmer-Lemeshow score, AUC, and pseudo R2 were calculated to identify model fit. The model had a Hosmer-Lemeshow score of 0.84, AUC of 0.72, and pseudo R2 of 0.084, supporting the model's ability to fit well with the data and accurately distinguish between injured and noninjured players based on AUC. There was also a modest amount of variance based on the pseudo R2, which is expected in clinical and sports injury prediction. No significant associations were found between risk of injury and position.
Bivariate Analysis of Factors Associated With Knee Injury a

Data are presented as mean ± SD or n (%). Boldface type indicates statistical significance.
Multivariable Analysis of Factors Associated With Knee Injury a
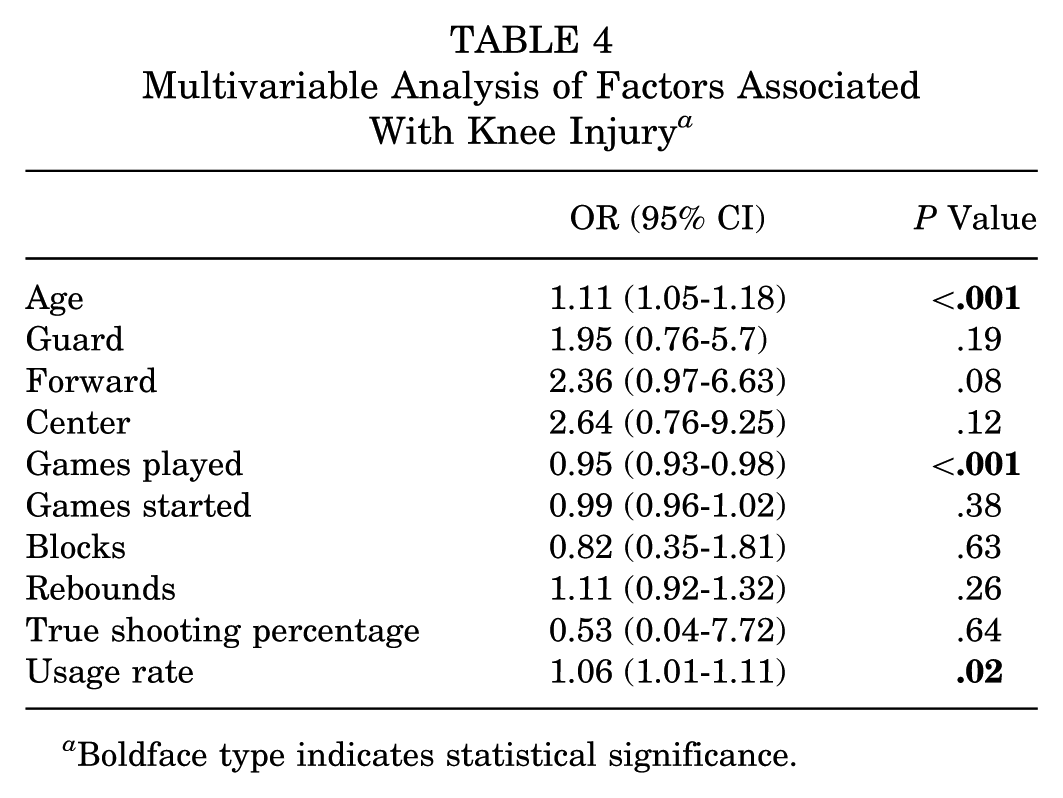
Boldface type indicates statistical significance.
Discussion
The major finding of this study showed that knee injuries in WNBA athletes occurred at a rate of 6.03 per 1000 MEs. A combined total of 104 knee injuries were sustained by 87 different players (10.8% of all players) over the span of 6 seasons. Risk factors significantly associated with knee injuries included older age (OR, 1.11; 95% CI, 1.05-1.18) and higher usage rates (OR, 1.06; 95% CI, 1.01-1.11). Guards and forwards exhibited similar knee injury rates, while centers had the lowest injury rates.
Knee injuries are more common in female basketball players compared with their male counterparts.14,22,29 A comparative study investigating differences in the injury patterns of National Basketball Association (NBA) and WNBA players found that WNBA players were more susceptible to lower extremity injuries, including knee injuries, than their NBA counterparts. 10 There are several potential reasons as to why knee injuries are more prevalent in female athletes. Anatomically, females have a wider pelvis, leading to a greater Q angle of the knee. 26 This variation in anatomy may contribute to a higher risk of knee valgus during dynamic movements, thereby increasing the likelihood of knee injuries, specifically but not limited to those of the ACL. 24 A phenomenon in females commonly referred to as “ligament dominance,” in which women have a greater dependence on their ligaments rather than their muscles to absorb forces, adds to the risk of knee injury. 18 Furthermore, women have more flexibility in their knees than men, leading to a greater impact on muscles, tendons, and ligaments in the event of a hyperextension injury. 25 Finally, some studies indicate an association between hormone fluctuations and spikes in knee injuries. 16
Existing research lacks up-to-date, comprehensive analyses of risk factors associated with various injuries, including knee injuries, in the WNBA. In a study by Baker et al 5 examining WNBA injury statistics from the 2015 to 2019 seasons, researchers found the knee to be the most commonly injured joint, accounting for 29% of total injuries and 26% of games missed. However, their investigation was unable to identify the risk factors associated with these injuries. Other studies have emphasized the high rate of ACL injuries in WNBA athletes, consistent with the relatively high rate of tear/rupture observed in this study.21,30 However, these studies failed to expand to other types of knee injuries.
We used publicly available player records to evaluate knee injury incidence and identify older age and higher usage rates as associated risk factors in WNBA players from 2017 to 2022. Each 1-year increase in age was associated with an 11% increase in the odds of knee injury (OR, 1.11 per year), making age the strongest predictor in our model; each 1 percentage point increase in usage rate was associated with a 6% increase in the odds of injury (OR, 1.06 per percentage point). Clinically, a 5-year age difference corresponds to approximately 1.69 times higher odds and a 10-point higher usage rate to approximately 1.79 times higher odds; combined, veteran high-usage players may face >2 times the odds of knee injury compared with younger, lower-usage peers, a magnitude likely to influence return-to-play and minute-cap decisions. These findings align with existing research that identifies minutes per game and usage rate as risk factors associated with knee injuries in NBA athletes. 30 This trend is consistent with a correlation between physiological burden and knee injury risk in professional basketball players and calls for player workload management to prevent injuries. Load management in professional sports is defined as the practice of regulating the number of minutes played and the overall energy expenditure by an athlete, with the aim of mitigating injury risk. 6 While this practice has become commonplace in the NBA, the WNBA has been slower to implement such injury prevention methods. By promoting adjustments to training and competition intensity, as well as reducing overall demands, clinicians can better alleviate the physical and psychological strain on a WNBA player. Further research should include risk factors associated with other injuries in the WNBA to help clinicians understand the current landscape of injuries in professional women's basketball and to create targeted load management programs for these athletes.
Limitations
There are several limitations associated with this study. Injuries in the WNBA are often underreported, and WNBA injury data are limited to the information publicly available online. This could have resulted in the low power within the study, potentially lower injury totals overall, and multiple mislabeled or vague injuries. Another limitation of this study is that there are many potential sources of bias within the data collection, including lower visibility of nonstar players or media reporting errors and misclassifications. In addition, variation in season length represents another important limitation that may have influenced the findings. Although the 2017, 2018, and 2019 seasons were the same length, the 2020 season was shortened due to COVID-19, and the following 2 seasons varied in length. While statistical analysis accounted for confounders, this may potentially explain the statistically significant relationship between risk of knee injury and games played. With an odds ratio of 0.95, our findings indicated that more games played was counterintuitively associated with slightly lower risk of injury, although the reason for this is unclear and likely due to players requiring prolonged absence from games to recover, differences in season length, or the relatively small sample sizes of players and injuries. Finally, the data we have are from publicly available information and exclude injuries sustained outside of professional games. Further research should be done to investigate risk factors associated with other injuries in the WNBA.
Conclusion
Our study showed that knee injuries occurred in 10.8% of players, with an overall rate of 6.03 injuries per 1000 MEs. The most significant risk factors associated with having a knee injury in WNBA athletes were older age and higher player usage rate. Implementing targeted load management strategies for players with higher usage rates or advanced age may help reduce the incidence of knee injuries among female basketball athletes.
Footnotes
Final revision submitted September 30, 2025; accepted October 31, 2025.
The authors declared that they have no conflicts of interest in the authorship and publication of this contribution. AOSSM checks author disclosures against the Open Payments Database (OPD). AOSSM has not conducted an independent investigation on the OPD and disclaims any liability or responsibility relating thereto.
Ethical approval was not sought for the present study.