
Abstract
Background:
Managing high-grade partial-thickness rotator cuff tears (hPTRCTs) (>50% of thickness) of the supraspinatus tendon presents significant challenges; however, understanding long-term structural changes is limited.
Purpose:
To evaluate the long-term structural prognosis of nonoperative treatment for hPTRCTs of the supraspinatus tendon, focusing on survival rates and hazard ratios of risk factors for tear progression.
Study Design:
Case-control study; Level of evidence, 3.
Methods:
This retrospective review enrolled patients with magnetic resonance imaging (MRI)-proven symptomatic hPTRCTs of the supraspinatus tendon from November 2007 to December 2023. Patients underwent nonoperative treatment with follow-up MRIs. Clinical and imaging data were collected, and survival analysis was performed using the Kaplan-Meier estimation method. Risk factors were evaluated with univariate and multivariate logistic regression, followed by Cox proportional hazard model analysis.
Results:
Of the initial 1397 eligible patients, 268 (19.2%) were included in the final analysis after excluding those without follow-up MRI. Among them, 56 (20.9%) showed tear progression over a mean follow-up of 26 months, with a median survival time of 79.6 months. The 3-year, 5-year, and 8-year survival rates were 73.1%, 61.5%, and 42.1%, respectively. The overall annual hazard rate for tear progression was 10.1%, with a first-year hazard rate of 3.2% and a second-year hazard rate of 17.2%. Multivariate Cox proportional hazard analysis identified initial mediolateral (ML) tear size and tendinosis grade as significant predictors of progression. Patients with an ML tear size <62% had a hazard ratio (HR) of 1.78 (95% CI, 1.04-3.04), while those with tendinosis grade 2 had an HR of 3.51 (95% CI, 1.86-6.61), and tendinosis grade 3 had an HR of 2.23 (95% CI, 0.96-5.19), showing a trend toward significance.
Conclusion:
hPTRCTs exhibit a time-dependent pattern of structural progression, characterized by a relatively low risk in the first year, followed by a notable increase thereafter. Patients with intermediate-grade tendinosis or smaller mediolateral tear sizes appear to be at increased risk. Further research into the biological and biomechanical mechanisms underlying tear progression may improve treatment strategies and clinical outcomes.
Managing partial-thickness rotator cuff tears (PTRCTs) of the supraspinatus tendon is challenging due to the complexity of deciding between nonoperative treatment and surgical intervention. 9 This decision is particularly difficult because of the variable nature of tear progression and patient response to nonoperative treatments.22,33,34 Notably, high-grade PTRCTs (hPTRCTs), defined as tears involving >50% of tendon thickness, tend to progress more rapidly than low-grade PTRCTs, often necessitating surgical intervention during follow-up.16,20
A previous study on hPTRCT revealed that among 81 patients diagnosed with symptomatic hPTRCT, 13 cases (16%) showed progression of the tear at a mean follow-up period of 19.9 months. 17 The tendinosis grade at initial shoulder magnetic resonance imaging (MRI) was the only significant risk factor for the tear progression in the study. However, a relatively small number of patients, due to a high dropout rate from MRI follow-up, have limited explanation for mid- to long-term structural changes in symptomatic hPTRCT. Furthermore, degenerative changes associated with aging play a crucial role in tear progression over time, emphasizing the need to consider the time factor and the importance of survival analysis. 32
Therefore, this study aimed to identify the long-term structural prognosis of nonoperative treatment for symptomatic hPTRCT of the supraspinatus tendon. This study was conducted to investigate the survival rate of symptomatic hPTRCT in relation to tear progression and evaluate the main risk factors for tear progression. We hypothesized that the rate of tear progression would remain constant over time and that the initial tendinosis grade would still be a significant risk factor at long-term follow-up.
Methods
This retrospective review was conducted after obtaining approval from our institutional review board (SNUH IRB No. H-2407-008-1548). From November 2007 to December 2023, patients with MRI-proven symptomatic hPTRCT of the supraspinatus tendon were enrolled. The inclusion criteria were as follows: (1) patients experiencing shoulder pain and functional limitations, such as pain during daily activity, night pain, or reduced range of motion; (2) diagnosis of hPTRCT, indicated by increased signal intensity in the rotator cuff on T2-weighted coronal MRI images, without partial footprint continuity exceeding 50%; (3) adherence to nonoperative treatment protocols; and (4) the presence of follow-up MRI after the initial diagnosis. 8 Patients were excluded if they lacked follow-up MRI, had associated shoulder conditions, including rotator cuff tear of the subscapularis or the infraspinatus, fractures, calcific tendinitis, or glenohumeral osteoarthritis, or if they underwent rotator cuff repair surgery before the follow-up—either due to patient preference for definitive treatment or failure of nonoperative management. Of the 1397 initially eligible patients, 1129 (80.8%) were excluded due to a lack of follow-up MRI or other exclusion criteria, resulting in a final cohort of 268 patients (Figure 1).
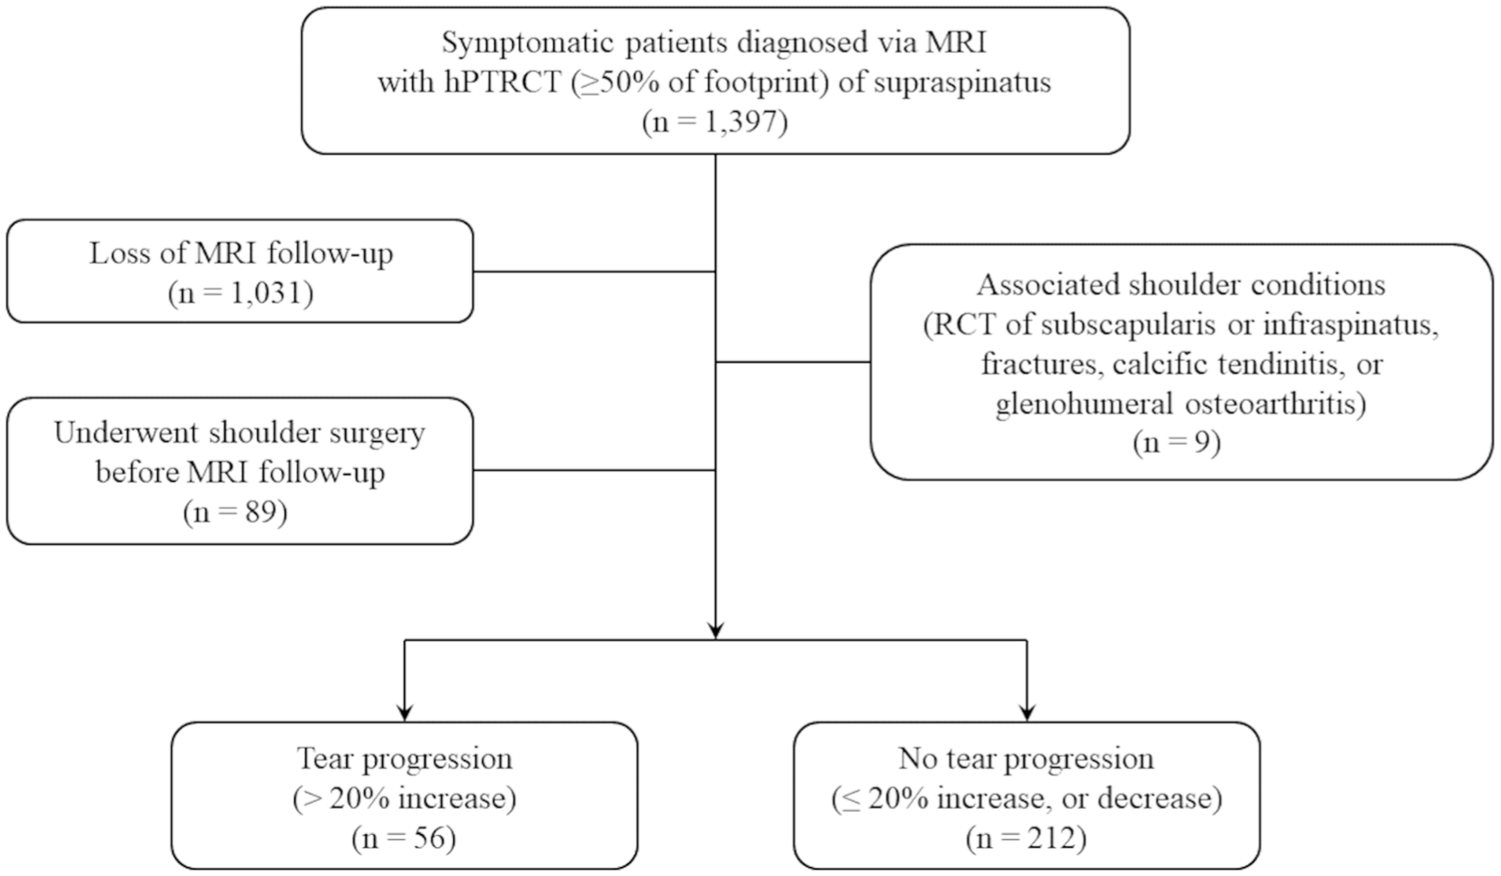
Flowchart of patient enrollment. AUC, area under the curve; hPTRCT, high-grade partial rotator cuff tear; MRI, magnetic resonance imaging; RCT, rotator cuff tear.
Nonoperative Treatment and Patient Follow-up
At our institute, nonoperative treatment for hPTRCT includes self-conducted home stretching exercises and avoiding regional injections, such as steroids, atelocollagen, and platelet-rich plasma. The standardized home exercise program consists of 5 stretching movements—including forward elevation, abduction, external rotation, and internal rotation. Patients learn exercises from a specialized shoulder physical therapist and perform them 2 to 3 times daily. Each exercise is held for 30 seconds and repeated 3 to 5 times. In addition to avoiding the injection of steroids due to their harmful effects on tenocytes,12,21 other regional injections—including atelocollagen, hyaluronic acid, and platelet-rich plasma—were also avoided due to the lack of conclusive evidence supporting their long-term efficacy in tendon healing for PTRCTs.5,10,11,14,31 For pain management, nonsteroidal anti-inflammatory drugs were primarily used; in cases of contraindications or adverse effects, a combination of acetaminophen and tramadol was prescribed as an alternative.
Patients returned for evaluation 2 months after starting treatment, with continued follow-ups every 3 months if symptoms improved. Patient follow-up included a recommendation for a follow-up MRI after a minimum of 1 year of nonoperative treatment to evaluate tear progression. However, some patients insisted on obtaining earlier or multiple MRI follow-ups due to personal concerns, persistent symptoms, or a lack of improvement. In contrast, patients who experienced symptom resolution were less likely to undergo follow-up MRI. Therefore, we included all these MRIs in the study for survival analysis to capture the full range of structural fate of hPTRCT, and only selected the final MRIs for risk factor analyses.
Clinical Data Collection
Demographic and clinical data of the patients were retrospectively collected. Demographic details such as age, sex, and the dominance of the affected side were included. The history of trauma related to the initial symptom was also recorded, specifically incidents like falls on an outstretched hand, direct contusions, or traction injuries. Additionally, the duration of symptoms before the initial MRI diagnosis was noted. Shoulder stiffness, characterized by limitations in range of motion, was assessed using specific criteria: forward elevation <°120, external rotation at the side <30°, or internal rotation behind the back lower than the third lumbar vertebra. 27 Measurements were standardized using a goniometer and a ruler, with forward elevation referenced to thoracic vertebrae, external rotation to the sagittal plane, and internal rotation assessed by the highest spinous process reached by the thumb. Patients meeting any one of these criteria were classified as having shoulder stiffness.
Imaging Data Collection
Shoulder MRI scans were performed using either a Signa HDxt 1.5-T scanner (GE Healthcare) or a Magnetom Trio/Verio 3.0-T scanner (Siemens Medical Solutions) with dedicated shoulder coils. Patients were placed in the supine position with the forearm in a semipronated (neutral) position. The MRI protocol included axial fast spin-echo proton density–weighted imaging with fat saturation (repetition time [TR]/ echo time [TE], 2300-3900/30-60 ms; slice thickness, 3 mm; slice gap, 0.3 mm; field of view, 14 cm; matrix, 384 × 269; echo train length, 7 n), oblique coronal and sagittal fast spin-echo T2-weighted images with fat saturation (TR/TE, 2300-4600/30-50 ms; slice thickness, 3 mm; slice gap, 0 mm; field of view, 14 cm; matrix, 384 × 269; echo train length, 12 n) as well as oblique coronal and extended oblique sagittal fast spin-echo T1–weighted images (TR/TE, 400-800/10-15 ms; slice thickness, 3-4 mm; slice gap, 0-0.4 mm; field of view, 14 cm for coronal and 16 cm for sagittal images; matrix, 384 × 269; echo train length, 4 n).
Imaging data were assessed from both the initial and follow-up MRIs, using the same measurement methods as outlined in a previous study. 17 At initial diagnosis, key parameters included the location of the tear (bursal, articular, or intratendinous), mediolateral (ML) tear size at the footprint (%), and anteroposterior (AP) tear size at the footprint (mm). Additional variables evaluated were the tendinosis grade, the subacromial spur grade, and the subacromial/subdeltoid fluid collection grade. Follow-up MRI factors included the ML tear size at the footprint, with an increase of >20% classified as progression. The duration from the initial MRI to the follow-up MRI was also recorded.
ML measurements of the tears were conducted in T2-weighted coronal sections, with tear ratios calculated as the lengths of tears relative to the whole footprint. An increase of >20% in tear ratio or progression to a full-thickness rotator cuff tear was considered progression. The severity of tendinosis, lateral spurs, and subacromial fluid collection were graded on a scale of 1, 2, and 3 using T2-weighted coronal images, with tendinosis graded as grade 1 (mild focal increase in tendon signal), grade 2 (moderate focal increase), and grade 3 (marked generalized increase) (Appendix Figure A1); lateral spurs graded as grade 1 (mild or no indentation of the rotator cuff tendon), grade 2 (spur causing indentation), and grade 3 (heel-type spur morphology) (Appendix Figure A2); and subacromial fluid collection graded as grade 1 (minimal or no fluid), grade 2 (some fluid in the subacromial and subdeltoid spaces), and grade 3 (marked fluid accumulation in these spaces) (Appendix Figure A3).17,26,30 AP dimensions of tears were measured in oblique sagittal T2-weighted images.
Imaging measurements were performed by 2 fellowship-trained shoulder surgeons (S.Y.O. and J.W.M.) to ensure consistency. S.Y.O. underwent intraobserver reliability testing with a measuring interval of 2 months, and both surgeons participated in interobserver reliability measurement. These assessments were conducted in a blinded setting and measured independently, building on the previously proven excellent intraobserver reliability and good interobserver reliability of these methods.16,17
Statistical Analysis
The statistical analysis was performed using the R package Version 4.3.3 (R Foundation for Statistical Computing). Intra- and interobserver reliability was assessed using the intraclass correlation coefficient (ICC) (a 2-way random model with absolute agreement) for continuous variables, and Cohen's Kappa coefficient (κ) for categorical variables. For ICC, values <0.50 indicate poor reliability, between 0.50 and 0.75 indicate moderate reliability, between 0.75 and 0.90 indicate good reliability, and >0.90 indicate excellent reliability. 18 For κ, values <0.20 indicate slight agreement, between 0.21 and 0.40 indicate fair agreement, between 0.41 and 0.60 indicate moderate agreement, between 0.61 and 0.80 indicate substantial agreement, and >0.80 indicate almost perfect agreement.19,24
An overall survival analysis of symptomatic hPTRCT against tear progression was conducted using the Kaplan-Meier estimation, calculating median survival time, survival rates, and annual hazard rates with 95% CIs. Univariate and multivariate logistic regression analyses, employing a stepwise backward method, were conducted to identify and evaluate the risk factors for hPTRCT progression, with particular attention to the role of the follow-up interval as a significant factor.
Considering the progression over time as an important factor, univariate Cox proportional hazard analyses were first performed to identify risk factors, followed by multivariate Cox analysis to assess their significance. For statistically significant continuous variables, cutoff values were determined using the Youden method from the area under the curve (AUC) of the receiver operating characteristic (ROC) curve. They were subsequently used to identify and report hazard ratios. Statistical significance was set at P < .05.
Results
A total of 1397 patients with a diagnosis of hPTRCT were enrolled. After excluding 1129 patients due to a lack of MRI follow-up, the presence of associated shoulder conditions, or having undergone rotator cuff repair surgery, 268 patients were included in the final analysis (Figure 1). For patients with multiple MRI follow-ups, we included the latest follow-up MRI for patients without progression, and the first follow-up MRI showing progression for patients with progression. To evaluate potential selection bias, we compared the baseline demographic data of the included and excluded patients and found no significant differences (AppendixTable A1).
At the final follow-up, with a mean follow-up period of 26 ± 23.3 months (range, 3-161 months), 56 out of 268 patients (20.9%) showed tear progression. Baseline demographic and clinical data revealed no significant differences between patients with and without tear progression (Table 1).
Baseline Demographic and Clinical Data a

Data are presented as mean ± standard deviation, mean (range), or n (%) unless otherwise indicated.
Reliability of Imaging Measurements
Measurement reliability for imaging assessments demonstrated a range of good to excellent intra- and interobserver agreement. Intra-observer reliability was assessed using ICC values for ML size (0.930) and AP size (0.923), and κ values for tear location (0.917), tendinosis grade (0.901), subacromial spur grade (0.923), and fluid collection grade (0.914). Interobserver reliability was assessed using ICC values for ML size (0.904) and AP size (0.931), and κ values for tear location (0.893), tendinosis grade (0.886), subacromial spur grade (0.878), and fluid collection grade (0.863).
Survival Analysis
Kaplan-Meier survival analysis revealed that the median survival time for the patients against tear progression was 79.6 months (Figure 2). The 3-year survival rate was 73.1% (95% CI, 65.7-81.4), the 5-year survival rate was 61.5% (95% CI, 51.5-73.5), and the 8-year survival rate was 42.1% (95% CI, 28.5-62.4). The overall annual hazard rate of tear progression was 10.1% (95% CI 7.4-12.8).

Survival curve of the hPTRCT of the supraspinatus tendon against tear progression. the median survival time was 79.6 months (dashed line). The 95% CI is represented around the survival curve (shaded region). hPTRCT, high-grade partial-thickness rotator cuff tear.
The 1-year survival rate was 97.2% (95% CI, 95.3-99.1%), and the 2-year survival rate was 82.8% (95% CI, 77.4-88.6%). Accordingly, the annual hazard rates of tear progression were 3.2% (95% CI, 1-5.4) for the first year and 17.2% (95% CI, 9.9-24.5) for the second year. The first-year hazard rate was significantly lower than the overall annual hazard rate (P < .001). In contrast, the second-year hazard rate showed a trend toward significance compared with the overall rate (P = .073).
An additional event-free survival analysis was performed in 331 patients, using a composite endpoint of MRI-confirmed progression or conversion to surgery in 63 patients who failed nonoperative treatment. The median event-free survival time was 56.2 months, and the survival curve is presented in Appendix Figure A4.
Imaging Assessment for Risk Factors
Imaging findings at the initial MRIs were first compared using univariate logistic regression analysis (AppendixTable A2). The analysis indicated that ML tear size (P = .006), tendinosis grade (P = .001), subacromial spur grade (P = .004), and follow-up interval (P = .016) were significant factors for progression, while subacromial fluid collection grade showed a trend toward significance (P = .061).
Multivariate logistic regression analysis was performed—including 4 statistically significant variables (ML tear size, tendinosis grade, subacromial spur grade, and follow-up interval) and another variable (subacromial fluid collection grade)—which showed a trend toward statistical significance. The multivariate analysis confirmed that follow-up interval (P = .011) was a significant predictor of tear progression, along with ML tear size (P = .006) and tendinosis grade (P = .008) (AppendixTable A3). Therefore, we proceeded with univariate and multivariate Cox proportional hazard analyses to evaluate the time-dependent risk factors for hPTRCT progression.
Risk Factor Identification Using Cox Proportional Hazard Analysis
Univariate Cox proportional hazard analyses were conducted to evaluate the significance of demographic, clinical, and imaging factors. Demographic and clinical factors were not identified as significant predictors of tear progression. Among imaging factors at the initial MRI, smaller ML tear size (P = .044), intermediate tendinosis grade (P < .001), higher subacromial spur grade (P = .016), and higher subacromial fluid collection grade (P = .018) were identified as potential predictors (Table 2).
Univariate Cox Proportional Hazard Analysis of Imaging Findings at Initial Diagnosis a

Data are presented as mean ± standard deviation unless otherwise indicated. Bold P values indicate statistical significance.
A multivariate Cox proportional hazards analysis was subsequently performed, incorporating the significant factors identified in the univariate analysis (Table 3). The analysis confirmed that ML tear size and tendinosis grade were significant predictors of tear progression. Larger ML tear sizes were associated with a decreased risk of progression (hazard ratio [HR], 0.96; P = .030). Patients with grade 2 tendinosis had a significantly higher risk (HR, 3.51; P < .001) compared with those with grade 1, while those with grade 3 showed a trend toward significance (HR, 2.23; P = .063).
Multivariate Cox proportional hazard analysis a

Bold P values indicate statistical significance.
Compared with the reference category of grade 1.
To further refine and stratify the continuous variable of the ML tear size, a cutoff value was determined from the AUC of the ROC curve (Appendix Figure A5). The ROC curve derived from the multivariate logistic regression model yielded an AUC of 0.74, indicating moderate discriminative ability. The optimal cutoff point for the predicted probability was determined to be 0.214, corresponding to an ML tear size threshold of 62%.
Subsequently, each significant variable was stratified and analyzed using survival curves. Patients with an ML tear size ≤62% had a significantly higher risk of tear progression compared with those with an ML tear size >62%, with an HR of 1.78 (95% CI, 1.04-3.04; P = .035) (Figure 3). Survival curves for tendinosis grades also revealed statistically significant differences (Figure 4).

Survival curves of hPTRCTs stratified by initial mediolateral (ML) tear size, with a cutoff of 62%. hPTRCTs, high-grade partial-thickness rotator cuff tears; ML, mediolateral.

Survival curves of hPTRCTs stratified by the initial grade of tendinosis. hPTRCTs, high-grade partial-thickness rotator cuff tears.
Discussion
In this study, we observed an overall progression rate of 20.9% for nonoperative treatment of hPTRCTs, with a median survival time of 79.6 months over a mean follow-up period of 26 months. The overall annual hazard rate for tear progression was 10.1%, with a first-year hazard rate of 3.2% and a second-year hazard rate of 17.2%. Multivariate Cox proportional hazard analysis identified initial ML tear size and tendinosis grade as significant predictors of tear progression. Patients with an ML tear size ≤62% had an HR of 1.78, while patients with tendinosis grade 2 had an HR of 3.51, and those with tendinosis grade 3 had an HR of 2.23, showing a trend toward significance.
These findings, based on survival and hazard rate evaluations, align with progression rates reported in previous studies. Kong et al 17 reported similar trends in demographic and clinical factors for patients with symptomatic hPTRCT, noting an overall progression rate of 16.0% over a mean follow-up period of 19.9 months. Other studies have also reported varying progression rates based on different follow-up durations and criteria. Studies focusing on the tear progression of PTRCTs in size reported rates of 13.5% over 22.3 months and 26.1% over 24.7 months.15,16 Meanwhile, studies examining the progression of PTRCTs to full-thickness rotator cuff tears found rates from 6% to 19.6% over follow-up periods of 19 to 46 months.20,35 Given that the follow-up interval is a statistically significant factor in tear progression, survival analysis with extended follow-ups along a longitudinal timeline clarifies the structural fate of the rotator cuff and key risk factors.
The results of this study regarding risk factors are consistent with previous research on hPTRCTs, particularly the significance of tendinosis grade, as highlighted by Kong et al, 17 who identified it as a key predictor of tear progression. However, other studies on PTRCTs, which identified risk factors such as the affected side of dominance, history of trauma, ML tear size >50%, tear type on the articular side, and higher work levels, differ from our study, possibly because of broader patient selection criteria and differences in follow-up periods.13,16,20,35
The observed increase in hazard rate from the first to the second year suggests a delayed acceleration in tear progression, which aligns with previous survival analyses. Oh et al 28 reported a 4.5% tear conversion at 1 year, rising to 64% at 4 years, in high-grade PTRCTs. Similarly, Torchia et al 32 noted a 92% 2-year survivorship, declining to 61% by 8 years. These findings indicate that many tears remain initially stable before progressing more rapidly over time. This may reflect underlying degenerative mechanisms. Early-stage partial tears may involve localized tendon damage with temporary structural compensation. However, intrinsic degeneration, mechanical overload, and vascular insufficiency contribute to delayed structural failure. This biological process may explain the nonlinear hazard pattern and highlights the need for future studies investigating biological or pharmacological interventions aimed at modifying tendon degeneration and delaying tear progression.
The rate of tear progression was significantly higher in tendinosis grade 2 compared with other grades. Given that longer follow-up intervals show more tear progression, this difference is likely influenced by chronic degenerative changes rather than early changes, and grade 2 may represent a later stage in tendinopathy. Notably, adjacent structural factors, such as an acromial spur and subacromial effusion, were not significant in the multivariate Cox regression analysis, suggesting that these surrounding anatomic features may not independently contribute to tear progression. These findings highlight the role of long-term degenerative processes in tear progression.2,7
On the other hand, ML tear size has also been identified as a significant factor in tear progression. Previous studies on PTRCTs have established a 40% or 50% cutoff, with tears exceeding this threshold being more likely to progress.16,20 Therefore, our study focused on the progression of hPTRCTs, revealing a significant decrease in hazard with increasing ML tear size. Although the mean difference in ML tear size between groups was only 3.4%, with overlapping standard deviations (8.3% vs 8.2%), our ROC analysis identified a 62% cutoff with moderate discriminative performance (AUC = 0.74). These findings suggest that the predictive value of ML tear size may lie more in its continuous trend than in any discrete threshold, as also supported by its statistical significance in multivariate analysis. This finding may highlight the crucial structural role of the midsubstance portion of the cuff tendon in the progression of tears.1,3,4,6,25 One possible explanation, based on the layered anatomy of the supraspinatus tendon, is that smaller ML tears retain more of the tendon proper, which is more susceptible to both degenerative changes and localized strain.6,23 In contrast, larger ML tears may involve either the superficial or the deep capsular layer, which has limited ability to resist tensile load. As a result, mechanical forces may be redistributed toward the anterior or posterior margins of the tear, potentially leading to progression along the anteroposterior direction, as is often seen in full-thickness tears. 29
This study has several limitations that need to be recognized. First, there was a high loss-to-follow-up rate, with 1031 out of 1397 patients (73.8%) not completing the study. This dropout rate, due to factors such as the high cost of MRI scans and subsided symptoms, is comparable to a similar study by Kong et al, 17 which had a 74.9% loss to follow-up. Patients with symptom improvement were less likely to undergo repeat MRI, while those with persistent or worsening symptoms were more likely to pursue imaging, which could bias the findings toward a higher observed rate of tear progression. Therefore, the high dropout rate should be considered, as it may introduce bias and affect the accuracy of the findings. Second, while the overall number at risk was substantial, the number of patients with follow-up MRI data declined after approximately 2.5 to 3 years. For example, the number at risk was 47 at 3 years and 24 at 5 years, which may limit the statistical reliability of longer-term estimates and should be interpreted with caution. Third, the recommended follow-up at 1 year suggests the observed 1-year survival rate of 97.2% may be overestimated. The first-year hazard rate was 3.2%, while the overall annual hazard rate was 10.1%. Despite this potential bias, the substantial number at risk (246 at 10 months, 232 at 12 months, 171 at 15 months, and 87 at 24 months) supports the clinical relevance of the findings. Fourth, structural progression does not exactly correlate with symptoms, despite tear enlargement as a significant risk factor of pain development. 13 Persistent symptoms are another indication for surgery, highlighting the necessity for additional research in this area. Due to the limited availability of symptom data and variable follow-up timing, it was not possible to determine clinical follow-up differences between the progression and non-progression groups. Furthermore, as symptom data were unavailable for patients who did not undergo follow-up MRI, it is possible that patients with symptom resolution were underrepresented, which may have influenced the observed rate of structural progression. Fifth, other potential risk factors, such as occupational or recreational activity level, were not included in this study. Although age at diagnosis did not show a significant association with tear progression, previous studies—including that by Ko et al 16 —have identified activity level as an important contributor to symptomatic tear progression. Because activity-related data were unavailable in our dataset, we could not assess its effect in this cohort. Future studies should consider functional and lifestyle factors to clarify risk profiles. Last, this study focused on imaging outcomes, without addressing the clinical outcomes of nonoperative management. Future research should include both imaging and clinical outcomes to comprehensively assess the effectiveness of nonoperative approaches.
Conclusion
The hPTRCT exhibits a time-dependent pattern of structural progression, characterized by a relatively low risk in the first year, followed by a notable increase thereafter. Patients with intermediate-grade tendinosis or smaller mediolateral tear sizes appear to be at increased risk, highlighting the need for individualized surveillance and early, shared decision-making. Further research into the biological and biomechanical mechanisms driving tear progression may contribute to more precise treatment strategies and improved clinical outcomes.
Footnotes
Appendix
Multivariate Logistic Regression Analysis a

| OR | 95% CI | P | |
|---|---|---|---|
| Tear size, mediolateral dimension | 0.948 | 0.910-0.986 |
|
| Tendinosis grade b | |||
| 2 | 2.823 | 1.331-6.158 |
|
| 3 | 1.295 | 0.438-3.627 | .580 |
| Follow-up interval, months | 1.017 | 1.004-1.029 |
|
Bold P values indicate statistical significance. OR, odds ratio.
Compared with the reference category of grade 1.
Final revision submitted August 5, 2025; accepted September 1, 2025.
The authors have declared that there are no conflicts of interest in the authorship and publication of this contribution. AOSSM checks author disclosures against the Open Payments Database (OPD). AOSSM has not conducted an independent investigation on the OPD and disclaims any liability or responsibility relating thereto.
Ethical approval for this study was obtained from Seoul National University College of Medicine/Seoul National University Hospital Institutional Review Board (SNUH IRB No. H-2407-008-1548).