
Abstract
Background:
The posterior tibial slope (PTS) influences knee sagittal balance and is linked to anterior cruciate ligament (ACL) injury and meniscal pathology. Various imaging modalities assess PTS, but differences in measurement techniques and reliability remain a concern.
Purpose/Hypothesis:
The purpose of this article was to evaluate the accuracy of calculating the lateral plateau slope using lateral radiograph (LR) and magnetic resonance imaging (MRI)–derived asymmetry. It was hypothesized that measurement error would be high and variable across imaging modalities and that 3-dimensional (3D) reconstruction would serve as a consistent and accurate reference for PTS assessment.
Study Design:
Cohort study (Diagnosis): Level of evidence, 2.
Methods:
Between March 2020 and October 2023, ACL reconstruction patients were screened. PTS was measured on knee LRs, tibial long-bone LRs (LLRs), preoperative MRI, and 3D-reconstructed images from postoperative computed tomography scans. Two orthopaedic surgeons performed 2 measurements each. Reliability was assessed using intraclass correlation coefficients (ICCs), and agreement was analyzed using Bland-Altman plots, considering ±2° limits of agreement (LOA) as acceptable.
Results:
Among 132 screened patients, 32 met the inclusion criteria. Intrarater reliability was high for LR and LLR (ICC, 0.86-0.93), while interrater reliability was moderate for LR (ICC, 0.72) and excellent for LLR (ICC, 0.90). MRI showed moderate-to-good reliability (ICC, 0.65-0.79) but high variability (43.75%-65.60% within LOA). Three-dimensional reconstructions demonstrated excellent reliability (ICC, 0.93-0.97) with low variability. MRI-derived asymmetry (calculated as the difference between the PTS of the lateral tibial plateau (LTP) and the medial tibial plateau) showed good agreement with 3D imaging (ICC, 0.81; 73.44% within LOA). LLR had the highest agreement with 3D imaging for medial PTS (ICC, 0.88; 78.12% within LOA). No single method accurately estimated lateral PTS, but combining LLR-based medial PTS with MRI-derived asymmetry improved agreement with 3D LTP (ICC, 0.80; r = 0.826; P < .001).
Conclusion:
Medial PTS measurement using anterosuperior and posterosuperior reference points in lateral views (LR and LLR) proved to be highly accurate and consistent. In MRI, only the lateromedial PTS asymmetry demonstrated reliability and consistency. To estimate lateral PTS, combining the LLR-based medial PTS with the MRI-derived lateromedial PTS difference yielded intra- and interrater reliability comparable with existing methods but improved accuracy compared with MRI-based measurements alone.
Various studies have reported that the posterior tibial slope (PTS) influences knee sagittal balance and contributes to several pathological events.9,10,16,18,20,21 An increased tibial slope is a well-established risk factor for anterior cruciate ligament (ACL) rupture or degeneration.15,18,23,26 Notably, when the PTS exceeded 12°, the failure rate of ACL reconstruction significantly increased, with graft maturation being also affected. In such cases, a desloping osteotomy is recommended as revision surgery.6,8,12,22,26,28 Additionally, greater PTS has been shown to increase tension on the meniscus root and contribute to rotational instability, particularly when the lateral tibial slope is elevated.9,19,20,27,29,31,32
Recent studies have highlighted the importance of both overall PTS and mediolateral asymmetry. A systematic review by Jiang et al 16 reported a strong association between increased lateral PTS (LPTS) and lateral meniscal injuries in patients with ACL tears. Similarly, Dzidzishvili et al 9 emphasized that lateromedial slope asymmetry is linked to lateral meniscus root tears in ACL tear patients and may contribute to rotational instability, emphasizing the importance of considering plateau asymmetry alongside individual slope values. 9
However, because of varying measurement methods, researchers have employed different techniques. On plain radiographs, the reference points vary, with some using the anterior/posterior cortical line and others defining the axis based on the midcortical line assessed at a specific distance distal to the tibial plateau. 35 In magnetic resonance imaging (MRI), measurement techniques vary depending on the chosen axis, with Hudek et al’s 14 method being one of the most widely used.
Several studies have explored the correlation between measurements obtained from the knee lateral radiograph (LR) and the long-bone LR (LLR). Differences between anatomic and mechanical axis (MA)–based measurements have been identified, and studies have demonstrated a linear correlation when only half the tibia is imaged. Therefore, this has led to efforts to infer the long-bone tibial slope from half-tibia measurements.13,24
Previous studies comparing imaging modalities have typically analyzed 2 methods at a time: radiography versus MRI or MRI vs computed tomography (CT).15,32 We hypothesized that measurement error would be high and variable across imaging modalities and that 3-dimensional (3D) reconstructions would serve as a consistent and accurate reference for PTS assessment. Additionally, we aimed to evaluate the accuracy of calculating the lateral plateau slope using LLR- and MRI-derived asymmetry.
Methods
Inclusion and Exclusion Criteria
This study included patients who underwent primary ACL reconstruction between March 2020 and October 2023 and had preoperative radiographs, including lateral views of the lateral knee and tibia, as well as preoperative MRI. In addition, patients who underwent immediate postoperative CT for bone tunnel analysis were included in the study.
The exclusion criteria were as follows: osteoarthritis classified as Kellgren-Lawrence grade ≥2, concomitant fractures, and cases in which the preoperative bony anatomy was potentially deformed.
Plain Radiographs and MRI
All PTS measurements were independently performed by 2 orthopaedic surgeons specializing in sports medicine (J.-G.K. and Y.P.), with each observer conducting 2 rounds of evaluations for every imaging modality.
For the radiographic measurements, LRs of the knee and LLRs of the tibia were used. For LR, measurements were performed using the proximal anatomic axis (PAA) as the longitudinal axis. The PAA was determined by marking 1 point just distal to the tibial tubercle and another at the midpoint of the anterior and posterior cortices at the most distal level visible in the image. The line connecting these 2 points was defined as the PAA.
For LLR, the measurement was based on the MA, which is defined as the line connecting the midpoints of the medial tibial plateau (MTP) and the tibial plafond. The tibial plateau was defined by identifying the concave medial plateau and drawing a line connecting the most anterosuperior and posterosuperior points. It has been reported that distinguishing between the lateral tibial plateau (LTP) and MTP on simple radiographs is challenging, and several studies have not differentiated PTS into medial and lateral components.1,10 In this study, the anterosuperior and posterosuperior points of the concave-shaped MTP were identified and used to establish the plateau plane. In cases where the concave shape of the MTP was not visible, patients were excluded from the study due to suboptimal imaging (Figure 1).

Using simple lateral radiographs (LRs) and long-bone lateral radiographs (LLRs) as a measurement method, when the medial tibial plateau appears concave, the anterosuperior (AS) point and posterosuperior (PS) point can be clearly distinguished, and these points can also be identified at the same location in 3-dimensional (3D) reconstruction. (A) LLR; (B) simple LR; and (C) 3D lateral view (from the medial side). Blue dots indicate the AS and PS points of the medial tibial plateau. In (A), the 2 red dots denote the mechanical axis (tibial plateau to ankle center), and in (B), the 2 red dots indicate the anatomical axis (2 points distal to the tibial tuberosity).
The method described by Hudek et al 14 was implemented. The sagittal slice selected for analysis was one where the concave shape of the anterior and posterior tibial cortices, intercondylar eminence, and tibial attachment of the posterior cruciate ligament were visible. Two circles were drawn within this sagittal slice: a proximal circle in contact with the anterior, posterior, and cranial tibial cortices and a distal circle in contact with the anterior and posterior tibial cortices. The line connecting the centers of these 2 circles was defined as the longitudinal axis. The medial PTS (MPTS) and LPTS were evaluated in the central sagittal slices, where the centers of the MTP and LTP were visualized using the preserved longitudinal axis for consistency (Figure 2).

Magnetic resonance imaging measurement of the posterior tibial slope. According to the method by Hudek et al, 14 a reference line connecting the centers of the medial and lateral tibial plateaus was identified on the axial view (D). In this view, three lines labeled 1, 2, and 3 correspond to (A), (B), and (C), representing the tibial center, medial tibial plateau center, and lateral tibial plateau center, respectively. In the sagittal view, a line tangent to each plateau was drawn: (B) the medial plateau and (C) the lateral plateau. (A) On the sagittal cut displaying the posterior cruciate ligament attachment, the tibial eminence, and where the anterior cortex transitions into a concave shape, a proximal circle was drawn in contact with the anterior, posterior, and cranial tibial cortices. Another circle was subsequently drawn with its center positioned on the first circle while remaining tangent to the anterior and posterior cortices (sagittal view at the tibial center).
3D CT Model Reconstruction and Measurement of PTS
Postoperative CT scans included not only the knee but also the proximal femur and distal tibia. The Somatom Sensation 64 scanner (Siemens) was utilized, with a slice thickness of 0.6 to 1.0 mm, a field of view ranging from 195 to 333 mm, and an acquisition matrix of 512 × 512 pixels. Digital Imaging and Communications in Medicine data were extracted from each patient's picture archiving and communication system (GE Healthcare). Using Mimics software (Version 17; Materialize), the proximal and distal tibias were segmented to create a 3D volumetric model.
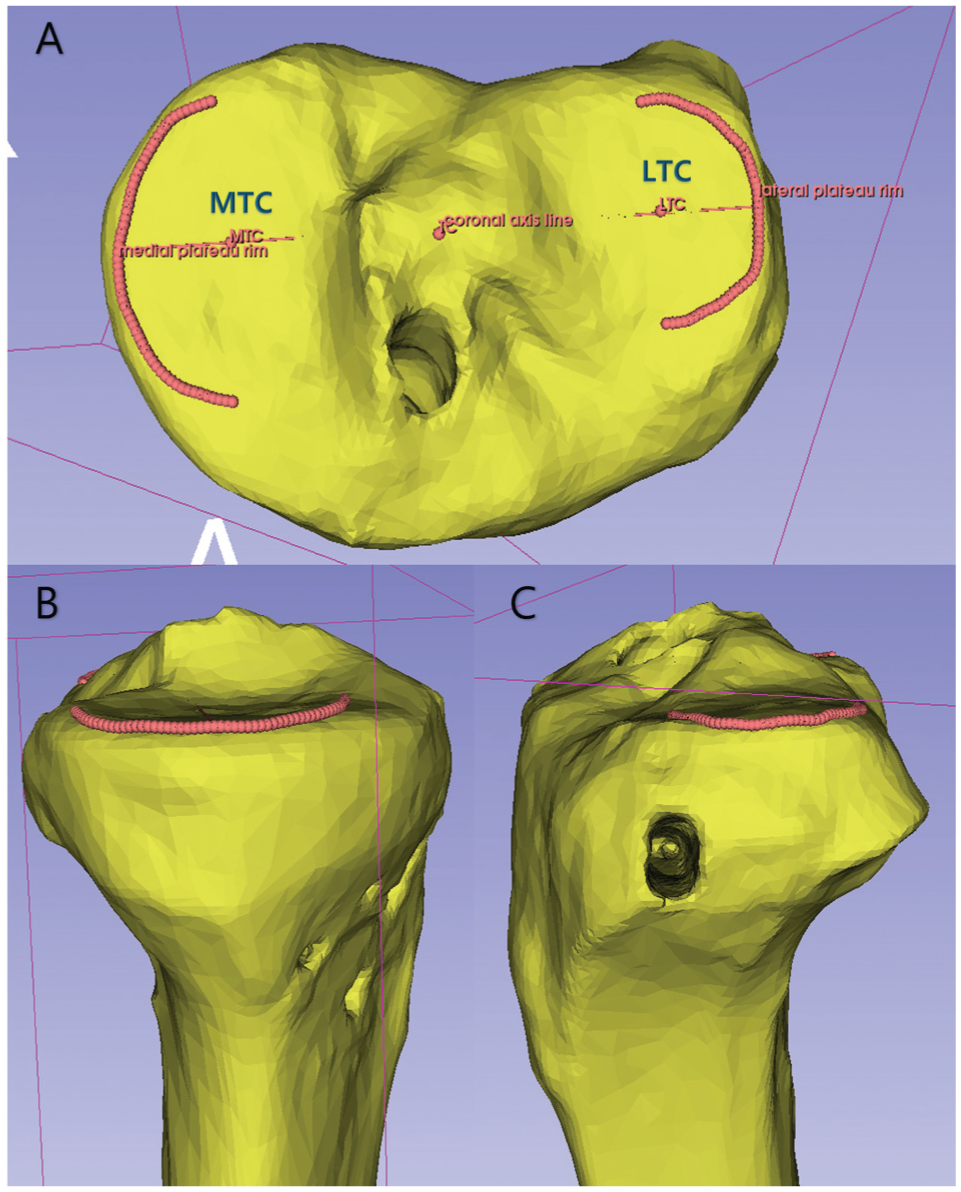
The tibial sagittal plane and MA were assessed using 3-matic software (Version 17; Materialize). The centers of the sMTP and LTPs were determined using a best-fit circle method, referencing Jung et al. 17 The center of each best-fit circle was defined as the medial tibial center (MTC) and lateral tibia center (LTC), respectively. A line connecting these 2 centers was established, defining the tibial center (TC) as the point on this line closest to the center of the medial/lateral eminence. The center of the distal tibial plafond was defined as the ankle center (AC). The MA was defined as the line connecting the TC and AC. The tibial coronal plane was defined as the plane passing through MTC, LTC, and AC. Additionally, the sagittal plane was defined as the plane perpendicular to the coronal plane while passing through the TC and AC (Figure 3).

(A) Best-fit circles for the medial and lateral plateaus were determined, with their centers designated as the medial tibial center (MTC) and lateral tibial center (LTC), respectively, to establish the tibial sagittal plane and mechanical axis. Each circle was constructed using 3 points: the most posterior, lateral, and anterior points, marked and then drawn as circles passing through these points. The midpoint of the medial and lateral eminences along the line connecting MTC and LTC was defined as the tibial center (TC). (B) The center of the tibial plafond was identified as the ankle center (AC). (C) The coronal plane was defined as the plane passing through MTC, LTC, and AC. The sagittal plane (illustrated as the red plane in the figure) was defined as the plane perpendicular to the coronal plane and passing through both TC and AC. The mechanical axis was defined as the line connecting TC and AC.
A 3D slicer (open-source software initially developed by the Surgical Planning Laboratory at Brigham and Women's Hospital, Harvard Medical School, and now maintained by the Slicer Community) was employed to define the peripheral rim of each tibial plateau. Following a modified version of Amirtharaj et al’s 1 method, approximately 20 points were placed along the peripheral rims of both the MTP and the LTP, evenly distributed over 180°. To ensure consistency across cases, the curve formed by these points was resampled to 60 points. The best-fit plane was then computed for each plateau by determining the normal vector of the plane that minimized the sum of the squared distances from the 60 points (Figure 4).
(A) Best-fit circles centered at the medial tibial center (MTC) and lateral tibial center (LTC) are created to establish the medial and lateral tibial plateau planes. Approximately 20 points are manually placed along each circle, followed by resampling to 60 points. (B, C) Lateral views illustrate the placement of points as close as possible to the plane, followed by resampling. (B) represents the medial plateau, while (C) represents the lateral plateau.
The normal vectors of the medial and lateral plateau planes were calculated using this method. Subsequently, the PTS was measured using a 3-matic, determining the angle between the MA and the vertical vector of the medial/lateral plateau planes within the sagittal plane. These angles are defined as the MPTS and LPTS.
Statistical Analysis
To assess the reliability of the MPTS and LPTS measurements, 2 orthopaedic surgeons (J.-G.K. and Y.P.) independently performed each measurement twice. Intraclass correlation coefficients (ICCs) were calculated to evaluate intrarater, interrater, and intermethod agreements. According to the standard interpretation, ICC values were classified as excellent (≥0.90), good (0.75-0.89), moderate (0.50-0.74), and poor (<0.50).
In addition, Bland-Altman analysis was performed to calculate the 95% limits of agreement (LOA), quantifying the variability between measurements. Furthermore, following the method described by Wen et al, 32 we calculated the proportion of measurements within a predefined clinically acceptable range (≤2°) for intrarater, interrater, and intermethod comparisons across each imaging modality. This range was defined based on Wen et al's rationale that, for the 12° cutoff value—used clinically to decide on desloping osteotomy in revisional ACL procedures—an error of >2° would significantly affect the surgical decision-making process. A P value <.05 was considered statistically significant. All statistical analyses were performed using RStudio (Version 4.4.2; Posit).
Results
Participant Selection
Between March 2020 and October 2023, 132 patients underwent primary ACL reconstruction and had imaging data available from preoperative LRs, LLRs, MRI, and immediate postoperative CT scans. After applying the exclusion criteria and conducting random selection, a final group of 32 knees of 32 patients was included in the analysis. Among them, 24 were males and 8 were females, with a mean age of 31.3 years (range, 13-60 years) and a mean body mass index of 23.8 kg/m2 (range, 17.4-31.6 kg/m2).
Reliability and Measurement Variability of PTS Across Imaging Modalities
Radiographic Measurements
Simple radiographs, including LR and LLR, demonstrated good to excellent ICCs ranging from 0.72 to 0.93. Intrarater variability was minimal, and the proportion of measurements falling within the predefined acceptable LOA of ±2° was high, ranging from 87.5% to 93.75%.
However, interrater comparisons revealed greater measurement error in LR, with a 95% LOA of −2.96° to 4.59°, and only 68.75% of cases fell within the acceptable LOA range. In contrast, LLR exhibited lower interrater measurement error (95% LOA, −2.23° to 2.61°) and a higher proportion of measurements (84.38%) within the acceptable LOA range for both intra- and interrater assessments, indicating better reproducibility compared with LR.
MRI Measurements
For the MRI-based measurements, the intrarater reliability was moderate-to-good, with ICCs ranging from 0.688 to 0.789 for the MTP and 0.649 to 0.704 for the LTP. Interrater reliability also demonstrated moderate agreement, with ICCs of 0.723 and 0.771 for MTP and LTP, respectively. However, substantial measurement variability was observed in both the intra- and the interrater comparisons, as reflected by the broad 95% LOA range. Specifically, the intrarater 95% LOA values were as follows: rater 1 (MTP, –5.08° to 4.80°; LTP, –5.36° to 5.73°) and rater 2 (MTP, –4.53° to 4.55°; LTP, –5.96° to 5.44°). The interrater 95% LOA was −4.41° to 4.77° for MTP and −3.47° to 4.89° for LTP.
Moreover, the proportion of measurements within the acceptable ±2° LOA threshold was relatively low, highlighting a high degree of variability. Only 59.38% to 65.62% of MTP and 43.75% to 62.50% of LTP measurements were within this range, indicating considerable intra- and interrater discrepancies.
Despite the variability observed in individual MTP and LTP measurements, the difference between these measurements demonstrated significant reliability, with ICCs ranging from 0.75 to 0.85. Measurement variability was also low for this parameter, with intrarater 95% LOA values ranging from −2.27° to 2.92° for rater 1 and −3.60° to 3.06° for rater 2, while interrater LOA was −2.81° to 3.86°. The proportion of cases meeting the ≤2° LOA threshold was notably higher (75.00% to 87.50%) than that noted with individual MTP or LTP measurements, suggesting that relative differences between the 2 may be more reproducible than absolute values of either parameter.
3D Reconstruction Imaging
Measurements derived from 3D reconstruction imaging demonstrated excellent reliability across all parameters (MTP, LTP, and LTP-MTP), with ICC values >0.90. Furthermore, the measurement variability was minimal, as indicated by the narrow 95% LOA range. More than 90% of the measurements fell within the predefined ±2° LOA, indicating high consistency and reproducibility in this imaging modality (Table 1).
Intra- and Interrater Correlation, PTS Angles, and Variability Using 95% LOA and Acceptable Range (≤2°) a

3D, 3-dimensional; ICC, intraclass correlation coefficient; LLR, long-bone lateral radiograph; LOA, limits of agreement; LR, lateral radiograph; LTP, lateral tibial plateau; MRI, magnetic resonance imaging; MTP, medial tibial plateau; PTS, posterior tibial slope.
Rater 1 and rater 2 represent intrarater assessments, whereas interrater reliability was evaluated based on the difference between the mean values of the 2 raters.
Values are presented as mean ± SD.
In the "Rater" column, the intrarater (rater 1, rater 2) rows compare the differences between the 2 repeated measurements of each rater. The interrater row compares the difference between the 2 raters’ mean values, with bias and 95% LOA (in degrees) calculated by subtracting rater 2’s values from those of rater 1.
Intermethod Correlation
The ICC and 95% LOA were calculated to evaluate the correlation between various imaging modalities. The ICC between LR and LLR was 0.71, and that between LR and 3D was 0.63, indicating a moderate correlation. The LR-LLR bias was −1.07° (95% LOA, –5.73° to 3.60°), with 64.06% of cases falling within the acceptable LOA threshold of 2°. The ICC between LLR and 3D was 0.88, representing a good correlation, with a bias of 0.38° (95% LOA, −2.72° to 3.48°). Additionally, 78.12% of cases were within the acceptable LOA.
By contrast, MRI (MTP) exhibited weak correlations with LR, LLR, and 3D (MTP), with ICC values of 0.38, 0.31, and 0.37, respectively. The bias between LR and MRI (MTP) was 5.23° (95% LOA, –1.87° to 12.34°), while between LLR and MRI (MTP), it was 6.30° (95% LOA, –1.14° to 13.73°). These results suggest that both LR and LLR measurements were higher than MRI (MTP) values, with high variability. The bias between MRI (MTP) and 3D (MTP) was −5.92° (95% LOA, –12.92° to 1.08°), indicating that MRI measurements tended to be lower than those from 3D imaging.
For LTP measurements, the correlation between MRI and 3D images was 0.44, indicating a poor correlation, whereas the LTP-MTP difference demonstrated a good correlation of 0.81, suggesting high consistency in this parameter. The MRI-3D bias for LTP was −5.36° (95% LOA, –12.66° to 1.94°), demonstrating substantial variability with MRI values being lower than those of 3D imaging. Conversely, the LTP-MTP bias was 0.56° (95% LOA, −2.83° to 3.95°), with 73.44% of cases within the acceptable LOA threshold.
Overall, while LR and LLR demonstrated moderate-to-good correlations with 3D imaging, MRI measurements exhibited weak correlations with LR, LLR, and 3D imaging, particularly for the MTP slopes. MRI also demonstrated greater variability, particularly in lateral slope measurements. However, the LTP-MTP difference exhibited high consistency across modalities (Table 2 and Figure 5).
Intermethod Correlation and Variability Using 95% LOA and Acceptable Range (≤2°) a
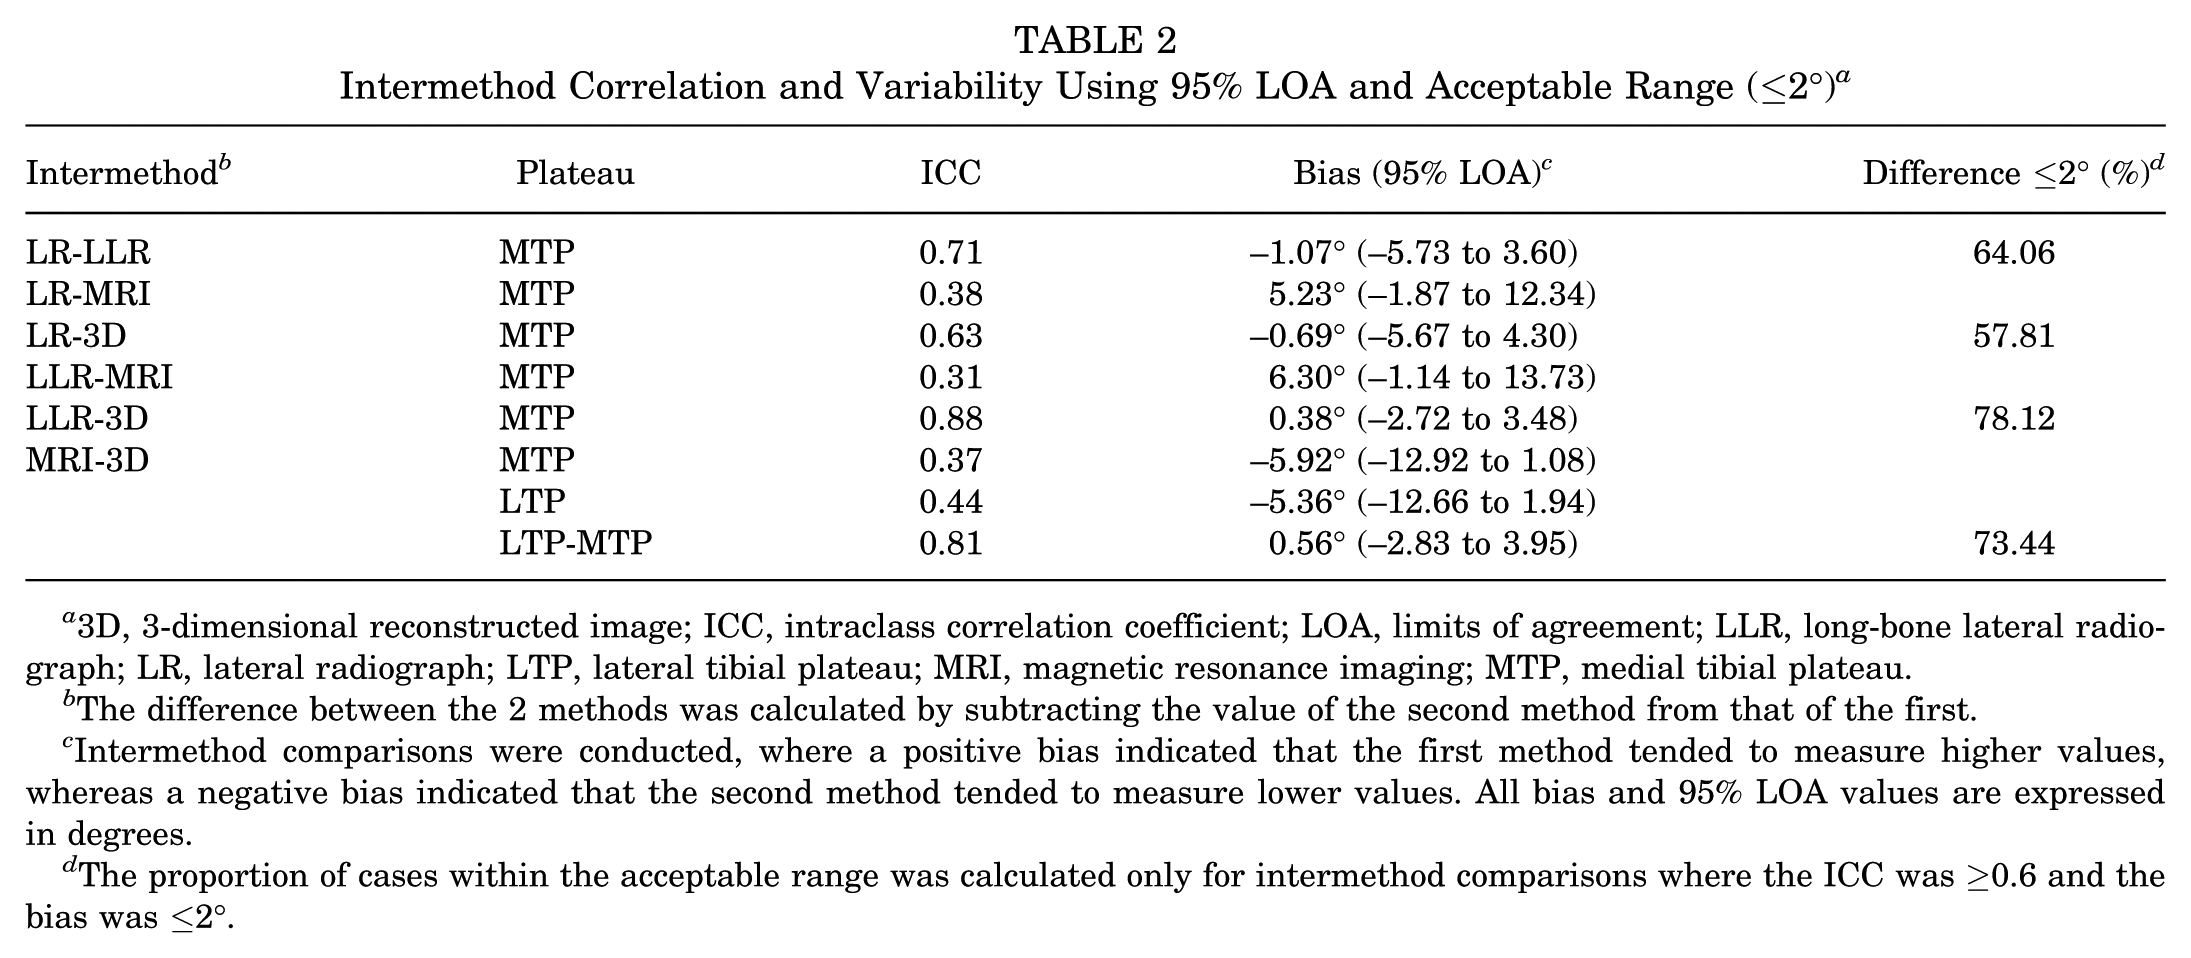
3D, 3-dimensional reconstructed image; ICC, intraclass correlation coefficient; LOA, limits of agreement; LLR, long-bone lateral radiograph; LR, lateral radiograph; LTP, lateral tibial plateau; MRI, magnetic resonance imaging; MTP, medial tibial plateau.
The difference between the 2 methods was calculated by subtracting the value of the second method from that of the first.
Intermethod comparisons were conducted, where a positive bias indicated that the first method tended to measure higher values, whereas a negative bias indicated that the second method tended to measure lower values. All bias and 95% LOA values are expressed in degrees.
The proportion of cases within the acceptable range was calculated only for intermethod comparisons where the ICC was ≥0.6 and the bias was ≤2°.
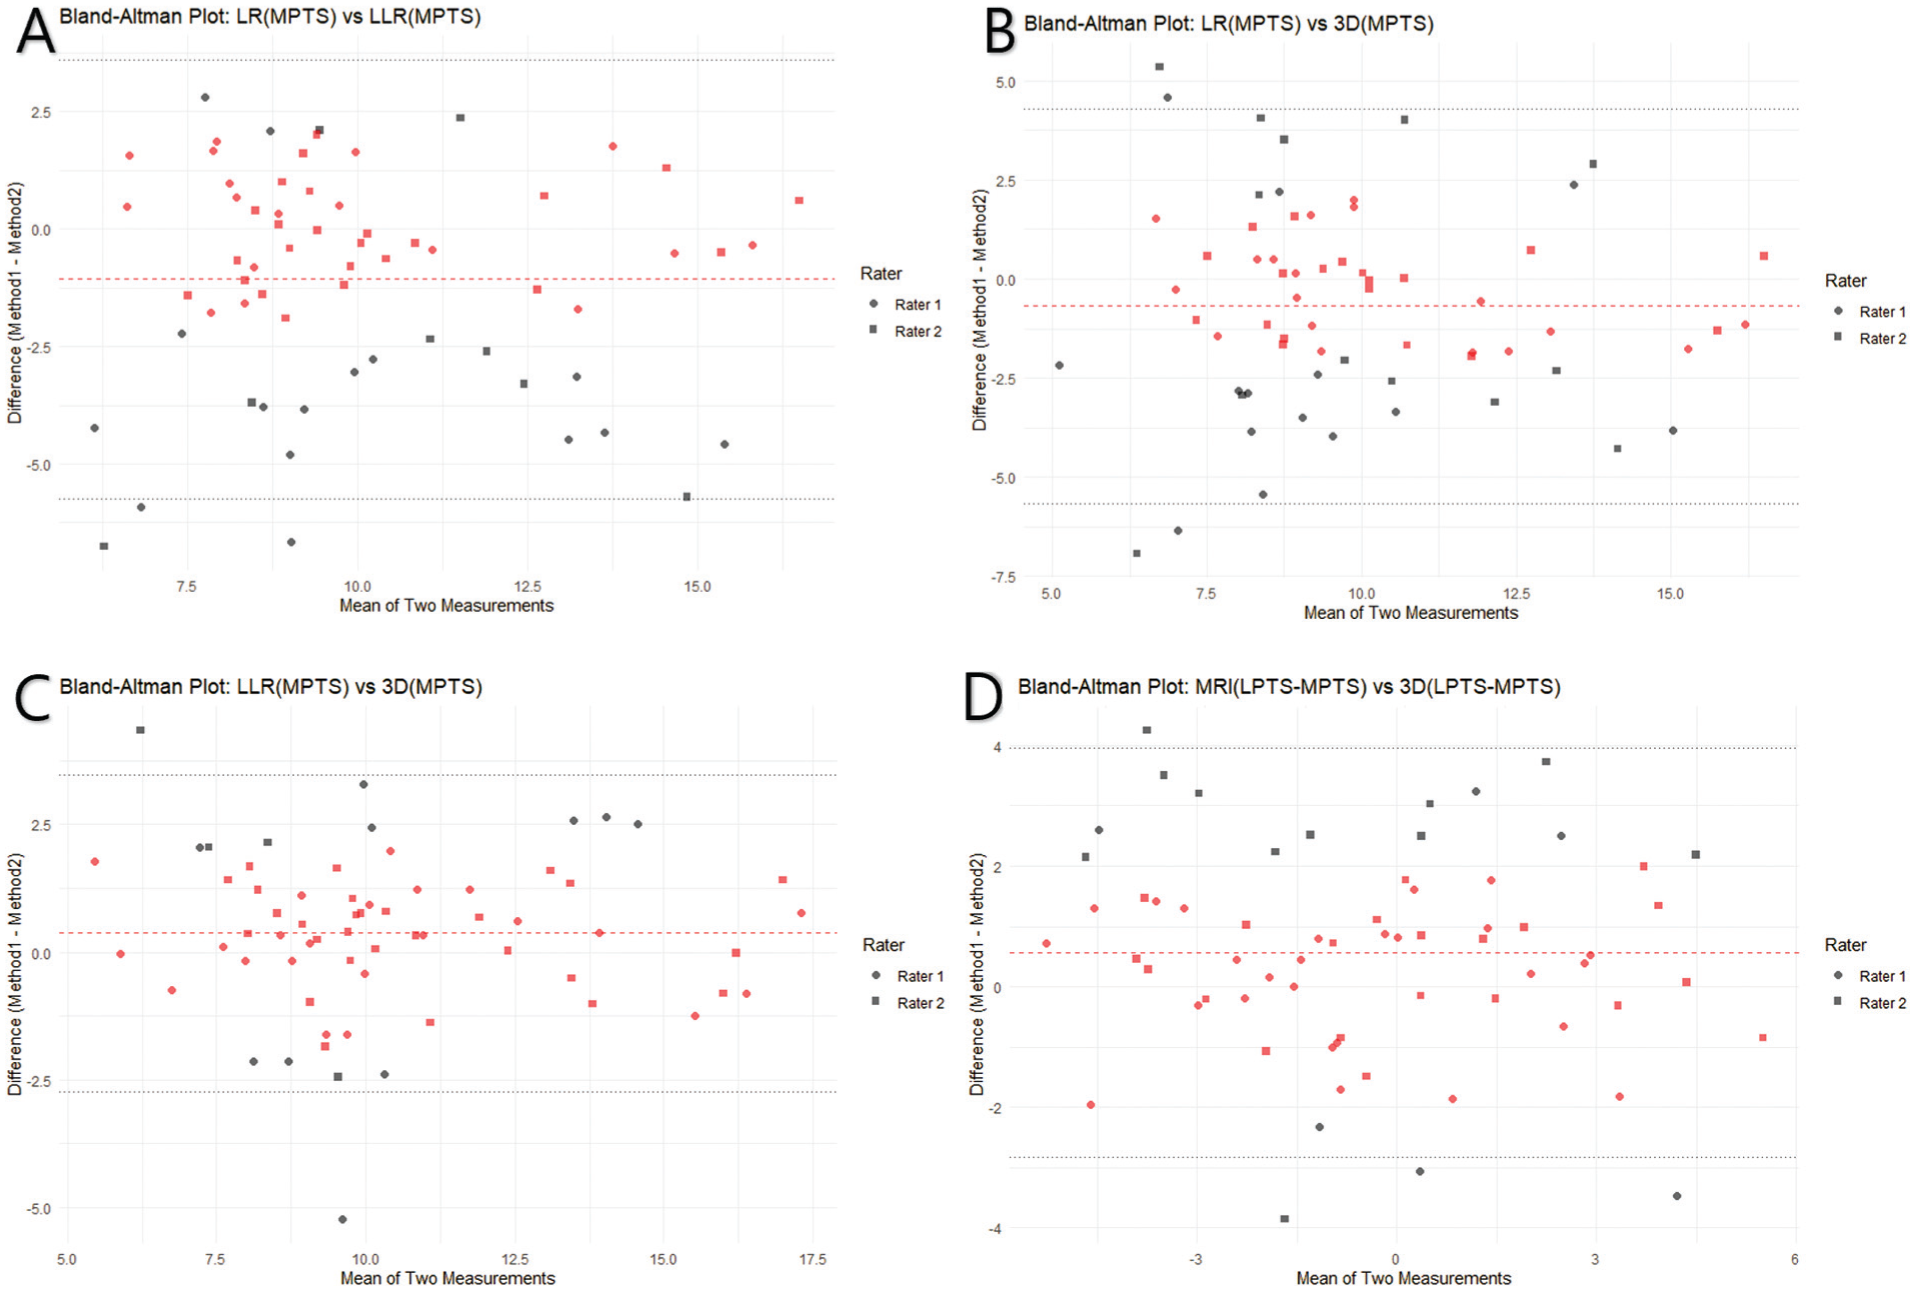
Bland-Altman plots were generated for 4 method combinations where the intermethod bias was ≤2° and the intraclass correlation coefficient was ≥0.6. Circle dots represent measurements by rater 1, while rectangular dots represent measurements by rater 2. Red dots indicate differences within ±2°, while black dots indicate differences exceeding ±2°. The red dashed horizontal line represents the mean bias, and the black dashed horizontal lines indicate the upper and lower limits of agreement (95% limits of agreement). (A) LR vs LLR, (B) LR vs 3D, and (C) LLR vs 3D represent MPTS measurements. (D) MRI vs 3D represents the LTP-MTP difference. 3D, 3-dimensional; LLR, long-bone lateral radiograph; LR, lateral radiograph; MRI, magnetic resonance imaging; MPTS, medial posterior tibial slope; MTP, medial tibial plateau; LPTS, lateral posterior tibial slope; LTP, lateral tibial plateau.
Predicting the Lateral Plateau Slope Model
Using a 3D reconstruction model with an extremely low measurement error and excellent ICC as the reference standard, we confirmed that the MPTS measured using the long bone demonstrated very high agreement. Additionally, the LTP-MTP difference measured on MRI exhibited a highly significant correlation with 3D reconstruction analysis.
When the LTP was calculated as the sum of the LLR-based MPTS and the MRI-derived LTP-MTP difference, the ICC with the 3D-reconstructed LPTS was 0.801. A strong linear correlation was also observed (Pearson r, 0.826; P < .001) (Figure 6). In the intermethod comparison of the predicted values and actual 3D values, the 95% LOA was −4.955° to 3.186°. The proportion of data points within the error margin of ≤2° was 54.69%.

The linear relationship between predicted lateral posterior tibial slope (LPTS) and 3-dimensional (3D) reconstruction image LPTS. The predicted LPTS is calculated as the sum of the long bone lateral radiograph medial posterior tibial slope (MPTS) and the magnetic imaging resonance (MRI)–derived lateral tibial slope (LTP)–medial tibial plateau (MTP) difference. A strong positive correlation is observed between the predicted LPTS and the LPTS measured using the 3D reconstruction image, with a Pearson correlation coefficient of 0.826. The x-axis represents the predicted LPTS, while the y-axis represents the actual LPTS obtained from the 3D reconstruction image. LLR, long-bone lateral radiograph.
Discussion
This study introduces a more precise method for determining reference points in PTS measurement using 3D analysis, which surpasses the accuracy of conventional radiograph-based assessments. Additionally, our findings highlight the significant inconsistencies in existing MRI-based measurement techniques, particularly in distinguishing MPTS and LPTS. While individual MPTS LPTS values exhibited remarkable consistency and accuracy, we propose that calculating lateromedial PTS asymmetry in MRI scans provides a more reliable measurement than assessing separate medial and lateral values.
Multiple studies have confirmed that PTS affects the knee sagittal balance, leading to increased anterior tibial translation. Therefore, PTS contributes to various pathological conditions. Notably, when the PTS exceeded 12°, the failure rate of ACL reconstruction significantly increased, with graft maturation also being affected. A desloping osteotomy is recommended as revision surgery.6,8,12,22,26,28 This phenomenon can be explained by biomechanical studies, which demonstrate that an increased slope leads to increased forces on the ACL graft.3,29 Additionally, an increased lateral tibial slope is associated with a high likelihood of rotational instability.27,29
Recently, the relationship between PTS and meniscal injuries has gained increasing recognition. A systematic review by Jiang et al 16 reported that an increased LPTS was associated with lateral meniscal injuries in patients with ACL injuries. Dzidzishvili et al 9 conducted another systematic review that further emphasized that, in addition to MPTS and LPTS, lateromedial slope asymmetry is associated with lateral meniscus root tears in ACL tear patients and may potentially contribute to rotational instability, highlighting the importance of considering plateau asymmetry alongside individual slope values.9,16
As multiple studies have stressed the clinical significance of PTS, determining an accurate cutoff value is essential for guiding corrective strategies. Therefore, a consistent and reliable measurement method is required to achieve this goal. Although simple radiographs (LR and LLR) are commonly employed, measuring the lateral plateau can be challenging. As a result, MRI-based methods including the technique introduced by Hudek et al, 14 which separately measures the MPTS and LPTS, have been widely adopted. Weiler et al 30 reported excellent inter- and intrarater reliabilities using conventional LR. Other studies also documented high agreement between LR and LLR. 24 However, Dean et al 7 discovered that while LR-based anatomic axis measurements aligned with LLR-based MA measurements, LLR-based anatomic axis measurements were significantly higher than LR measurements.
However, the reliability of MRI-based MPTS measurement remains questionable. Wen et al 32 reported moderate-to-good ICC values for measuring PTS using MRI, but their 95% LOA were wide. When an acceptable LOA was set at 2°, only 47.63% to 60.87% of the measurements met this threshold. Additionally, studies comparing MRI and simple radiography have demonstrated that MRI measurements tend to be approximately 5° higher than LR measurements, with LR being considered the more accurate method. 11 Our study identified a bias of 5.23° when comparing LR and MRI measurements.
Attempts have been made to measure PTS using 3D imaging techniques; however, these studies ultimately relied on measuring PTS from sagittal slices of the reconstructed 3D images.2,5 Our study adopted a relatively direct approach, inspired by Amirtharaj et al, 1 who calculated the best-fit plane of the tibial plateau by minimizing the sum of squared distances from peripheral rim points. This plane was then projected onto the sagittal plane to directly evaluate PTS. 29
Our findings demonstrated good-to-excellent ICC for both LR and LLR, with minimal intrarater error. However, in interrater comparisons, LLR demonstrated superior reliability, with a bias of 0.18° and 84.38% of the measurements within an acceptable LOA of 2°. Conversely, the LR had an elevated bias of 0.82° and an acceptable LOA rate of 68.75%. This discrepancy is likely attributed to differences in the axis definition, as LLR uses the knee and ankle centers to define the MA, whereas LR relies on 2 points within the proximal tibia. When comparing LLR to 3D reconstruction–based MPTS measurements, a bias of 0.38° (95% LOA, −2.72° to 3.48°) and an acceptable LOA rate of 78.12% indicated high agreement.
In the MRI-based measurements, both MTP and LTP exhibited moderate-to-good ICC values; however, significant variability was observed. The proportion of measurements meeting the acceptable LOA threshold ranged from 43.75% to 65.62%, which was consistent with the findings of Wen et al. 32 However, the LTP-MTP difference measurements exhibited better reliability, with ICC values in the moderate-to-good range and acceptable LOA rates of 75.00% to 87.50%. Furthermore, when comparing LTP-MTP asymmetry between MRI and 3D reconstruction images, we observed an ICC of 0.81 and a bias of 0.56° (95% LOA, −2.83° to 3.95°), indicating strong agreement.
The clinical implications of LTP-MTP asymmetry have been well-established in previous studies. The asymmetry has been linked to ACL degeneration and tears, serves as a predictor of ACL reconstruction failure, and influences both the occurrence and the repair outcomes of meniscus root tears.4,19,25,33,34
In summary, MPTS measurement demonstrated the highest accuracy when performed using LLR that encompassed the entire tibia. Among the MRI-based measurements, the LTP-MTP asymmetry metric exhibited superior reliability and accuracy compared with individual MTP or LTP values. Given the challenges of measuring LTP on standard radiographs, we discovered that the sum of the LLR-based MPTS (measured using the MA) and the MRI-derived LTP-MTP difference exhibited good reliability (ICC, 0.801) and strong linear correlation with the 3D-reconstructed LPTS (Pearson r, 0.826; P < .001). Although the variability observed in MRI-based LTP measurement may appear similar to previous findings (95% LOA, –4.955° to 3.186°; difference ≤2°, 54.69%), this comparison was conducted between different methods (intermethod analysis using 3D reconstruction). However, despite the comparable variability, our newly proposed method, which specifically measures LPTS, demonstrated a stronger correlation with actual 3D-reconstructed PTS values, suggesting that it provides a more accurate reflection of true anatomic measurements.
Limitations
This study had several limitations. First, this was a retrospective single-center study, which limited the generalizability of our findings. Additionally, as the study focused solely on patients with ACL rupture, the PTS values reported may not apply to the general population. This limitation arises from the fact that we conducted postoperative CT scans, including the distal tibia, and categorized patients without arthritic changes within the 3D reconstruction–capable cohort as part of the ACL reconstruction group. Additionally, the limitations related to gender distribution and the ACL patient cohort differ from those of other studies, as our research focuses on evaluating measurement methodologies rather than drawing direct clinical conclusions. Consequently, these factors do not diminish the validity of our observations but rather highlight the distinct nature of our approach. Additionally, because this study does not aim to determine the clinical relationship between ACL and PTS, a power analysis was not performed. Finally, while Amirtharaj et al 1 proposed an automated method for identifying peripheral rim points in 3D imaging, our study relied on a manual definition of these points, introducing a potential source of measurement variability.
Conclusion
MPTS measurement using anterosuperior and posterosuperior reference points in lateral views (LR and LLR) proved to be highly accurate and consistent. In MRI, only the lateromedial PTS asymmetry demonstrated reliability and consistency. To estimate LPTS, combining the LLR-based MPTS with the MRI-derived lateromedial PTS difference yielded intra- and interrater reliability comparable with existing methods but improved accuracy compared with MRI-based measurements alone.
Footnotes
Final revision submitted June 14, 2025; accepted July 8, 2025.
The authors declared that there are no conflicts of interest in the authorship and publication of this contribution. AOSSM checks author disclosures against the Open Payments Database (OPD). AOSSM has not conducted an independent investigation on the OPD and disclaims any liability or responsibility relating thereto.
Ethical approval for this study was obtained from Gangnam Severance Hospital (No. 3-2024-0471).