
Abstract
Background:
Many athletes expect to return to previous levels of performance (RTP) within 12 months after anterior cruciate ligament (ACL) reconstruction (ACLR) while ACL graft remodeling takes from 6 to 48 months. Therefore, RTP might deteriorate the ACL graft remodeling process.
Purpose/Hypothesis:
The purpose of this study was to evaluate the changes of signal intensity in ACL graft and assess whether RTP affects ACL graft remodeling after ACLR using bone–patellar tendon–bone (BPTB) autograft with a serial 3.0-T magnetic resonance image (MRI) at 6, 12, and 24 months. It was hypothesized that signal intensity reduction in ACL graft on MRI might be delayed by RTP within 12 months after ACLR using BPTB autograft.
Study Design:
Cross-sectional study; Level of evidence, 3.
Methods:
This retrospective cohort study consisted of 115 patients (48 male, 67 female) who underwent primary ACLR using BPTB autograft between 2018 and 2021, including 4 female patients with ACL graft rupture within 24 months. The signal-to-noise quotient (SNQ) values at intra-articular ACL graft on serial MRIs and the amount of change in SNQ value (1) from 6 to 12 months after ACLR (ΔSNQ [6-12]) and (2) from 12 to 24 months after ACLR (ΔSNQ [12-24]) were calculated. Patients were divided into 2 groups depending on whether patients were able to RTP (group A) or not (group B). To investigate the associated factors with ΔSNQ (6-12) and ΔSNQ (12-24), a fixed-effect multivariate logistic regression analysis was conducted with age, sex, body mass index (BMI), cartilage injury, postoperative Tegner score, and RTP as associated variables.
Results:
Of 111 patients with ≥24 months follow-up, 83 patients (74.8%) were able to RTP within a mean time of 10.4 months (range, 6.5-18 months). The mean ± SD SNQ values (6 months, 1.21 ± 1.94; 12 months, 1.16 ± 2.38; 24 months, 1.42 ± 2.65) did not vary over time. Mean ± SD ΔSNQ (6-12) and ΔSNQ (12-24) were −0.05 ± 2.29 and 0.26 ± 1.83, respectively. There were no significant differences in the SNQ values and ΔSNQs between groups A and B. The multivariate logistic regression analysis showed that postoperative Tegner score and RTP were not associated with ΔSNQ while higher BMI increased ΔSNQ (6-12) (odds ratio, 1.147; 95% CI, 1.016-1.295; P = .03).
Conclusion:
RTP around 10 months after ACLR using BPTB autograft was not associated with SNQ reduction in ACL graft.
Keywords
The graft transplanted in the intra-articular environment in anterior cruciate ligament (ACL) reconstruction (ACLR) undergoes several remodeling processes termed ligamentization postoperatively.15,18 The histological appearance and biomechanical properties of the implanted graft gradually change. 28 The reported length of this process varies from 6 to 48 months. 1 In recent studies,8,23,30 the quantitative assessment of graft maturation evaluation was made possible by measuring signal intensity using magnetic resonance imaging (MRI). 17 Signal intensity changes of the ACL graft on MRI are believed to be correlated with the progress of graft maturation in human patients. 13 Lower signal-to-noise quotient (SNQ) values on MRI are considered to represent a reduction in vascularity and water content, indicating a later period of ligamentization and better graft maturity. 29
After ACLR, the timing of return to competitive sports is one of the most controversial issues in sports medicine. Many athletes expect to resume their sport within 12 months of ACLR since return to preinjury levels of performance (RTP) is the main goal after ACLR.3,24,27 Therefore, there should be a discrepancy between the time frame taken for ACL graft remodeling (from 6 to 48 months) and a target-based recovery with a return to sport-specific training permitted at 9 to 12 months. Although serial MRI even after RTP should be needed to monitor the longitudinal changes of graft maturation,23,26,30 most of the previous studies conducted postoperative MRI around 1 year after ACLR,8,17 a time point at which most patients want to return to sports. 26
This study aims to evaluate the changes of signal intensity in ACL graft and assess whether RTP affects ACL graft remodeling after ACLR using bone–patellar tendon–bone (BPTB) autograft with a serial 3.0-T MRI. The hypothesis was that signal intensity reduction in ACL graft on MRI might be delayed by RTP within 12 months after ACLR using BPTB autograft.
Methods
The ethics committee of our institution approved this retrospective cohort study of 115 patients who underwent primary ACLR using BPTB autograft by a single surgeon (T.T.) between 2018 and 2021 before the prospective observation, and informed consent was obtained from all participants. Of these 115 patients, there were 4 female patients (mean age, 22.0 years old [range, 14-44]) with ACL graft rupture within 24 months (mean time, 11.8 months [range, 6-22]) after ACLR. The inclusion criterion was >24 months follow-up after ACL with computed tomography (CT) scan at 1 week postoperatively and serial MRI examination at 6, 12, and 24 months postoperatively as the standard of care. Exclusion criteria were multiligament knee injury, revision ACLR, previous knee injury or surgery on the affected or contralateral knee, and <24 months of follow-up. The flowchart of patient inclusion is shown in Figure 1.

Summary of patient enrollment. ACL, anterior cruciate ligament; ACLR, anterior cruciate ligament reconstruction;. BPTB, bone–patellar tendon–bone autograft; RTP, return to preinjury level of performance.
Surgical Technique
As previously described, the central third of the patellar tendon was harvested. 25 The femoral tunnel was created by modified transtibial technique. The BPTB autograft (9 to 10 mm–diameter) was fixed using Endobutton CL BTB (Smith & Nephew) on the femur and Double Spike Plate (Smith & Nephew), which was linked to the bone plug of the BPTB with 2 No. 5 Ethibond Excel Sutures (Ethicon Inc) on the tibia.
Postoperative Rehabilitation
A knee brace was applied for 1 week postoperatively. The patients were allowed partial weightbearing at 1 week and full weightbearing at 4 weeks. In patients with meniscal repairs, full weightbearing was allowed at 6 weeks. Single-leg hop test was performed at 6, 8, 10, and 12 months postoperatively. Once the patients achieved >90% of the limb symmetry index for single-leg hop test, they were cleared to begin reintegration into their RTP. When the patients were able to RTP, the self-reported timing of RTP was noted.
CT Measurement
A CT scanner (Brilliance CT 6; Philips Medical Systems) was used for all patients. Femoral graft bending angle (GBA), which could affect ACL graft healing, 21 was measured using a reconstructed 2-dimensional image that showed the center of the femoral tunnel exit and femoral and tibial tunnel aperture in 1 slice according to our previous report. 25
MRI Evaluation
At 6, 12, and 24 months after surgery, the patients underwent MRI on a 3.0-T scanner (SIGNA Pioneer 3.0 T; GE HealthCare) with an 18-channel knee coil. All patients were examined using standard MRI protocol for the knee followed by a sagittal oblique technique showing the full course of the ACL graft.
The standard MRI scanning sequences and scanning order were coronal and sagittal T2 fast spin-echo sequences [repetition time/echo time (TR/TE), 5125 ms/100 ms; field of view (FOV), 140 mm; matrix size, 416 × 224; slice thickness/slice spacing, 3.0 mm/0.6 mm], coronal fat suppression intermediate-weighted imaging (FS-PDWI) [TR/TE, 2000 ms/20 ms; FOV, 140 mm; matrix size, 384 × 256; slice thickness/slice spacing, 3.0 mm/0.6 mm], and sagittal FS-PDWI [TR/TE, 2900 ms/40 ms; FOV, 140 mm; matrix size, 352 × 288; slice thickness/slice spacing, 3.0 mm/0.6 mm]. Sagittal oblique T2 fast spin-echo sequences [TR/TE, 2500 ms/100 ms; FOV, 140 mm; matrix size, 416 × 224; slice thickness/slice spacing, 2.2 mm/0.4 mm] were angled depending on the actual course of the ACL graft.
SNQ Calculation
The signal intensity (SI) was measured in 3 regions (proximal, middle, and distal sites) of the intra-articular ACL graft, the quadriceps tendon site (1 cm proximal to the patellar upper limit level), and the background (2 cm anterior to the patellar tendon) using 4 mm–diameter circular regions of interest (ROIs) (Figure 2).17,29

Placement of the regions of interest on magnetic resonance imaging. Distal region (1); middle region (2); proximal region (3); quadriceps tendon, 1 cm proximal to the patellar upper limit level (Q); background, 2 cm anterior to the patellar tendon (B).
The proximal ROI was placed just distal to the femoral tunnel aperture while the distal ROI was just proximal to the tibial tunnel aperture. The middle ROI was set in the middle of the proximal and distal ROIs. The SNQ was calculated for each ACL graft region with the following formula: SNQ = (SI of ACL graft – SI of quadriceps) / SI of background.17,29
The mean SNQ of the 3 regions was calculated and used as the SNQ value of the ACL graft.17,29 The amount of change in the SNQ value (1) from 6 to 12 months after ACLR (ΔSNQ [6-12]) and (2) from 12 to 24 months after ACLR (ΔSNQ [12-24]) was calculated.
Medial and Lateral Tibial Posterior Slope
The medial and lateral tibial posterior slope (PTS) on MRI was measured based on the previous study. 9
Postoperative Clinical Evaluation
The patients were followed up in the same outpatient department at regular postoperative visits (6, 8, 10, 12, 18, and ≥24 months after surgery) with a comprehensive physical examination. Comparing the preinjury and postoperative Tegner score, RTP was defined as a return to the preinjury-defined sport and performance at or above the preinjury level at any postoperative visit during follow-up or final follow-up. 10 The timing of RTP after ACLR was assessed. ACL graft rupture was determined by the clinical examination including the Lachman and pivot-shift tests and MRI evaluation.
Age at ACLR, sex, body mass index (BMI), time interval to surgery (TTS), meniscal and cartilage injury at ACLR, preinjury and postoperative Tegner score, the timing of RTP, ACL graft rupture, and the follow-up period were obtained from medical records. The presence of cartilage injury during ACLR was defined as grade 2 or more according to the Outerbridge classification.
Patients were divided into 2 groups depending on whether they were able to RTP (group A) or not (group B).
Statistical Analysis
Chi-square test (Fisher) was used for categorical variables. Normally distributed variables were compared by the Student t test and nonnormally distributed variables by the Mann-Whitney U test to compare the continuous data between the 2 groups, whereas repeated-measures analysis of variance was used to analyze variables over time. To investigate the associated factors with ΔSNQ (6-12) and ΔSNQ (12-24), a fixed-effect multivariate logistic regression analysis was conducted. A list of explanatory variables for multivariate logistic regression analysis with ΔSNQ as a continuous variable was shown in Table 1.
List of Explanatory Variables for Multivariate Logistic Regression Analysis a

RTP, return to preinjury levels of performance.
A subanalysis was additionally performed comparing patients who were able to RTP at <12 months (early, or group E) versus at ≥12 months (late, or group L).
Statistical tests were considered significant at P < .05.
Intraclass correlation coefficients were assessed by a single orthopaedic surgeon (T.T.) and an experienced radiologist to measure the intraobserver and interobserver reliabilities for the CT and MRI measurements. Measurements were performed 2 separate times, 1 month apart.
The power analysis indicated that a minimum sample size of 1194 patients in group A and 406 patients in group B would be sufficient to detect an estimated difference based on positive versus negative in ΔSNQ (6-12) with an α error of .05 and a power of 0.8.
All statistical analyses were performed using EZR software Version 1.38 (Saitama Medical Center; Jichi Medical University).
Results
The mean SNQ values and ΔSNQs were presented in Table 2. The mean SNQ did not change significantly over time.
Results of SNQ Values and ΔSNQs a

Data are presented as mean ± SD. SNQ, signal-to-noise quotient; ΔSNQ (6-12), amount of change in signal-to-noise quotient value from 6 to 12 months; ΔSNQ (12-24), amount of change in signal-to-noise quotient value from 12 to 24 months.
In 4 ACL graft rupture patients before 24 months, the mean ± SD SNQ value at 6 months (1.69 ± 1.52) was not significantly different from that (1.21 ± 1.94) in patients (n = 111) without ACL graft rupture (P = .63).
There were 83 patients (36 male, 47 female) in group A and 28 (12 male, 16 female) in group B, respectively (Table 3).
Baseline Demographic and Clinical Characteristics a

Data are presented as mean ± SD or n. Bolded P values indicate statistically significant difference between groups (P < .05). ΔSNQ (6-12), amount of change in signal-to-noise quotient value from 6 to 12 months; ΔSNQ (12-24), amount of change in signal-to-noise quotient value from 12 to 24 months; BMI, body mass index; CT, computed tomography; GBA, femoral graft bending angle; LM, lateral meniscus; MM, medial meniscus; PTS; tibial posterior slope; RTP, return to preinjury levels of performance; SNQ, signal-to-noise quotient; TTS, time interval to surgery.
The patients in Group B were not able to RTP.
Changes in Tegner score from preinjury to postoperatively are shown in Table 4.
Changes in Tegner Score From Preinjury to Postoperatively a

Data are presented as number of cases. TS, Tegner score.
There were no significant differences in age, sex, BMI, TTS, Tegner score, the rate of RTP, PTS, the incidence of meniscal and cartilage injury, and GBA between the 2 groups. The mean times of RTP were 10.4 months (range, 6.5-18) in group A. There were no significant differences between the 2 groups in the mean SNQs at 6, 12, and 24 months and ΔSNQs. The multivariate logistic regression analysis showed that RTP was not associated with ΔSNQ (6-12) and ΔSNQ (12-24), whereas higher BMI increased ΔSNQ (6-12) (Tables 5 and 6).
Multivariate Logistic Regression Analyses for Association With ΔSNQ (6-12) a

ΔSNQ (6-12), amount of change in signal-to-noise quotient value from 6 to 12 months after anterior cruciate ligament reconstruction; BMI, body mass index; OR, odds ratio; RTP, return to preinjury levels of performance. Bolded P value indicates statistical significance (P < .05).
Multivariate Logistic Regression Analyses for Association With ΔSNQ (12-24) a
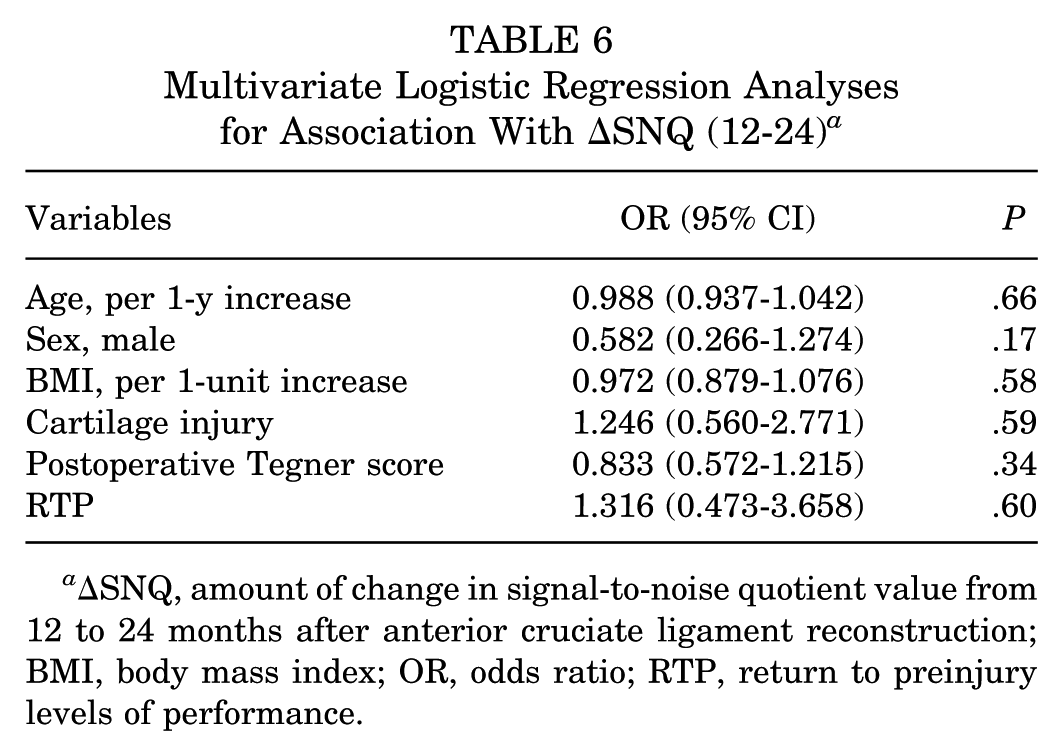
ΔSNQ, amount of change in signal-to-noise quotient value from 12 to 24 months after anterior cruciate ligament reconstruction; BMI, body mass index; OR, odds ratio; RTP, return to preinjury levels of performance.
Subanalysis
There were no differences in ΔSNQs between groups E and L whereas the SNQ value at 12 months was significantly higher in group L (Table 7).
Baseline Demographic and Clinical Characteristics in Groups E and L a

Data are presented as mean ± SD or n. Bolded P values indicate statistically significant difference between groups (P < .05). ΔSNQ (6-12), amount of change in signal-to-noise quotient value from 6 to 12 months; ΔSNQ (12-24), amount of change in signal-to-noise quotient value from 12 to 24 months; BMI, body mass index; CT, computed tomography; GBA, femoral graft bending angle; LM, lateral meniscus; MM, medial meniscus; PTS, tibial posterior slope; RTP, return to preinjury levels of performance; SNQ, signal-to-noise quotient; TTS, time interval to surgery.
The intraobserver and interobserver reliabilities for each parameter are shown in Table 8.
The Intraobserver and Interobserver Reliabilities for Each Parameter a

GBA, femoral graft bending angle; PTS, tibial posterior slope; SNQ, signal-to-noise quotient.
Discussion
The most important findings of this study were that RTP was not associated with ΔSNQs while 74.8% of patients were able to RTP with a mean time of about 10 months.
The mean SNQ values in the current study ranged from 1.16 to 1.42 at 6, 12, and 24 months postoperatively. The rate of graft ligamentization in ACLR varies greatly, ranging from 1 year to 48 months in human studies. 19 Muramatsu et al 16 reported that the SNQ value increased at 1 month, peaked at 4 or 6 months, and then decreased continuously from 12 to 48 months. Yau and Chan 28 used hamstring autograft (88.5%), BPTB graft (8%), quadriceps tendon graft (2.7%), and others for ACL grafts, and they evaluated the distribution of the SNQ of the intact ACL graft below 2 SDs of the mean SNQ of the native ACL (mean SNQ + 2 SDs: 2.1). They found that the percentage of SNQ values <2.1 increased significantly at 4 years postoperatively compared with 3 years. Although SNQ values measured on different systems may not be comparable, the SNQ values in our study were considered lower in the early postoperative period compared with the recent study by Yau and Chan. The use of BPTB autograft may contribute to our lower SNQ values. Whereas hamstring tendon graft and BPTB graft are the 2 most commonly used autografts for ACLR, the ligamentization period in BPTB autograft (6-12 months) was shorter than in hamstring autograft (18-24 months). 7 Another possible explanation for our result might be the relatively low GBA. Acute GBA increases the stress on the graft-tunnel interface during physical activities and negatively affects graft healing. 12 In terms of femoral tunnel creation, Tashiro et al 22 found that GBA was smaller in transtibial technique (70.0°-77.2°) than in outside-in (84.6°-94.3°) and transportal technique (83.0°-83.1°). Our modified transtibial technique could provide a gentler GBA (around 44°), resulting in faster and better graft remodeling with less stress on the ACL graft.
In terms of RTP with achievement of >90% of the limb symmetry index for the single-leg hop test, there were no differences in SNQ values at 6, 12, and 24 months between patients who were able to RTP or not in the current study. Additionally, RTP was not associated with ΔSNQ (6-12) and ΔSNQ (12-24) on multivariate logistic regression analyses. Furthermore, subanalysis comparing patients who were able to RTP at <12 months versus at ≥12 months showed that there were no significant differences in ΔSNQ (6-12) and ΔSNQ (12-24) between the 2 groups. Several studies reported the relationship between SNQ value on MRI and RTP or postoperative activity using MRIs before or at the time of return to sport and sports activities. Zhou et al 30 indicated that SNQ values 9 months after ACLR in patients with return to sport were significantly lower than those without return to sport. Okutan et al 17 reported that the SNQ value 1 year after ACLR using hamstring autograft was correlated with the Marx activity scale. Although RTP may result in the risk factor of ACL graft failure, 4 few previous studies evaluated the effect of RTP on the changes in SNQ values using MRI before and after RTP. While the mean time of RTP was about 10 months, RTP did not affect the changes in the SNQ values in this study.
Age was not associated with ΔSNQ (6-12) (P = .18) and ΔSNQ (12-24) (P = .66) in this study. Age might likely be associated with SNQ value, 28 as younger patients tend to have higher activity levels that might deteriorate the ACL graft during graft remodeling. 20 A previous study reported a similar conclusion, finding no correlation between SNQ value and age. 5 It can be considered that younger patients might be biologically better healers, 11 whereas they should have higher activity levels.
Male sex also was not associated with ΔSNQ (6-12) (P = .54) and ΔSNQ (12-24) (P = .17) in the current study. Sex has been demonstrated to play an important role in knee stability, and the risk of graft rupture is probably explained by sex hormones. 14 High estrogen levels have been associated with mechanical ligament weakness, and women show a higher prevalence of general and local hypermobility. 1 In addition, a recent study indicated that relaxin, which contributes to pubic symphysis widening, could play a role in the development of conditions that owe their pathophysiology to increased ligament and tendon laxity. 2 However, previous studies demonstrated that sex was not associated with ACL graft remodeling.17,26 These results were comparable with those in this study. Sex effect on ACL graft remodeling remains unsettled.
Higher BMI was associated with increased ΔSNQ (6-12) in this study. Higher BMI has generally been considered to increase mechanical loads on cartilage and meniscus. 6 Ye et al 29 also reported that higher BMI was an independent factor correlated with higher SNQ values in specific regions of the ACL graft. They suggested that inappropriate stress caused by high BMI could explain the inferior maturity of the ACL graft.
Limitations
The current study has several limitations. First, the retrospective design of this study presents inherent limitations such as selection biases. Second, there was a lack of validated clinically meaningful difference values for SNQ values and measurement of SNQ at different graft locations. Third, the assessment was performed within a single slice and did not consider the 3-dimensional geometry of the ligament. Fourth, the current status of MR imaging, which utilizes multichannel coils, should directly affect the analysis, and the results reported in the current study may not be repeatable on other MR systems. Fifth, this study evaluated the patients in 2 years. Further long-term studies should be conducted.
Conclusion
RTP with achieving >90% of the limb symmetry index for single-leg hop test around 10 months after ACLR using BPTB autograft was not associated with signal intensity reduction in ACL graft on MRI.
Footnotes
Final revision submitted May 15, 2025; accepted June 9, 2025.
The authors declared that there are no conflicts of interest in the authorship and publication of this contribution. AOSSM checks author disclosures against the Open Payments Database (OPD). AOSSM has not conducted an independent investigation on the OPD and disclaims any liability or responsibility relating thereto.
Ethical approval for this study was obtained from Shimada Hospital (ID No.2021-009).