
Abstract
Background:
Female sports participation is at an all-time high, from amateur to professional levels. There has been recent media and scientific focus on the higher rates of injury to the anterior cruciate ligament and head injuries in female athletes compared with male athletes. A similar association has not been emphasized in the foot and ankle. Hence, this research aims to establish the rate of foot and ankle injury at the professional level in female athletes compared with their male counterparts.
Purpose/Hypothesis:
The purpose of this study was to understand the rate of foot and ankle injuries in professional and semiprofessional athletes. It was hypothesized that female athletes are injured at higher rates compared with their male counterparts.
Study Design:
Systematic review; Level of evidence, 3.
Methods:
A systematic review was conducted using PRISMA (Preferred Reporting Items for Systematic Reviews and Meta-Analyses) guidelines. PubMed, Ovid EMBASE, and Ovid MEDLINE were searched for relevant papers up until October 23, 2023. Papers reporting on rates of foot and ankle injuries in female professional or semiprofessional athletes were included, along with a male comparison group. A total of 2510 papers were screened. A meta-analysis was performed on 4 separate subgroups using common and random-effects models.
Results:
A total of 53 papers met the inclusion criteria, and a meta-analysis of proportions was performed. Of this total, 21 records reported absolute elite athlete numbers and 32 reported athletic exposures. Meta-analyses were performed on these 2 subgroups separately. The literature was found to have a high risk of bias. The rate of injuries to the foot and ankle in female athletes was higher than their male counterparts overall (log odds ratio). Professional female athletes had significantly more injuries compared with their male counterparts using a common-effects model (odds ratio, 1.52 [1.44-1.61]) Chi-square testing demonstrated significant heterogeneity.
Conclusion:
This systematic review and meta-analysis demonstrated that female athletes suffer foot and ankle injuries at professional and semiprofessional competition levels at higher rates than their male counterparts. The literature on this topic is limited to large observational studies with significant risk of bias and heterogeneity. The current research provided an understanding of the significant effects of foot and ankle injury rates, detailing the increased exposures that are present in female semiprofessional and elite sports.
Sports injuries have been a subject of increasing research interest in the past 2 decades. 30 The rise in popularity of female professional sports in recent years has seen a subsequent rise in injuries in female athletes. Female athletes participating in team sports have reported higher rates of injury compared with their male counterparts. 23 This can result in time away from the sport, high medical costs, a reduction in team performance, and chronic physical and mental health issues.29,53,96 Recent meta-analyses indicate that ankle sprains, concussion, and anterior cruciate ligament injuries occur at higher rates in female athletes.24,60,70 There may be anatomic,19,100 hormonal, 71 and biomechanical reasons28,59 for these differences in injury rate.49,80 It is also postulated that there are cultural differences between the sexes that may contribute to this difference, with girls participating in less physical activity than boys during formative years. 92 With specific reference to the foot and ankle, there are attempts to elucidate reasons for differences in injury rate comparing women to men with ankle ligamentous injury 28 and to elucidate anatomical differences in osteology. 63
In recent years, female professional sporting competitions have increased in size, number, and popularity28,69 and have generated an increased media interest for women’s professional sports. 2 This has a flow-on effect for amateur competitions, both junior and adult, resulting in increased numbers of injuries presenting to emergency departments and acute clinics.45,72 The bulk of literature thus far has concentrated on female knee injuries, specifically anterior cruciate injury, 4 as well as head injuries, specifically concussion. 89 Foot and ankle injuries have not been reported on to the same extent 31 and it is difficult to paint a summative picture of sex-specific foot and ankle difference in injury rates from the current literature.31,86 It is even more difficult to find data on foot and ankle injuries in professional female athletes because most of the current available evidence stems from junior, high school, or collegiate athletes.24,51,68 The aim of this research is to examine, based on the current evidence available, the rate of foot and ankle injuries in the professional and semiprofessional settings. Our hypothesis is that female athletes are injured at higher rates than their male counterparts.
Methods
This study focuses on professional and semiprofessional female athletes, because the quality of data collection and both injury surveillance and reporting is more complete than for amateur athletes.8,9 A systematic literature search was performed according to the most recent PRISMA (Preferred Reporting Items for Systematic Reviews and Meta-Analyses) guidelines.5,66,91 Data extraction, synthesis, and meta-analysis were performed according to the guidelines prescribed by the Meta-analysis of Observational Studies in Epidemiology group. 88 The review was prospectively registered with PROSPERO https://www.crd.york.ac.uk/prospero/ (CRD42023475089) on October 22, 2023.
Literature Search Strategy
Electronic databases were searched from inception until October 23, 2023. We searched PubMed, Ovid EMBASE, and Ovid MEDLINE. We searched for the following keywords in the title and/or abstract: “injuries,” “trauma,” “fracture,” “sprain,” “traumatic,” “acute,” “foot,” “ankle,” “toe,” “lower extremity,” “Lisfranc,” “metatarsal,” “tarsal,” “ankle,” “hindfoot,” “heel,” “Achilles,” “sport,” “athlete,” “female,” “women,” “girl,” and “gender.” Exclusion terms included “review” and “case report.” We combined terms using Boolean operators where appropriate. Our comprehensive search strategy with database-specific search terms is detailed in Appendix Table A1.
Inclusion and Exclusion Criteria
Screening criteria were decided upon a priori. The research question was framed in terms of the Population Intervention Comparison Outcomes Study design framework
Population: female athletes competing at a professional, semiprofessional, or collegiate level
Intervention/exposure: a documented injury, resulting from the athletic activity to the foot and/or ankle region
Comparison: male athletes competing in the same, or sex-comparable, sport at the same level, published in the same study
Outcome: rate of injury of female athletes, as compared with their male counterparts
Additional screening criteria: inclusion criteria: full text available, clinical study, injury rates reported, female athletic injuries reported with a male athlete comparison group, English-language study, human study, foot and ankle injuries reported, semiprofessional (eg, collegiate) or professional athletes. Exclusion criteria: pediatric patients, amateur athletes, review article, case report, nonclinical study, non–foot and ankle injuries, combat sports (eg, taekwondo or judo)
Article Screening and Study Appraisal
We employed 2-pass screening. First, all duplicates were removed. Then each article title and/or abstract was screened independently by 2 authors (A.J.T. and N.A.B.) according to the above screening criteria. Of the remaining suitable articles, full text was then screened to determine final suitability. Any disagreements were resolved by the senior author (R.B.). The PRISMA flowchart is depicted in Figure 1 and details the steps taken to arrive at the final included articles. The Cochrane Risk Of Bias in Non-Randomized Studies of Exposures (ROBINS-E) tool 34 was used to assess risk of bias in each of the articles, and the robvis online tool58,74 was used to provide graphical representation of this assessment. These are freely available, validated online tools tailored for population-based epidemiological studies.

PRISMA 2020 (Preferred Reporting Items for Systematic Reviews and Meta-Analyses) flowchart. Adapted from Page MJ, McKenzie JE, Bossuyt PM, et al. The PRISMA 2020 statement: an updated guideline for reporting systematic reviews. BMJ. 2021;372:N71. 66 doi:10.1136/bmj.n71. For more information, visit: http://www.prisma-statement.org/. F&A, foot and ankle.
Definitions
The final papers included in the analysis reported injury rates either as a proportion of total athletes or in terms of athletic exposures (AEs); as defined in previous research.42,43,43 A reportable AE is defined as 1 athlete participating in 1 practice or competition, in which that athlete was exposed to the possibility of athletic injury. A reportable injury was defined as an injury that (1) occurred as the result of participating in a sanctioned practice or competition and (2) that required attention from a trainer or physician.
Data Collection and Statistical Analysis
Data were then collected and recorded on all studies that met the inclusion criteria. Variables collected included the sport, level of competition, numbers of male and female participants or AEs, and numbers of foot and ankle injuries sustained by both male and female athletes. The reported incidence of injury was extracted if reported in the paper. Data were extracted from the main text, tables, or figures. Where appropriate, supplementary online material was used to locate the relevant data if it were not found in the main text.
Injury Reporting
There was heterogeneity in the reporting of injury statistics. Where injury statistics were reported in terms of AEs, we extracted this as a preference, as it was a better representation of injury incidence. However, some papers reported on absolute numbers of athletes. If AE data were not available, then we extracted data on absolute athlete numbers. Any papers that did not report total numbers of athletes (ie, a sample size) were excluded from analysis.
Subgroup Analysis
The studies were then stratified into 4 groups depending on whether they reported absolute number of athletes, or AEs, and the level of competition. When there were multiple sports reported in a paper—for example, in papers reporting on American collegiate sports13,15-18,50,76—we extracted data from only sex-matched sports. For example, we did not extract data on male football (gridiron/American football) since there was no female equivalent.39,46,75,79
The outcome for analysis was injury rate of female athletes as a proportion of total female athletes. This was compared with a control group of male athletes reported in the same study. Data were tabulated using Microsoft Excel; and data analysis, including meta-analysis, was performed using the meta package Version 8.0-1 in R (Version 4.4.1; RStudio). A P value of <.05 was designated as the significance threshold.
Meta-analysis
We performed 4 separate meta-analyses of the extracted data based on the defined subgroups. The reporting metric was the log odds ratio (OR) with athlete injury as a dichotomous outcome variable. A random-effects meta-analysis model, constructed using R, was the primary outcome due to expected exposure heterogenicity. There was heterogenicity in study populations due to participant ages, demographics, and different sports. Heterogeneity between studies was assessed using the T2 (study variance), the I2 (variability), and the maximum-likelihood estimator. 95 The rank correlation test and the regression test, using the standard error of the observed outcomes as predictor, were used to check for funnel plot asymmetry.
Results
Literature Search
A total of 5493 studies were identified from database searches, and a further 27 from other sources (reference lists of included papers). 2983 duplicates were removed, leaving 2510 for an initial screening. 2227 were excluded based on title and abstract screening; 283 papers were included for full-text screening, of which 235 had full text available. After full-text screening, 53 studies (11 from grey literature, Figure 1) were deemed eligible for final inclusion (Figure 1). These studies report on a cumulative 25,687,866 AEs and 14,230 total athletes.
Included Studies and Meta-analysis
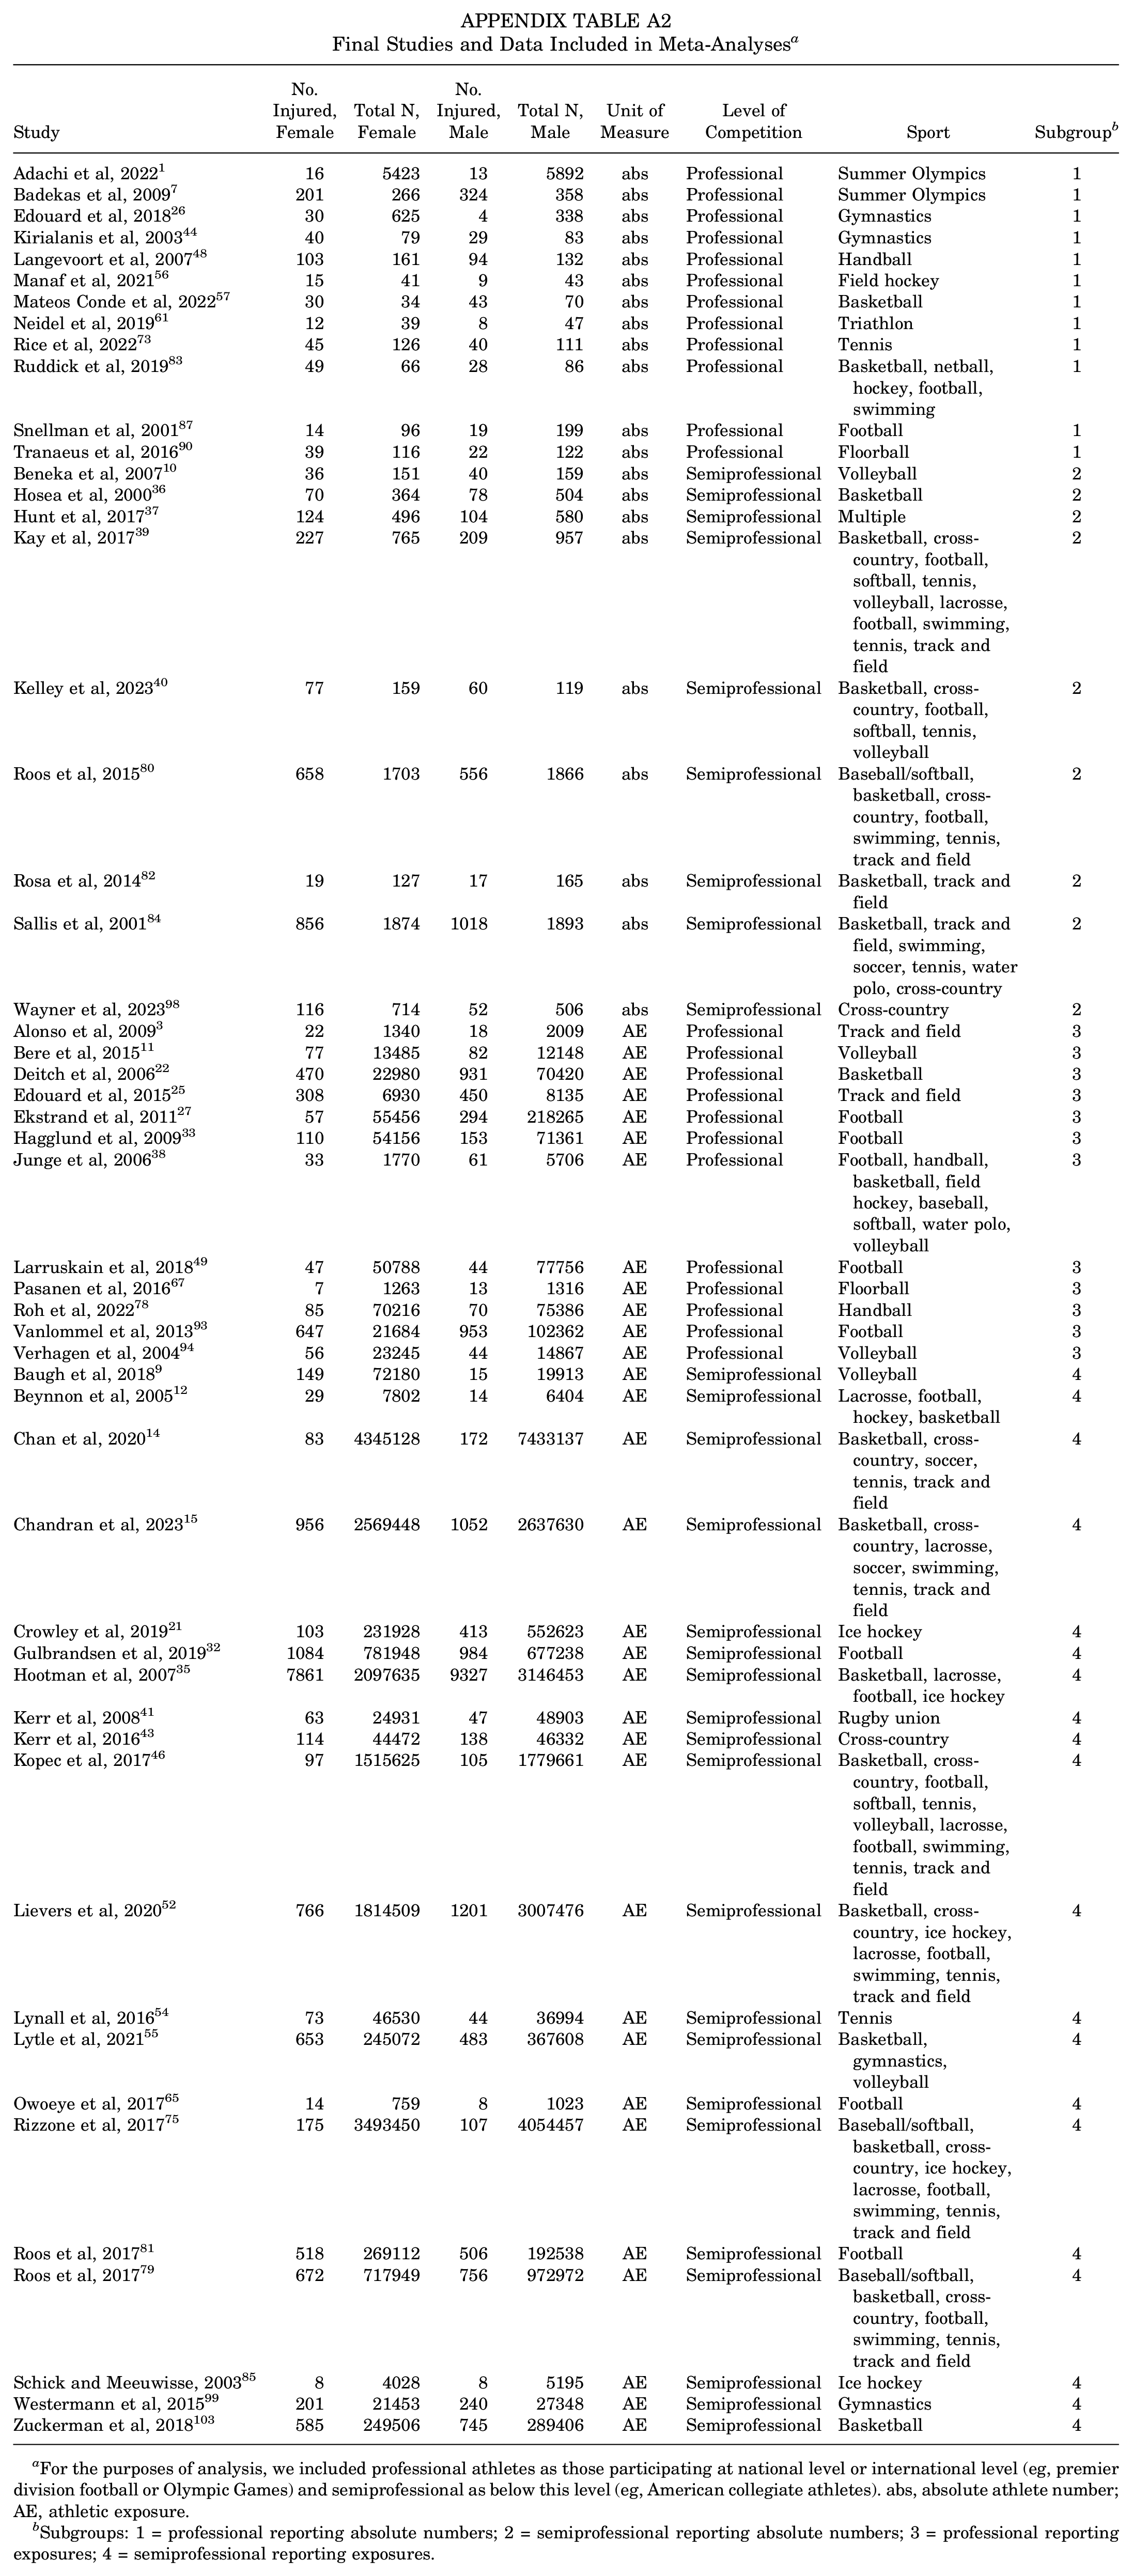
A total of 53 studies were included in the analysis. In total, the 53 studies reported on 25,687,866 AEs (Appendix Table A2). Of these, 21 reported absolute athlete numbers (12 professional level, 9 semiprofessional level) and 32 reported athlete exposures (12 professional level, 20 semiprofessional level). Because the sample sizes (ie, the denominators) and competition levels were different in these subgroups, we performed separate meta-analyses for each. The complete extracted data used to perform analyses and references can be found in Appendix Table A2.
Risk-of-Bias Assessment
Figures 2 and 3 demonstrate the results of the risk-of-bias assessment using the ROBINS-E tool. Three of the included studies (5.7%) demonstrated a “low” risk of bias, 13 studies (24.5%) demonstrated “some concerns,” 33 studies had a “high” risk of bias (62.2%) and 4 studies (7.5%) were rated as having a “very high” risk of bias.

Individual study risk-of-bias assessment as determined by the Risk Of Bias In Non-randomized Studies of Exposures tool and visualized using robvis.

Summary graph demonstrating risk-of-bias assessment.
Figure 4 displays the meta-analysis for our 4 subgroups. We separately analyzed professional and semiprofessional athletes. In addition, we analyzed the studies reporting absolute numbers of athletes and AEs separately, due to the difference in the magnitude of numbers.
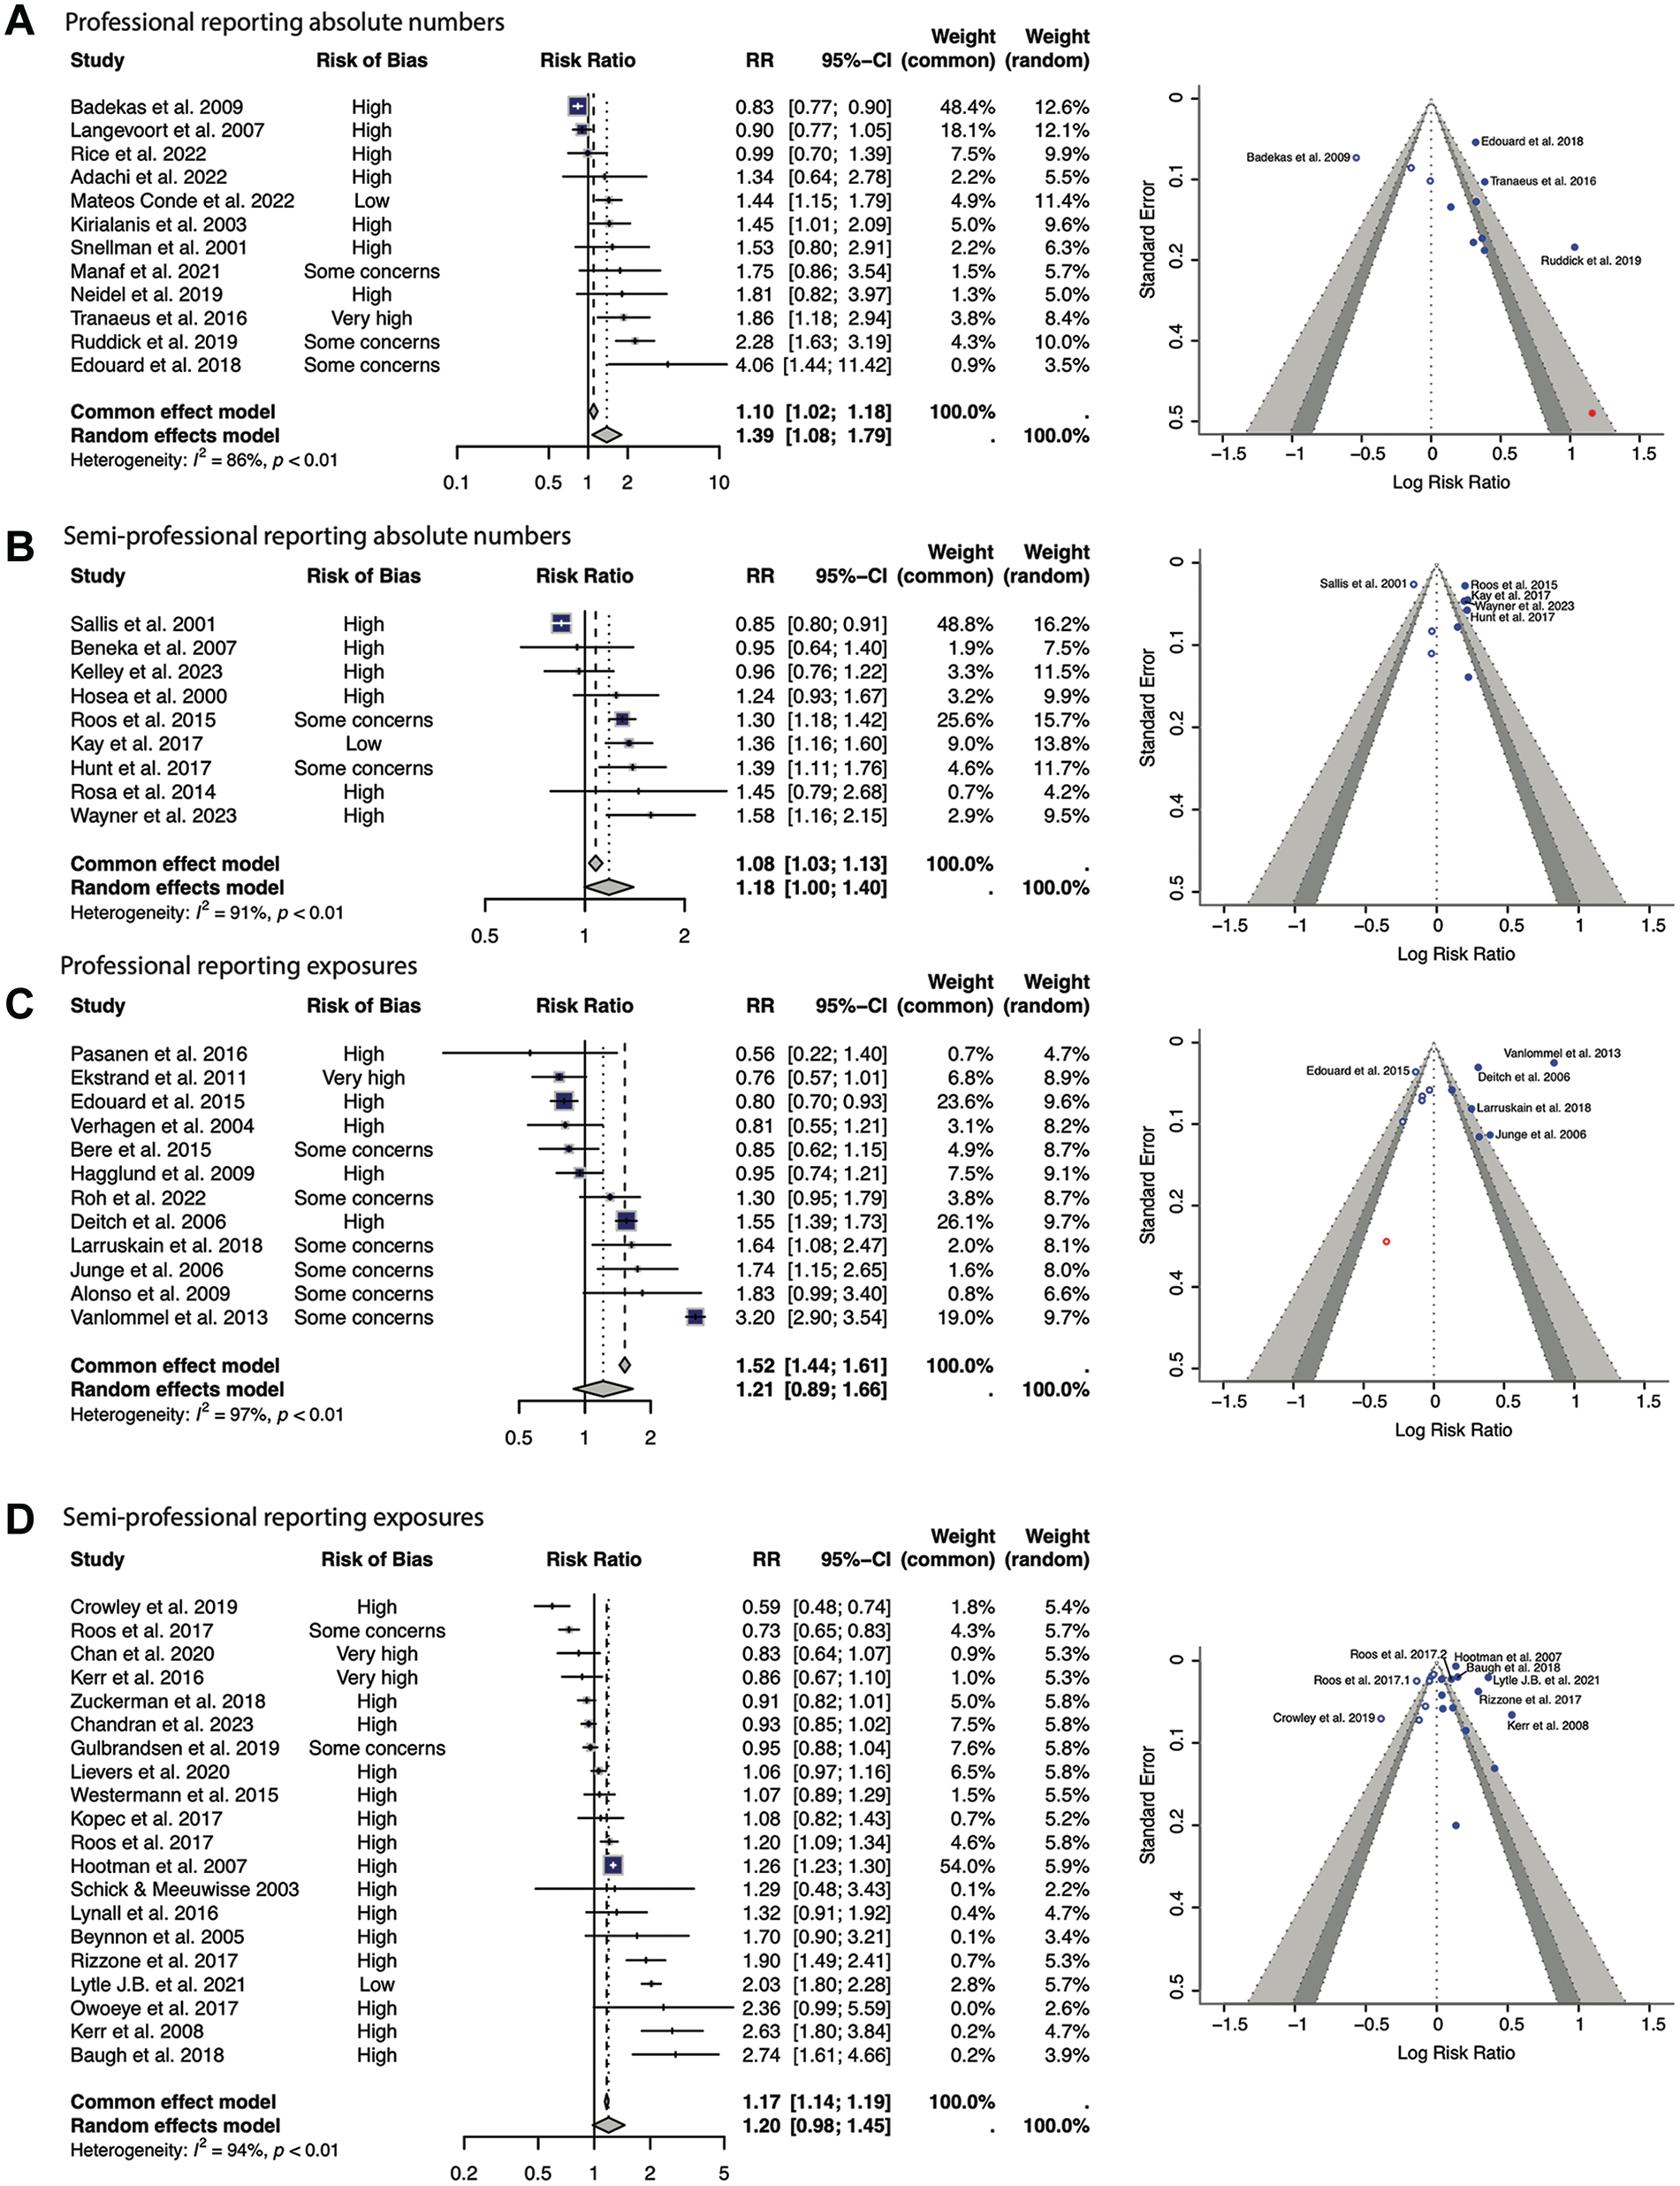
Meta-analysis results. Demonstrated are 4 forest plots with the corresponding funnel plots. Female athletes are represented on the right. (A) studies reporting absolute athlete numbers in professionals, (B) studies reporting absolute athlete numbers in semiprofessionals, (C) studies reporting athletic exposures in professionals, and (D) studies reporting athletic exposures in semiprofessionals. RR, risk ratio.
Studies Reporting Absolute Numbers of Athletes
Professional Athletes
A total of 12 studies were included in the analysis. § There were 14,553 athletes in these studies when pooled, 7072 of whom were female. There was a significantly higher number of injuries in professional female athletes compared with male counterparts in the random-effects models (RR, 1.39; 95% CI, 1.08-1.79, respectively) (Figure 4A). One study had a low risk of bias (Mateos Conde et al), 57 with the remainder scored as having some concerns of bias or high risk of bias (Figure 2). The I2 was 86% (P < .01) representing a significant degree of heterogenicity between study outcomes. The funnel plot demonstrates symmetry, with a wide effects range (Figure 4A).
Semiprofessional Athletes
Nine papers were included in the analysis. ‖ There were 13,102 athletes in these studies when pooled, 6353 of whom were female. There was a significantly higher number of injuries in semiprofessional female athletes compared with male athletes using both common-effects (OR, 1.08; 95% CI, 1.03-1.13) and random-effects models (RR, 1.18; 95% CI, 1.00-1.40) (Figure 4B). One study had a low risk of bias, 39 with the remainder having some concerns or high risk of bias (Figure 2). The I2 was 91% (P < .01) demonstrating heterogenicity between study outcomes. The funnel plot demonstrates asymmetry and a narrow effects range (Figure 4B).
Studies Reporting AEs
Professional Athletes
A total of 12 studies were included in the analysis. ¶ This totaled 983,044 AEs, 323,313 of which were in female athletes. When measuring AEs, professional female athletes had significantly increased injuries compared with their male counterparts using a common-effects model (RR, 1.52; 95% CI, 1.44-1.61) but not in a random-effects model (RR, 1.21; 95% CI, 0.89-1.66) (Figure 4C). All studies had some concern or high risk of bias, with 1 study 27 having a very high risk of bias (Figure 2). The study outcomes were significantly heterogeneous (I2 = 97%; P < .01). The funnel plot demonstrates symmetry and a narrow effects range (Figure 4C).
Semiprofessional Athletes
20 studies were included in the analysis. # This totaled 43,856,776 AEs, 18,553,465 of which were in female athletes. Semiprofessional female athletes had a significantly increased number of injuries per AE compared with their male counterparts using a common-effects model (RR, 1.17; 95% CI, 1.14-1.19), but not using a random-effects model (RR, 1.20; 95% CI, 0.98-1.45) (Figure 4D). All studies had some concerns or high risk of bias, with 2 studies having a very high risk of bias (Figure 2).14,43 The outcomes reported high heterogeneity (I2 = 94%; P < .01). The funnel plot demonstrates symmetry and a wide effects range (Figure 4D).
Discussion
Our meta-analysis of 53 studies totaling 25,687,866 AEs is the largest meta-analysis to our knowledge to examine sex differences in injury rates specific to foot and ankle injuries. Using a common-effects model meta-analysis, there was a significantly higher number of foot and ankle sporting injuries in professional (983,044 AEs: OR, 1.52; 95% CI, 1.44-1.61) and semiprofessional (43,856,776 AEs: OR, 1.17; 95% CI, 1.14-1.19) female athletes when compared with their male counterparts. Due to high risk of bias in many studies, there was a significant degree of heterogenicity between outcomes of included studies.
Most of the focus in the sports literature when comparing male and female injury rates has focused very broadly on injury rates,13,16-18,50,76,99,103 anterior cruciate ligament injuries,20,102 risk factors for injury, 20 and concussion. 85 Our finding of a higher injury risk in female athletes is in contrast to a recent meta-analysis by Zech and colleagues 102 who reported a higher injury rate in male athletes; their review, however, was narrower in scope than our study and notably specifically excluded semiprofessional and American collegiate data, which made up a significant proportion of the included studies in this analysis.
Underlying reasons for the difference in injury rates have been examined. These include anatomic differences. Female feet have wider forefeet, shorter medial longitudinal arch, and shorter metatarsal length compared with male feet. 101 Female foot and ankle osteology studies have demonstrated narrow canals and thinner bony cortices, which may place them at increased risk of stress fractures. 6 Female athletes have a greater range of motion of the ankle, hindfoot, and midfoot while running, which may influence the type and severity of injuries sustained. 77 Hormonal fluctuations may also place women at risk of injury via decreased ligamentous tensile strength, muscle recruitment, and neuromuscular control. 28 Female athletes tend to exhibit increased ligamentous laxity, which when coupled with greater joint range of motion can place the joints in extreme positions, leaving them vulnerable to injury. 47 In addition to these intrinsic reasons, there are extrinsic factors, such as the lack of female-specific footwear for certain sports,62,64,97 which may contribute to this observed difference in injury rates.
There were differences between different meta-analysis models that were used when assessing injuries sustained per AE compared with number of athletes who sustained injuries. When measuring AE, there was a significant difference between using a common-effects model but not using a random-effects model for both professional and semiprofessional athletes. We believe this is due to the breadth of the AE metric.
Professional Versus Semiprofessional Athletes
We were interested in outcomes in different patient populations and so chose to analyze professional and semiprofessional athletes separately. Professional athletes are more likely to be full-time athletes with a team of professional support staff helping them achieve peak performance at the highest level (eg, Olympic Games or professional football). In contrast, the semiprofessional (eg, American collegiate) athlete, while still performing at an extremely high level, has other commitments or employment and will not have the same supports in place around him or her. Our analysis showed that, in both professional and semiprofessional athletes, female athletes experienced higher rates of foot and ankle injuries compared with male athletes. The magnitude of this difference was small: in professional athletes, the log ROR was 0.32, and in semiprofessional athletes, the RR was 0.18. This pattern suggests that the increased risk associated with being female may be a more influential factor than differences in the level of professional support available to athletes at different competition tiers. Importantly, the studies within both subgroups showed high variability, with I2 values exceeding 90%.
Limitations
This is the first systematic literature search and meta-analysis, to our knowledge, to extract injury statistics from varied competition levels and different sports, and the first to report such a large number of AEs. This is only possible when extracting and pooling data from broader epidemiological studies and extracting foot and ankle–specific injuries. However, with such a broad scope of review, it is impossible to avoid heterogeneity in the data extracted. The presence of different sample sizes (absolute athlete numbers, AEs) means that we could not conduct a pooled meta-analysis of the 53 included papers, but had to divide our analyses into subgroups. The risk of bias evident on article review is a limitation of this study and is inherent to the literature, as these are observational studies of an exposure (ie, an injury).
The author group consists of 5 male researchers spanning 2 continents. There is a mix of clinicians and academics. There is a breadth of research disciplines (surgery, biostatistics, and biomechanics), including junior, midcareer, and senior researchers. The focus of this paper was on injury rates between sexes, and as such, a direct sex-based analysis is the primary objective of this research.
Many papers broadly report injury rates; foot and ankle injuries are not the specific focus of these papers, and many papers do not specify which injury was sustained. This could be addressed in future studies by narrowing the scope of the review. Data extraction to identify risk factors that would predispose to foot and ankle injury has been done previously by Collings et al, 20 but this is beyond the scope of this study. The decision to focus on elite athletes may not be broadly applicable to most surgeons’ patient populations, but this is the subject of future research in our group. The decision to focus on elite athletes allows for some consistency in reporting, as they tend to have training and match play hours quantified and thus total AE is often a known quantity, but this is impossible in amateur athletes. Despite this, there is still significant heterogeneity in reporting injury incidence statistics, and this is reflected in our meta-analysis results.
Conclusion
Our systematic literature review and pooled meta-analysis of 25,687,866 AEs demonstrates that across higher competitive levels and a range of sex-comparable sports, there is a higher injury incidence in female athletes compared with their male counterparts. The literature on this topic is limited to large observational studies with significant risk of bias and heterogeneity. With the issue of injury in women’s sports grabbing media attention, no doubt this is an expanding area of research. As further data become available and injury surveillance programs are carried out, more detailed analyses with more homogeneous data will be possible.
Footnotes
Appendix
Final Studies and Data Included in Meta-Analyses a
| Study | No. Injured, Female | Total N, Female | No. Injured, Male | Total N, Male | Unit of Measure | Level of Competition | Sport | Subgroup b |
|---|---|---|---|---|---|---|---|---|
| Adachi et al, 2022 1 | 16 | 5423 | 13 | 5892 | abs | Professional | Summer Olympics | 1 |
| Badekas et al, 2009 7 | 201 | 266 | 324 | 358 | abs | Professional | Summer Olympics | 1 |
| Edouard et al, 2018 26 | 30 | 625 | 4 | 338 | abs | Professional | Gymnastics | 1 |
| Kirialanis et al, 2003 44 | 40 | 79 | 29 | 83 | abs | Professional | Gymnastics | 1 |
| Langevoort et al, 2007 48 | 103 | 161 | 94 | 132 | abs | Professional | Handball | 1 |
| Manaf et al, 2021 56 | 15 | 41 | 9 | 43 | abs | Professional | Field hockey | 1 |
| Mateos Conde et al, 2022 57 | 30 | 34 | 43 | 70 | abs | Professional | Basketball | 1 |
| Neidel et al, 2019 61 | 12 | 39 | 8 | 47 | abs | Professional | Triathlon | 1 |
| Rice et al, 2022 73 | 45 | 126 | 40 | 111 | abs | Professional | Tennis | 1 |
| Ruddick et al, 2019 83 | 49 | 66 | 28 | 86 | abs | Professional | Basketball, netball, hockey, football, swimming | 1 |
| Snellman et al, 2001 87 | 14 | 96 | 19 | 199 | abs | Professional | Football | 1 |
| Tranaeus et al, 2016 90 | 39 | 116 | 22 | 122 | abs | Professional | Floorball | 1 |
| Beneka et al, 2007 10 | 36 | 151 | 40 | 159 | abs | Semiprofessional | Volleyball | 2 |
| Hosea et al, 2000 36 | 70 | 364 | 78 | 504 | abs | Semiprofessional | Basketball | 2 |
| Hunt et al, 2017 37 | 124 | 496 | 104 | 580 | abs | Semiprofessional | Multiple | 2 |
| Kay et al, 2017 39 | 227 | 765 | 209 | 957 | abs | Semiprofessional | Basketball, cross-country, football, softball, tennis, volleyball, lacrosse, football, swimming, tennis, track and field | 2 |
| Kelley et al, 2023 40 | 77 | 159 | 60 | 119 | abs | Semiprofessional | Basketball, cross-country, football, softball, tennis, volleyball | 2 |
| Roos et al, 2015 80 | 658 | 1703 | 556 | 1866 | abs | Semiprofessional | Baseball/softball, basketball, cross-country, football, swimming, tennis, track and field | 2 |
| Rosa et al, 2014 82 | 19 | 127 | 17 | 165 | abs | Semiprofessional | Basketball, track and field | 2 |
| Sallis et al, 2001 84 | 856 | 1874 | 1018 | 1893 | abs | Semiprofessional | Basketball, track and field, swimming, soccer, tennis, water polo, cross-country | 2 |
| Wayner et al, 2023 98 | 116 | 714 | 52 | 506 | abs | Semiprofessional | Cross-country | 2 |
| Alonso et al, 2009 3 | 22 | 1340 | 18 | 2009 | AE | Professional | Track and field | 3 |
| Bere et al, 2015 11 | 77 | 13485 | 82 | 12148 | AE | Professional | Volleyball | 3 |
| Deitch et al, 2006 22 | 470 | 22980 | 931 | 70420 | AE | Professional | Basketball | 3 |
| Edouard et al, 2015 25 | 308 | 6930 | 450 | 8135 | AE | Professional | Track and field | 3 |
| Ekstrand et al, 2011 27 | 57 | 55456 | 294 | 218265 | AE | Professional | Football | 3 |
| Hagglund et al, 2009 33 | 110 | 54156 | 153 | 71361 | AE | Professional | Football | 3 |
| Junge et al, 2006 38 | 33 | 1770 | 61 | 5706 | AE | Professional | Football, handball, basketball, field hockey, baseball, softball, water polo, volleyball | 3 |
| Larruskain et al, 2018 49 | 47 | 50788 | 44 | 77756 | AE | Professional | Football | 3 |
| Pasanen et al, 2016 67 | 7 | 1263 | 13 | 1316 | AE | Professional | Floorball | 3 |
| Roh et al, 2022 78 | 85 | 70216 | 70 | 75386 | AE | Professional | Handball | 3 |
| Vanlommel et al, 2013 93 | 647 | 21684 | 953 | 102362 | AE | Professional | Football | 3 |
| Verhagen et al, 2004 94 | 56 | 23245 | 44 | 14867 | AE | Professional | Volleyball | 3 |
| Baugh et al, 2018 9 | 149 | 72180 | 15 | 19913 | AE | Semiprofessional | Volleyball | 4 |
| Beynnon et al, 2005 12 | 29 | 7802 | 14 | 6404 | AE | Semiprofessional | Lacrosse, football, hockey, basketball | 4 |
| Chan et al, 2020 14 | 83 | 4345128 | 172 | 7433137 | AE | Semiprofessional | Basketball, cross-country, soccer, tennis, track and field | 4 |
| Chandran et al, 2023 15 | 956 | 2569448 | 1052 | 2637630 | AE | Semiprofessional | Basketball, cross-country, lacrosse, soccer, swimming, tennis, track and field | 4 |
| Crowley et al, 2019 21 | 103 | 231928 | 413 | 552623 | AE | Semiprofessional | Ice hockey | 4 |
| Gulbrandsen et al, 2019 32 | 1084 | 781948 | 984 | 677238 | AE | Semiprofessional | Football | 4 |
| Hootman et al, 2007 35 | 7861 | 2097635 | 9327 | 3146453 | AE | Semiprofessional | Basketball, lacrosse, football, ice hockey | 4 |
| Kerr et al, 2008 41 | 63 | 24931 | 47 | 48903 | AE | Semiprofessional | Rugby union | 4 |
| Kerr et al, 2016 43 | 114 | 44472 | 138 | 46332 | AE | Semiprofessional | Cross-country | 4 |
| Kopec et al, 2017 46 | 97 | 1515625 | 105 | 1779661 | AE | Semiprofessional | Basketball, cross-country, football, softball, tennis, volleyball, lacrosse, football, swimming, tennis, track and field | 4 |
| Lievers et al, 2020 52 | 766 | 1814509 | 1201 | 3007476 | AE | Semiprofessional | Basketball, cross-country, ice hockey, lacrosse, football, swimming, tennis, track and field | 4 |
| Lynall et al, 2016 54 | 73 | 46530 | 44 | 36994 | AE | Semiprofessional | Tennis | 4 |
| Lytle et al, 2021 55 | 653 | 245072 | 483 | 367608 | AE | Semiprofessional | Basketball, gymnastics, volleyball | 4 |
| Owoeye et al, 2017 65 | 14 | 759 | 8 | 1023 | AE | Semiprofessional | Football | 4 |
| Rizzone et al, 2017 75 | 175 | 3493450 | 107 | 4054457 | AE | Semiprofessional | Baseball/softball, basketball, cross-country, ice hockey, lacrosse, football, swimming, tennis, track and field | 4 |
| Roos et al, 2017 81 | 518 | 269112 | 506 | 192538 | AE | Semiprofessional | Football | 4 |
| Roos et al, 2017 79 | 672 | 717949 | 756 | 972972 | AE | Semiprofessional | Baseball/softball, basketball, cross-country, football, swimming, tennis, track and field | 4 |
| Schick and Meeuwisse, 2003 85 | 8 | 4028 | 8 | 5195 | AE | Semiprofessional | Ice hockey | 4 |
| Westermann et al, 2015 99 | 201 | 21453 | 240 | 27348 | AE | Semiprofessional | Gymnastics | 4 |
| Zuckerman et al, 2018 103 | 585 | 249506 | 745 | 289406 | AE | Semiprofessional | Basketball | 4 |
For the purposes of analysis, we included professional athletes as those participating at national level or international level (eg, premier division football or Olympic Games) and semiprofessional as below this level (eg, American collegiate athletes). abs, absolute athlete number; AE, athletic exposure.
Subgroups: 1 = professional reporting absolute numbers; 2 = semiprofessional reporting absolute numbers; 3 = professional reporting exposures; 4 = semiprofessional reporting exposures.
Final revision submitted April 14, 2025; accepted May 12, 2025.
The authors declared that there are no conflicts of interest in the authorship and publication of this contribution. AOSSM checks author disclosures against the Open Payments Database (OPD). AOSSM has not conducted an independent investigation on the OPD and disclaims any liability or responsibility relating thereto.