
Abstract
Background:
The mean age of volleyball athletes has increased over the past decade, raising concern for musculoskeletal injuries.
Purpose:
To evaluate epidemiologic trends, diagnoses, and mechanisms of volleyball-related lower extremity injuries within different adult age groups.
Study Design:
Descriptive epidemiologic study.
Methods:
Data on volleyball-associated lower extremity injuries in patients ≥19 years of age was analyzed from the National Electronic Injury Surveillance System between January 1, 2013, and December 31, 2022. Data collection included body location, final diagnosis, mechanism of injury, and disposition. Hospital sample weights were used to calculate national estimates. Patients were divided into either 20 to 39, 40 to 59, or ≥60 age groups. Linear regression was used for annual trend analysis, chi-square for categorical variable analysis, and the Holm P value adjustment method for post hoc analysis.
Results:
A weighted national estimate of 64,979 volleyball-related lower extremity injuries were included for analysis. The mean patient age was 33.3 ± 11.2 years. Across all age groups, the most injured body parts were the ankle (36.0%), knee (32.7%), and lower leg (12.9%). The 20 to 39 age group experienced the greatest incidence of injuries from impact with the floor (national estimate [NE], 17,198; 37.4%). Additionally, this age group experienced the greatest incidence of dislocation (NE, 2379; 5.2%). The 40 to 59 age group had the highest proportion of injuries secondary to nonjumping noncontact movements (NE, 1781; 10.3%). The ≥60 age group had the highest proportion of injuries secondary to noncontact jumping movements (NE, 145; 8.5%).
Conclusion:
Our study demonstrates that older volleyball athletes are at risk for lower extremity injuries, specifically affecting the ankle, knee, and lower leg. Younger adults sustain injuries more frequently from trauma, whereas older adults from noncontact injuries. Societies may consider these findings and provide more age-specific recommendations to decrease the overall incidence and significance of volleyball-related lower extremity injuries.
Approximately 37 million Americans participate in either recreational or competitive volleyball, making it one of the most popular sports nationally. 21 The National Collegiate Athletic Association estimates the mean age of female athletes is 26 years old and male age 29.5 years old. 23 Additionally, national surveys estimate that 61% of volleyball participants are >30 years of age and 30% are >40 years of age. 25 The large proportion of adult athletes increases concerns for musculoskeletal injuries, as advanced age is associated with increased likelihood of injury, severity of injury, and length of injury.8,15
The current literature regarding lower extremity volleyball injuries reports the ankle, knee, and foot as the 3 most commonly injured anatomic locations in pediatric, high school, and collegiate athletes.1,5,18 When evaluating the mechanisms of injury, there are 3 common etiologies: (1) direct trauma from a single event such as a collision or fall; (2) contactless injury occurring from dynamic changes in movement; and (3) overuse injuries, stemming from repetitive exacerbation without adequate recovery, causing chronic injury.3,4,10 Moreover, previous studies evaluating volleyball-related lower extremity injuries in collegiate athletes have demonstrated that direct trauma is the greatest contributing mechanism of injury in all age demographics, most commonly occurring when the participant lands from a spike/block and comes into contact with another player’s foot. 1
Despite adult athletes comprising a large proportion of participants in volleyball, there is a gap in the literature regarding the incidence of volleyball-related injuries in different adult age groups. Therefore, the purpose of this study is to evaluate the epidemiologic trends, prevalence, and mechanisms of lower extremity injuries in different adult populations ≥19 years of age. We hypothesize that older age groups will have increases in both acute and chronic injuries of the lower extremities compared with younger age groups.
Methods
Data were collected via the National Electronic Injury Surveillance System (NEISS) database from the Consumer Product Safety Commission. The NEISS database generates estimates for over 5000 emergency departments nationwide based on 100 hospitals that offer 24-hour services and ≥6 admitting beds. From the database, inquiries of volleyball-related injuries (product code 1266: volleyball [activity, apparel, or equipment]) involving the upper leg (product code 81), knee (product code 35), lower leg (product code 36), ankle (product code 37), foot (product code 83), and toes (product code 93) were built. Each data point was given a statistical sample weight based on the capacity of that respective hospital, which was used to calculate an accurate national estimate to represent national trends. Emergency department visits for patients between the ages of 19 and 79 years from January 1, 2013, to December 31, 2022, were included.
The data set provided variables including date of presentation, age, sex, race, body part, final diagnosis, and a narrative written by a health care provider. These narratives were reviewed by the first 2 authors- (P.M.L. an E.M.S.) to identify the mechanism of injury and ensure the injury occurred from a volleyball-related incident. If there were disagreements on interpretation of narratives, the senior author (D.T.) was consulted. Age was further subcategorized into 20 to 39, 40 to 59, and ≥60 years as physiologic differences are observed between each 20-year period. Mechanisms of injury were categorized as impact with player, impact on floor, jumping injuries (ie, movement preparing to jump), nonjumping movement (ie, sudden acceleration injury), collision with equipment, or other. If narratives provided insufficient detail or the exact mechanism was unclear, they were classified as “not specified” (eg, “injured while playing volleyball at the park”). Narratives were further stratified by whether injuries occurred from court volleyball or beach volleyball.
Exclusion Criteria
Narratives describing non–volleyball-related injuries were excluded. Secondary injuries associated with another primary mechanism (eg, initial injury during football, exacerbated with volleyball) were excluded.
Statistical Analysis
Statistical analyses were performed using RStudio Software 2023.06.0+421 (Posit). National Estimates (NEs) were calculated by multiplying the associated statistical weight of the reporting hospital by each queried raw data point. Trends in NE for overall injuries, injury diagnoses, and mechanisms of injury were assessed using linear regression. Similar analyses were conducted to evaluate trends in age groups, sex, and the year 2020 to account for the effects of the pandemic. Chi-square analyses were used to analyze categorical variables. The Holm P value adjustment method was used in post hoc analysis. Statistical significance was set at P < .05.
Results
General Results
A total of 1628 (NE, 75,012) volleyball-related lower extremity injuries between January 1, 2013, and December 31, 2022, were included within the data set. After applying inclusion and exclusion criteria, 1502 (NE, 64,979; 92.3%) injuries were included for analysis. The mean patient age was 33.3 ± 11.2 years of age. There were 843 (NE, 35,132; 54.1%) male patients and 659 (NE, 9847; 45.9%) female patients. In total, 1465 (NE, 63,545; 97.8%) were treated and discharged, 25 (NE, 1022; 1.6%) were admitted, 9 (NE, 313; <0.1%) left without being seen, and 1 (NE, 19; <0.1%) was transferred to another facility. In regard to ethnicity, there were 719 (NE, 36,178; 55.7%) patients whose ethnicity was not specified, 566 (NE, 20,536; 31.6%) were Caucasian, 90 (NE, 3357; 5.2%) were African American, and 61 (NE, 1862; 2.9%) were Asian. Figure 1 represents the ethnic distribution of volleyball-related lower extremity injuries.

Ethnic distribution of volleyball-related lower extremity injuries. AA, African American; NA, Native American; NH/PI, Native Hawaiian/Pacific Islander.
The most commonly injured lower extremity body region was the ankle (n = 582; NE, 23,386; 36.0%). The second most injured lower extremity body region was the knee (n = 471; NE, 21,218; 32.7%). The third most injured lower extremity body region was the lower leg (n = 175; NE, 8367; 12.9%) lower legs. Table 1 represents the distribution of lower extremity injury locations within all patients.
Volleyball Lower Extremity Body Part Injuries Among All Age Groups

Percentages are calculated from the national estimates divided by the overall total national estimate injury.
The most common identified mechanisms of injury were impact with the floor (n = 510; NE, 22,757; 35.0%), impact from another player (n = 101; NE, 4421; 6.8%), nonjumping movements (n = 86; NE, 4289; 6.6%), and jumping movements (n = 48; NE, 2176; 3.3%). There were 711 (NE, 29,617; 45.6%) injuries in which the mechanism was not specified. Table 2 represents the distribution of most common mechanisms of injury. The most common diagnosis was sprains/strains (n = 911; NE, 39,573; 60.9%), “other” diagnoses, which included hematoma, avulsion, puncture, burns, and nerve damage (n = 254; NE, 10,774; 16.6%), fractures (n = 167; NE, 7111; 10.9%), contusions/abrasions (n = 67; NE, 3160; 4.9%), and dislocations (n = 66; NE, 3055; 4.7%). Table 3 represents the distribution of diagnoses within all patients.
Distribution of Mechanisms of Injury for Lower Extremity Volleyball Injuries

Percentages are calculated by dividing the specific MOI injury national estimate number with the total national estimate number.
Most Common Diagnoses of Volleyball-Related Lower Extremity Injuries

Most Common Diagnoses of Top 3 Body Regions Injured
Of all ankle injuries, diagnoses included 461 (NE, 18,686; 79.9%) sprains/strains, 60 (NE, 2439; 10.4%) fractures, 39 (NE, 1273; 5.4%) other/not stated, and 17 (NE, 840; 3.6%) dislocations. Of all knee injuries, diagnoses included 244 (NE, 11,198; 52.8%) sprains/strains, 146 (NE, 6280; 29.6%) other/not stated, 40 (NE, 1896; 8.8%) dislocations, and 25 (NE, 1287; 6.1%) contusions/abrasions. Of all lower leg injuries, diagnoses included 110 (NE, 5232; 62.5%) sprains/strains, 29 (NE, 1370; 7.1%) fractures, 16 (NE, 854; 10.2%) other/not stated, and 12 (NE, 597; 7.1%) contusions/abrasions.
Most Common Mechanisms of Injury of Top 3 Body Regions Injured
The most common mechanisms of ankle injury were impact with the floor (n = 254; NE, 10,674; 45.7%), impact with another player (n = 46; NE, 2030; 8.7%), and jumping movements (n = 5; NE, 333; 1.4%). The most common mechanisms of knee injury were impact with the floor (n = 138; NE, 6630; 31.2%), nonjumping movements (n = 39; NE, 1842; 8.7%), impact with another player (n = 22; NE, 1049, 4.9%), and jumping movements (n = 22; NE, 926; 4.4%). The most common mechanisms of lower leg injury were impact with the floor (n = 35; NE, 1850; 22.1%), nonjumping movements (n = 34; NE, 1595; 19.1%), and jumping movements (n = 21; NE, 970; 11.6%).
Age Group Analysis
There were 1106 (NE, 45,938; 70.7%) injuries in the 20 to 39 age group, 358 (NE, 17,332, 26.7%) in the 40 to 59 age group, and 38 (NE, 1709; 2.6%) in the 60+ age group. The proportion of injuries secondary to impact with the floor was highest in the 20 to 39 age group (n = 397; NE, 17,198; 37.4%) (Table 4). The 40 to 59 age group had the highest proportion of injuries secondary to other nonjumping movements (n = 30; NE, 1781; 10.3%). The 60+ age group had the highest proportion of injuries secondary to jumping movements (n = 3; NE, 145; 8.5%). Injury mechanism profiles between age groups were significantly different (P < .01).
National Estimates and Percentage Distribution of Mechanisms of Injury Within Each Respective Age Group a
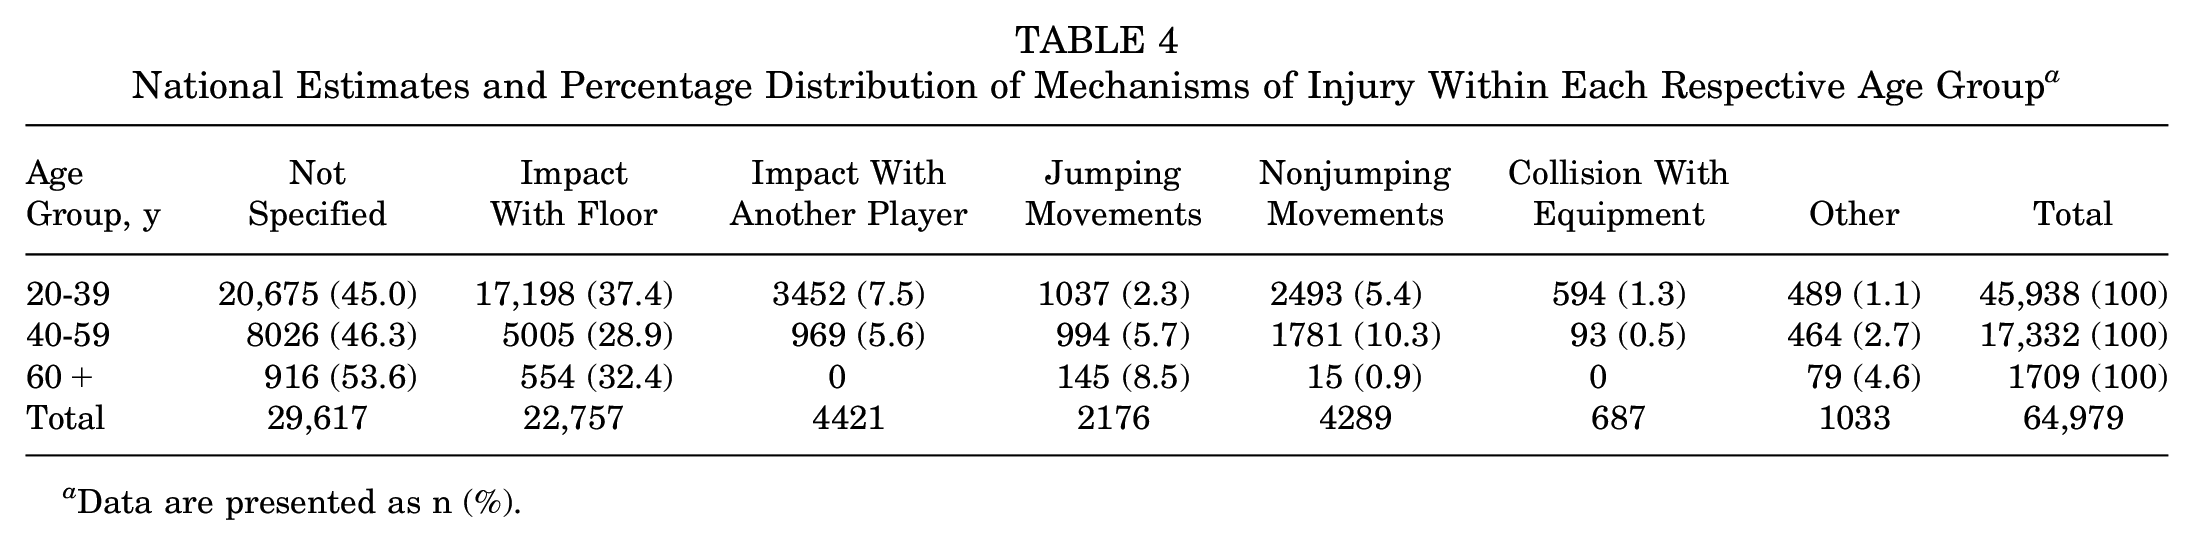
Data are presented as n (%).
Regarding diagnoses (Table 5), the 20 to 39 age group had the greatest proportion of sprains/strains (NE, 28,128; 61.2%), whereas the 60+ age group had the greatest proportion of fractures (NE, 273; 16.0%) and lacerations (NE, 79; 4.6%). Diagnoses between age groups were significantly different (P < .01).
National Estimates and Percentage Distribution of Final Diagnosis Within Each Respective Age Group a

Data are presented as n (%).
Beach Volleyball Trends
There was a total of 106 (NE, 5111) injuries occurring while playing beach volleyball. The mean age was 35.0 ± 11.9 years, with 64 (NE, 3096; 60.6%) male patients and 42 (NE, 2015; 39.4%) female patients. The most commonly injured lower extremity locations were knees (n = 32; NE, 1419; 28.0%), ankles (n = 24; NE, 1284; 25.0%), and feet (n = 23; 1058; 21.0%). The most common mechanisms of injury were not specified (n = 54; NE, 2669; 52.0%), impacts with the floor (n = 30; NE, 1496; 29.0%), impacts with another player (n = 8; NE, 248; 5.0%), and nonjumping movements (n = 7; NE, 361; 7.0%). The most common final diagnoses were strains/sprains (n = 51; NE, 2688; 53%), fractures (n = 16; 791; 15.0%), and dislocations (n = 9; NE, 412; 8.0%).
Discussion
The major findings in our study demonstrates that ankles, knees, and lower legs were the most injured body locations throughout all adult age groups, which is consistent with trends observed in high school and collegiate athletes.1,5,18 However, the distribution of diagnoses differ, as the 20-39 age group had the greatest rates of sprains/strains (61.2%), whereas the 60+ age group had the greatest rate of fractures (16.0%). Similarly, mechanism of injury varied amongst age groups, as the proportion of injuries secondary to impact with the floor was highest in the 20-39 age group (37.4%), whereas the 40-59 age group had the highest proportion of injuries secondary to other non-jumping movements (10.3%) and the 60+ age group had the highest proportion of injuries secondary to jumping movements (8.5%).
Fractures were prominant in the 60+ age group (16.0%). Assessing the most common mechanism of injury of patients with a fracture diagnosis, 70.7% were secondary to impact with the floor. Moreover, there was an inverse relationship between age and rates of strains/sprains, comprising 61.2% of the 20-39 age group injuries, 60.4% of the 40 to 59 age group injuries, and 57.6% of the ≥60 age group injuries. There is extensive literature supporting the negative effect aging has on bone density, coordination, balance, and fine motor skills.3,11,19 Biokinetic evaluations have demonstrated that older individuals tend to lose motor control and joint flexibility, which are important compensatory strategies when coordinating movements/countermovements to maintain a center of mass. 13 Thus, older patients may be at greater risk of acute fractures and sprains/strains. A systematic review and meta-analysis by Bellows and Wong 3 evaluated 8 analyses and reported that ankle braces may reduce the incidence and relative risk of sustaining sprains and that therefore older adults should utilize protective equipment such as braces when engaging in volleyball. 3
Additionally, there was an association between advanced age and injury secondary to jumping movements (P < .01), responsible for 2.3% of injuries in the 20 to 39 age group, 5.7% of injuries in the 40 to 59 age group, and 8.5% of injuries in the 60+ age group. Similar to the previous discussion of bone density, literature has shown that advanced age leads to accelerated ligament degeneration due to loss of collagenous connective tissue, as well as decreased synthesis of proteins, amino acids, and supportive factors such as vitamin D.1,19 Although the current study does not specify exact diagnosis of jumping movement injuries, epidemiologic studies have further supported the high incidence of soft tissue injuries such as Achilles tendon, quadriceps tendon, and patellar tendon ruptures, as well as meniscal tears in older athletes.12,16 There is strong evidence that exercise-based prevention programs incorporating strength exercises for major lower limb muscles such as the quadriceps and gastrocnemius are effective in reducing the incidence of soft tissue knee injuries, specifically anterior cruciate ligament injuries. 2 Moreover, the USA Volleyball organization recommends all athletes engage in quadriceps strength training, which not only better supports knee function but also may decrease the incidence of both acute and overuse injuries. 6
This study demonstrated a bimodal distribution of lower extremity dislocation injuries, more commonly affecting the 20 to 39 and ≥60 age groups. Additionally, the mechanism of injury for dislocation injuries was consistent between age groups, with the most common mechanism of injury being impact with the floor. An epidemiologic study by Onor et al 17 assessed the incidence of ankle injuries among different demographics and reported that sports requiring repetitive, high-impact jumping such as volleyball and basketball were significantly associated with an increased risk of dislocation injuries. Moreover, ankle dislocations often present with concomitant fracture, as significant load bearing on an inappropriately planted foot may propagate to the ankle and the syndesmosis, causing a high-energy ankle fracture-dislocation. 9 This can be attributed to the closed-chain kinetic design, in which the distal segment of the leg is fixed onto a surface, often the floor, which inhibits free movement of the lower leg and allows movement of one joint to simultaneously influence movement at other joints. 20 Additionally, there has been growing evidence supporting the utility of closed-chain kinetics in the rehabilitation process to stimulate sports movement patterns. 7
Currently, recommendations to prevent volleyball-related injuries include adequate warmups with dynamic stretching, hydration, and utilizing protective equipment such as ankle braces and shoes with good arch support. 24 Although all age groups should practice these recommendations, the findings from this study encourage recommendations specific to various adult age groups to decrease the incidence of volleyball-related lower extremity injuries.
Limitations
This study has several limitations. First, the NEISS database is an accumulation of emergency department triage summaries and is limited by the extent of detail provided. The mechanism of injury for a large proportion of volleyball-related lower extremity injuries (45.6%) was left as not specified due to insufficient detail; this may have created bias during interpretation of results. However, the proportions of unspecified injuries in this study are consistent with many other previously published NEISS studies (29.0%-45.3%).14,22 Moreover, inclusion of these data points provides a more accurate representation of injury profiles and trends. The NEISS database also contains a relatively small sample size of 100 hospitals across the United States, so the true incidence of volleyball-related lower extremity injuries may not be accurately represented. However, unlike other sports (eg, surfing, skiing, hockey), volleyball participation is not limited by geographic location; thus, these are likely the best representative sample. Last, the NEISS database only includes visits to emergency departments, which predisposes to higher acuity patients. This may allow for discrepancies in overall injury epidemiology, as patients presenting to urgent care facilities or primary care physicians may have different injury profiles. Furthermore, MRI is not routinely obtained during emergency department workup of acute musculoskeletal injuries. Thus, the proportion of acute ligamentous injuries may be underrepresented. Nevertheless, the national estimates from the NEISS database are representative of statistical samples.
Conclusion
Our study demonstrates that older volleyball athletes are at risk for lower extremity injuries, specifically affecting the ankle, knee, and lower leg. Younger adults sustain injuries more frequently from trauma, whereas older adults from noncontact injuries. Societies may consider these findings and provide more age-specific recommendations to decrease the overall incidence and significance of volleyball-related lower extremity injuries.
Footnotes
Final revision submitted March 30, 2025; accepted April 14, 2025.
One or more of the authors has declared the following potential conflict of interest or source of funding: J.Y. has received education payments from ImpactOrtho, Stryker, and Evolution Surgical. D.T. has received education payments from Arthrex, Gotham Surgical Solutions & Devices, Peerless Surgical, and Smith & Nephew. AOSSM checks author disclosures against the Open Payments Database (OPD). AOSSM has not conducted an independent investigation on the OPD and disclaims any liability or responsibility relating thereto.
Ethical approval was not sought for the present study.