
Abstract
Background:
Bone marrow stimulation (BMS) is the most commonly performed surgery for osteochondral lesion of the talus (OLT), but there is a risk of poor outcome when cysts recur. The indications of BMS in the presence of cystic OLT remain controversial.
Purpose:
To investigate whether a new “jumping dot (JD) sign,” manifesting as speckle-like areas of elevated signals surrounding the subchondral bone cyst (SBC) on preoperative magnetic resonance imaging (MRI) against the background of bone marrow edema (BME), could be a predictor of clinical outcome and recurrence of SBCs following BMS and to further propose a more precise indication regarding BMS surgery for cystic OLT.
Study Design:
Cohort study; Level of evidence, 3.
Methods:
Patients with cystic OLTs (<150 mm2) who received BMS between November 2016 and January 2021 were retrospectively studied. Visual analog scale for pain and American Orthopaedic Foot & Ankle Society (AOFAS) scores were assessed preoperatively and at follow-up. The normal bone marrow, BME, and SBCs (including size) were quantified, and the JD sign was evaluated on the preoperative MRI. Notably, the maximal vertical diameter of the cyst was rigorously defined as the greatest distance measured from the superior to the inferior margins of the cyst in this study. The MOCART (magnetic resonance observation of cartilage repair tissue) score and the cyst recurrence were evaluated, and multivariate analysis was performed to evaluate the association of the JD sign with outcomes at the final follow-up.
Results:
A total of 117 patients were divided into the JD sign group (n = 41) and no JD sign group (n = 76), and no significant difference was found for the follow-up duration (48.04 ± 14.78 months vs 48.46 ± 15.38 months; P = .89). Overall, the patients had significantly improved AOFAS scores (68.69 ± 7.46 vs 86.40 ± 10.75; P = .009) and lessened postoperative cysts (117/117 vs 43/117; P = .000). However, both uni- and multivariate analysis revealed that the JD sign was negatively associated with clinical outcomes following BMS (P < .05). Additionally, the JD sign group showed significantly higher cyst recurrence rate (75.60% vs 15.78%; P < .001) and lower MOCART score (73.04 ± 11.28 vs 80.59 ± 19.07; P = .008). When the maximal vertical diameter of the cyst was >5.4 mm, the JD sign showed excellent effectiveness in predicting the postoperative cyst recurrence (sensitivity, 81.4%; specificity, 68.9%; positive predictive value, 61.34%; and negative predictive value, 86.44%).
Conclusion:
The JD sign might be significantly associated with inferior clinical outcomes and higher SBC recurrence following BMS for cystic OLT. For those patients with the maximal vertical diameter of the cyst >5.4 mm and with JD signs, BMS may not be an appropriate option.
Keywords
Osteochondral lesions of the talus (OLTs) occur in up to 65% of ankle sprains or fractures, and its treatment remains a difficult enigma due to its histologic structure and susceptibility to injury from shear forces. 12 Bone marrow stimulation (BMS) is the most commonly performed surgery for OLTs <100 to 150 mm2. However, 10% to 35% of patients with OLT still experience pain and have limited improvement after BMS. 18 To address this issue, a better understanding of prognostic factors is imperative.
OLTs with subchondral bone cysts (SBCs), indicating a number of histologic abnormalities including trabeculae damage, bone marrow fibrosis, and necrosis, 6 account for 29% to 46% of chronic OLTs. 16 The debridement followed by BMS is expected to create fibrocartilage to replace the cystic OLTs. However, it was reported that about 35% of patients with cystic OLT suffered from cyst recurrence with limited symptom relief during a minimum follow-up of 2 years. 4 In the current clinical dilemma, it was considered that patients with cyst recurrence after BMS may have some common characteristics. Lesion depth has been noted to correlate with the prognosis, but the ideal depth for BMS of an OLT remains controversial. The cutoffs of both 5 mm and 7.8 mm were reported.2,8 These varying results might be attributable to the heterogeneity of histologic structure around OLT. Combining lesion size with subchondral bone characteristics should be a promising strategy to develop more precise surgical indications, but there are few reports. In addition, there is a paucity of studies including objective imaging evaluation to assess prognosis of BMS, 9 including cyst recurrence and cartilage repair. In the preoperative magnetic resonance imaging (MRI) of some patients with postoperative cyst recurrence, we initially observed a visible area of bone abnormality (≥1 speckle-like area of elevated signals higher than the surrounding bone marrow edema [BME]) around the cyst on the proton density (PD)–weighted image. We define this sign as the “jumping dot” sign (JD sign) based on its morphological characteristics on preoperative MRI. Depending on its location and imaging characteristics, this sign may be related to the metabolism of cystic lesions6,13 and thus may have the value of predicting efficacy and clinical prognosis, which has not been systematically studied.
The purpose of this study was to investigate the association of the JD sign with the midterm prognosis and recurrence of SBCs following BMS, while also examining the predictive effect of the combination of JD sign and the maximal vertical diameter of the cyst. The hypothesis was that the patients with JD sign had inferior postoperative outcomes, worse cartilage regeneration, and higher cyst recurrence after BMS compared with the no JD sign group. The combination of JD sign and the maximal vertical diameter of the cyst has excellent predictive effect on cyst recurrence. These results may suggest a new imaging sign for predicting the prognosis of BMS, thus proposing a more precise indication for BMS surgery for cystic OLT.
Methods
Patient Selection
Consecutive patients with a symptomatic cystic OLT who received arthroscopic BMS by 2 authors (D.J., C.J.) between November 2016 and January 2021 were enrolled in this retrospective study. BMS is indicated for osteochondral lesions of the talus that have been refractory to ≥3 to 6 months of nonoperative treatment. The inclusion criteria were as follows: (1) age between 18 and 60, (2) OLT size (length and width) <15 mm seen on MRI in this study, (3) and received BMS after the failure of conservative treatment. Exclusion criteria were as follows: (1) preoperative ankle arthritis with Kellgren-Lawrence grade 3 and 4; (2) a history of fractures or surgeries in the lower extremity; (3) coexisting medial and lateral OLTs, or coexisting talar and tibial lesions; (4) active rheumatological disease; (5) and other neuromuscular diseases in the lower extremity. Ethical approval of this study was granted by the ethical committee of Peking University Third Hospital.
Operative Technique and Postoperative Rehabilitation
Under spinal lumbar anesthesia, patients were placed in a supine position with the ipsilateral hip elevated approximately 30° using a pillow. A lower limb tourniquet was utilized with a pressure of 300 mmHg. After the anteromedial and anterolateral portals were created, patients received diagnostic arthroscopy utilizing a 2.9-mm 30° arthroscope instrument (Smith & Nephew). With the assistance of arthroscopy, OLTs, synovial hyperplasia, loose bodies, and osteophytes were confirmed and assessed. The Outerbridge classification system was applied to evaluate the severity of OLTs in this study. 17 For the patients with grade 1, grade 2, or grade 3 lesions, the cartilage lesions were debrided with a mechanical shaver (Smith & Nephew). For the patients with grade 4 lesions, debridement was followed by promoting a revascularization of the lesions with microfracture at the subchondral bone. All the enrolled patients were grade 4 lesions in this study. After confirming the location and size of the cystic lesion, unstable cartilage and abnormal underlying subchondral bone were removed by a curette; then an arthroscopic shaver (Smith & Nephew) and an arthroscopic file were used to fresh the cyst wall. Following that, a microfracture awl (Smith & Nephew) was used to perforate the bone bed. Spacing and depth of microfracture for the OLTs were 3 to 4 mm. Additionally, patients with ankle instability underwent modified open Broström surgery, which repaired the lateral ankle ligament with a suture anchor with reinforcement of the inferior extensor retinaculum. Continuous passive motion was initiated after 3 days of surgery for patients with single OLTs and was initiated after 2 weeks of surgery for patients who concurrently underwent modified Broström surgery. Partial weightbearing was started at 4 weeks after surgery, and the complete weightbearing began at week 6 with an ankle walking brace. Then, muscle strength and balance exercises were performed, and the patients returned to activities according to their tolerance at weeks 8 to 12.
Imaging Assessment
In this study, the Signa HDxt 3.0-T MRI system (GE Healthcare) equipped with an 8-channel ankle joint surface coil was utilized. The MRI scan protocols used in this study was shown as follows: coronal planes: section thickness, 2.5 mm; repetition time, 2780 ms; and echo time, 38 ms. The sagittal planes: section thickness, 2.5 mm; repetition time, 2120 ms; and echo time, 38 ms. The axial planes: section thickness, 2.5 mm; repetition time, 2600 ms; and echo time,36 ms. The field of view was 16 × 16 cm. PD-weighted imaging in the sagittal and coronal planes was employed for the purpose of conducting the necessary measurements within the picture archiving and communication system (PACS).
The presence of a JD sign was documented using the preoperative images. This study defined the JD sign as a visible area of bone abnormality around the cysts on the PD-weighted image, manifesting as ≥1 speckle-like area of elevated signals higher than the surrounding BME (Figures 1 -3). After training, all image cases were evaluated by a board-certified orthopedic surgeon (H.X.) and a musculoskeletal radiologist (Y.Z.) independently, both blinded to the treatment of enrolled patients. Both observers evaluated the OLT twice on every patient, with an interval of 2 weeks between measurements, to evaluate intraobserver reliability.

The JD sign around the cyst with corresponding schematic diagrams. (A) The JD sign was found around the cyst on the coronal MRI. r1, coronal length of cyst; d, the maximum vertical diameter of the cyst; D, depth of the OLT (cyst +JD sign). (B) Sagittal MRI of a single patient. r2, sagittal length of cyst; d, maximum vertical diameter of the cyst; D, depth of the OLT (cyst +JD sign). (C, D), The schematic diagram of images A and B, respectively. BME, bone marrow edema. JD sign, jumping dot sign; MRI, magnetic resonance imaging; OLT, osteochondral lesion of the talus. R1, coronal length of the OLT (cyst + JD sign); R2, sagittal length of the OLT (cyst + JD sign).
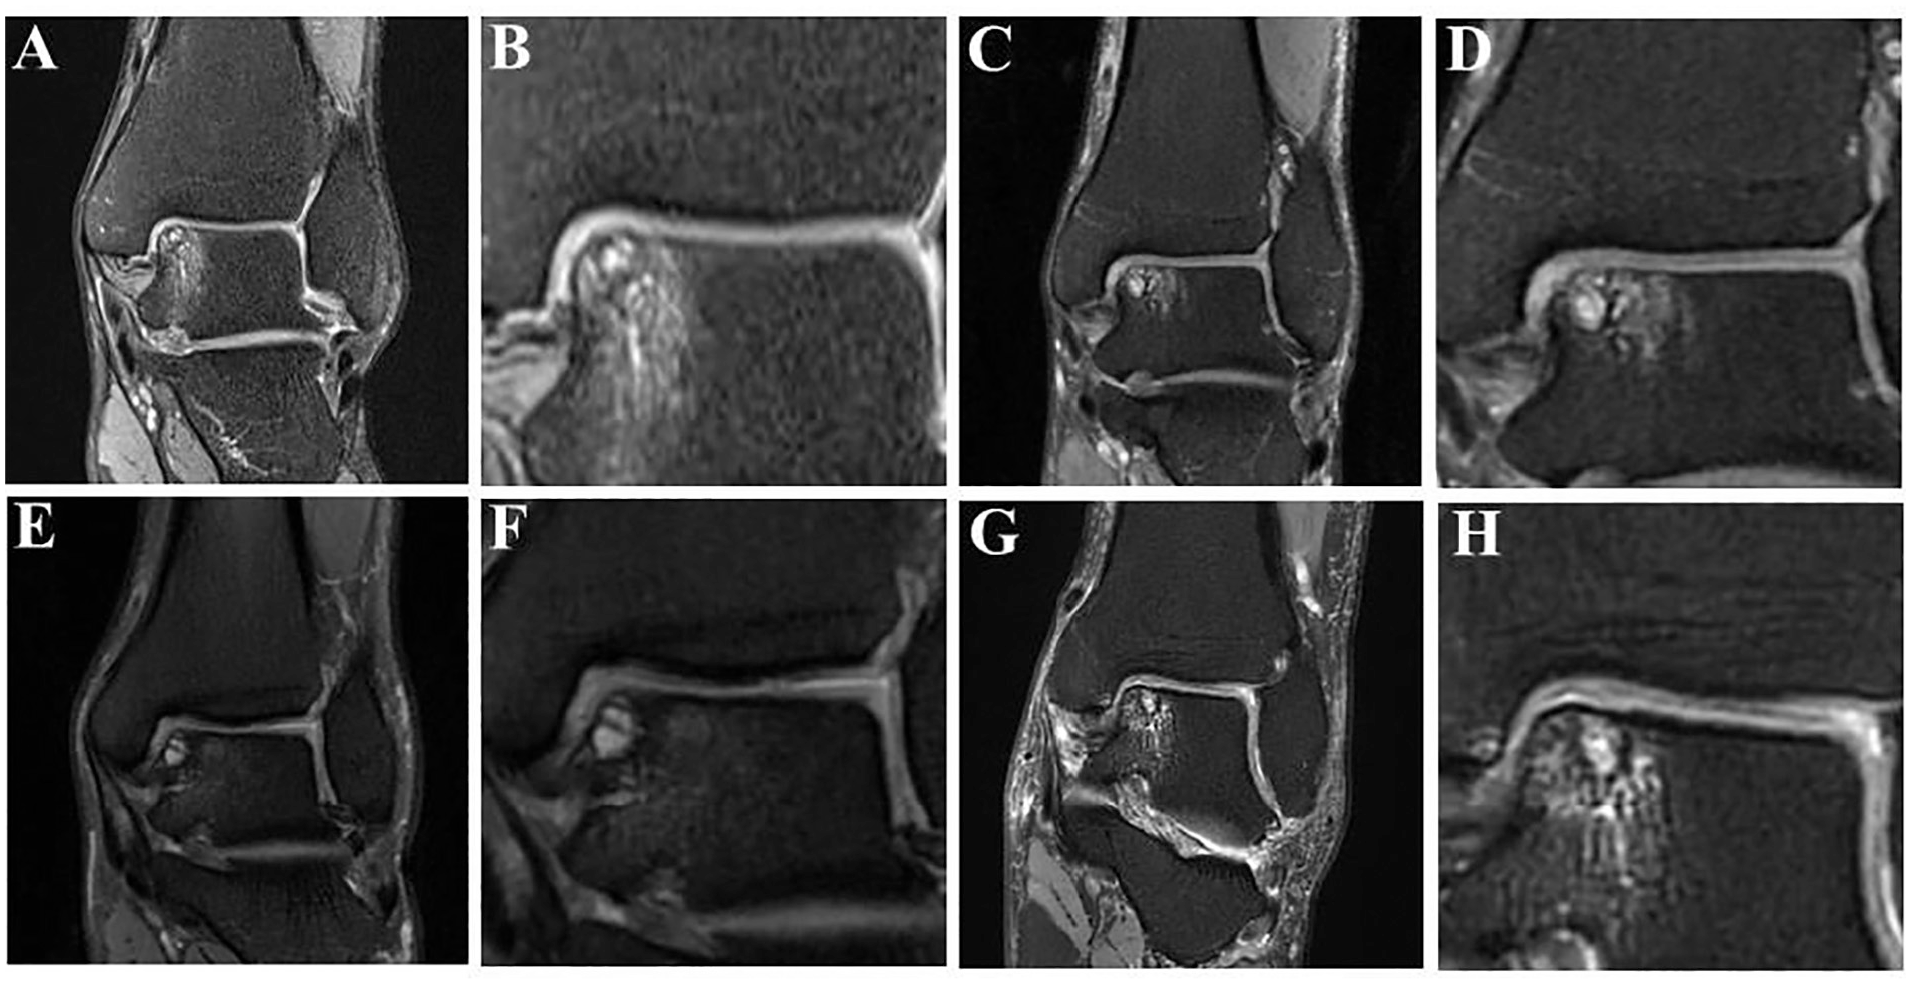
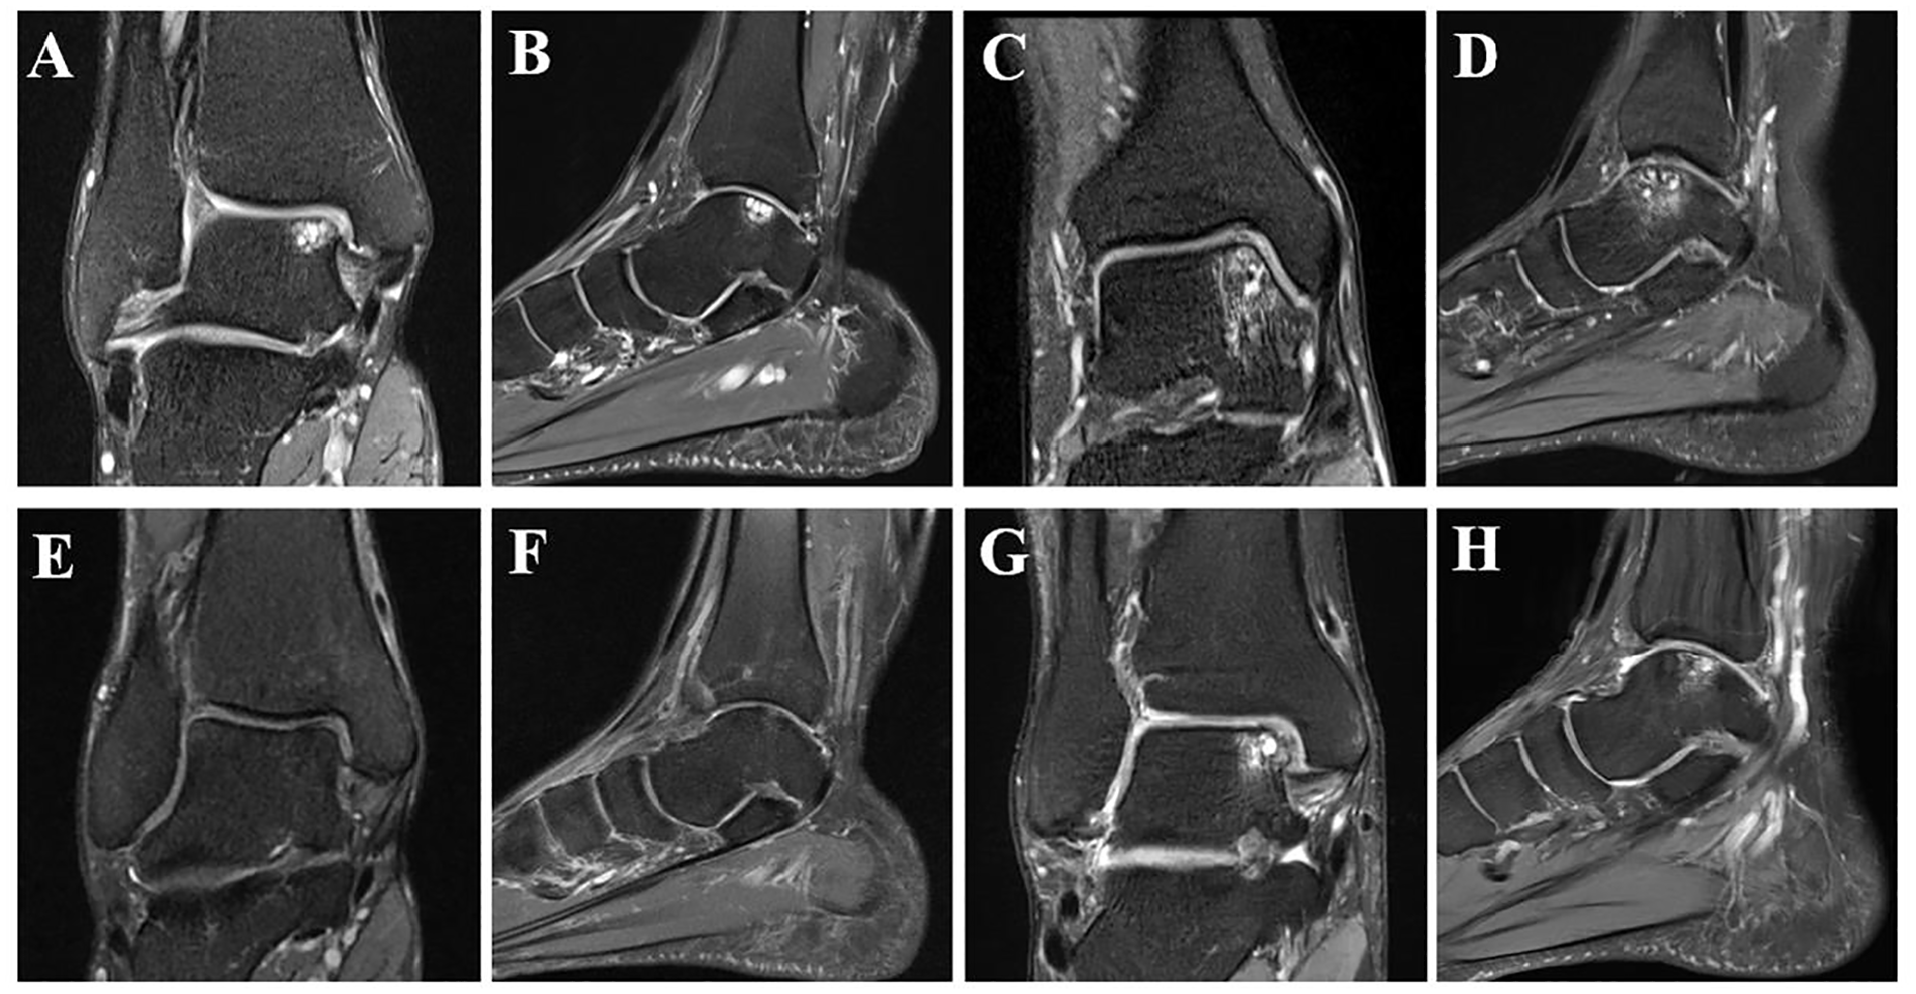
Osteochondral lesion of the talus with jumping dot sign. Totally, 4 typical cases with JD sign were shown. (A, C, E, G) The most extensive range of lesion of each selected case is represented on the corresponding coronal images. (B, D, F, H) The amplification of JD signs is represented in the corresponding coronal images. BME, bone marrow edema; JD sign, jumping dot sign.

Osteochondral lesion of the talus without jumping dot sign. Totally, 4 typical cases without a JD sign were shown. (A, C, E, G) The most extensive range of lesion of each selected case is represented on the corresponding coronal images. (B, D, F, H) The amplification of JD signs is represented in the corresponding coronal images. BME, bone marrow edema; JD sign, jumping dot sign.
Other measurements for cysts were derived from methods of prior studies.4,5,15 The largest coronal length and depth and the sagittal length of cyst and OLT were measured using preoperative MRI (Figure 1). The maximal vertical diameter of the cyst was defined as the largest distance from the top to the bottom of the cyst in this study. The OLT depth included the cyst and the JD sign. Maximal coronal length and sagittal length were defined as the medial to lateral and anterior to posterior dimensions, respectively. 15 The presence of BME and cysts were evaluated both preoperatively and at final follow-up. Furthermore, MOCART (magnetic resonance observation of cartilage repair tissue) scores were assessed at follow-up.
In order to conduct a relative quantitative analysis of preoperative MRI, the coronal PD image of each patient with the most extensive range of lesions was chosen. The talus was divided into 3 distinct areas: the normal bone area, the BME+JD sign area, and the cyst area. Afterward, the PACS workstation (Centricity Radiology RA1000; GE Healthcare) was utilized to measure the maximal and mean signals of these 3 areas. The relative mean or maximal signal of the BME area (or cyst area) was defined as the quotient obtained by dividing the mean or maximal signal value of the BME area (or cyst area) by the mean or maximal signal value of the normal bone area. The reliability of measurements was assessed by calculating the intraclass correlation coefficients (ICCs) for both inter- and intraobserver variability. An ICC value ranging from 0.81 to 1.00 denoted excellent reliability, while a value between 0.61 and 0.80 indicated good reliability. 20
Outcome Assessments
Patient-reported outcome measures (PROMs) were collected before surgery and at follow-up. Ankle function was assessed using the American Orthopaedic Foot & Ankle Society (AOFAS) scale, which was rated as excellent (90-100), good (80-89), fair (70-79), or poor (<70). 4 The Tegner activity scale was used to evaluate sports activity levels (10-point scale). 4 Pain during walking was measured using the visual analog scale (VAS; 10-point scale). 19 When the AOFAS score was <80, the treatment was considered unsatisfactory. 4 Postoperative sensory disturbance, range of motion restriction (plantarflexion/dorsiflexion; inversion/eversion), and reoperation were also recorded during the follow-up. All assessments were blinded to the formation of SBCs after BMS.
Statistical Analysis
The statistical analysis was performed utilizing IBM SPSS Statistics 23 (IBM). Quantitative data were reported as the mean ± SD unless otherwise specified. For the comparison between the group with or without the JD sign, the independent-samples t test or Mann-Whitney U test was selected according to normality tests. Moreover, a general linear model was used to analyze the independent effect of JD sign on clinical outcome. Additionally, the categorical data were analyzed using the Pearson chi-square test. A P value < .05 was considered a significant difference.
A multivariate logistic regression analysis was used to analyze the independent effect of potential risk factors on the cyst recurrence after BMS. After a stepwise regression, the JD sign, the maximal vertical diameter of the cyst, cyst area, age, follow up, and ligament surgery were kept to construct a multivariate logistic model. Additionally, receiver operating characteristic (ROC) curve analysis and calculation of the area under the ROC curve (AUC) were used to evaluate the quantitative and relative quantitative data derived from MRI images. An AUC of 0.7 to 0.8 was considered acceptable, 0.8 to 0.9 was considered excellent. 11 When the AUC was >0.7, the cutoff value for predicting the cyst recurrence was calculated based on the highest Youden index. When the potential cutoff value was obtained, the corresponding sensitivity, specificity, positive predictive value (PPV), and negative predictive value (NPV) were listed.
Results
A total of 117 patients meeting the inclusion criteria were finally followed up in this study. All patients had pre- and postoperative MRI with a minimum 24-month follow-up. Based on the preoperative MRI, the included 117 patients were divided into the JD sign group (n = 41) and the no JD sign group (n = 76) (Figure 4). For the cyst vertical size, no significant difference was found between two groups (P < .05). No other significant difference was observed for baseline characteristics between the 2 groups (Table 1).

Flowchart of this study. OLT, osteochondral lesion of the talus. JD sign, jumping dot sign.
Baseline Characteristics of Patients With Cystic OLTs in the JD Sign and No JD Sign Groups a
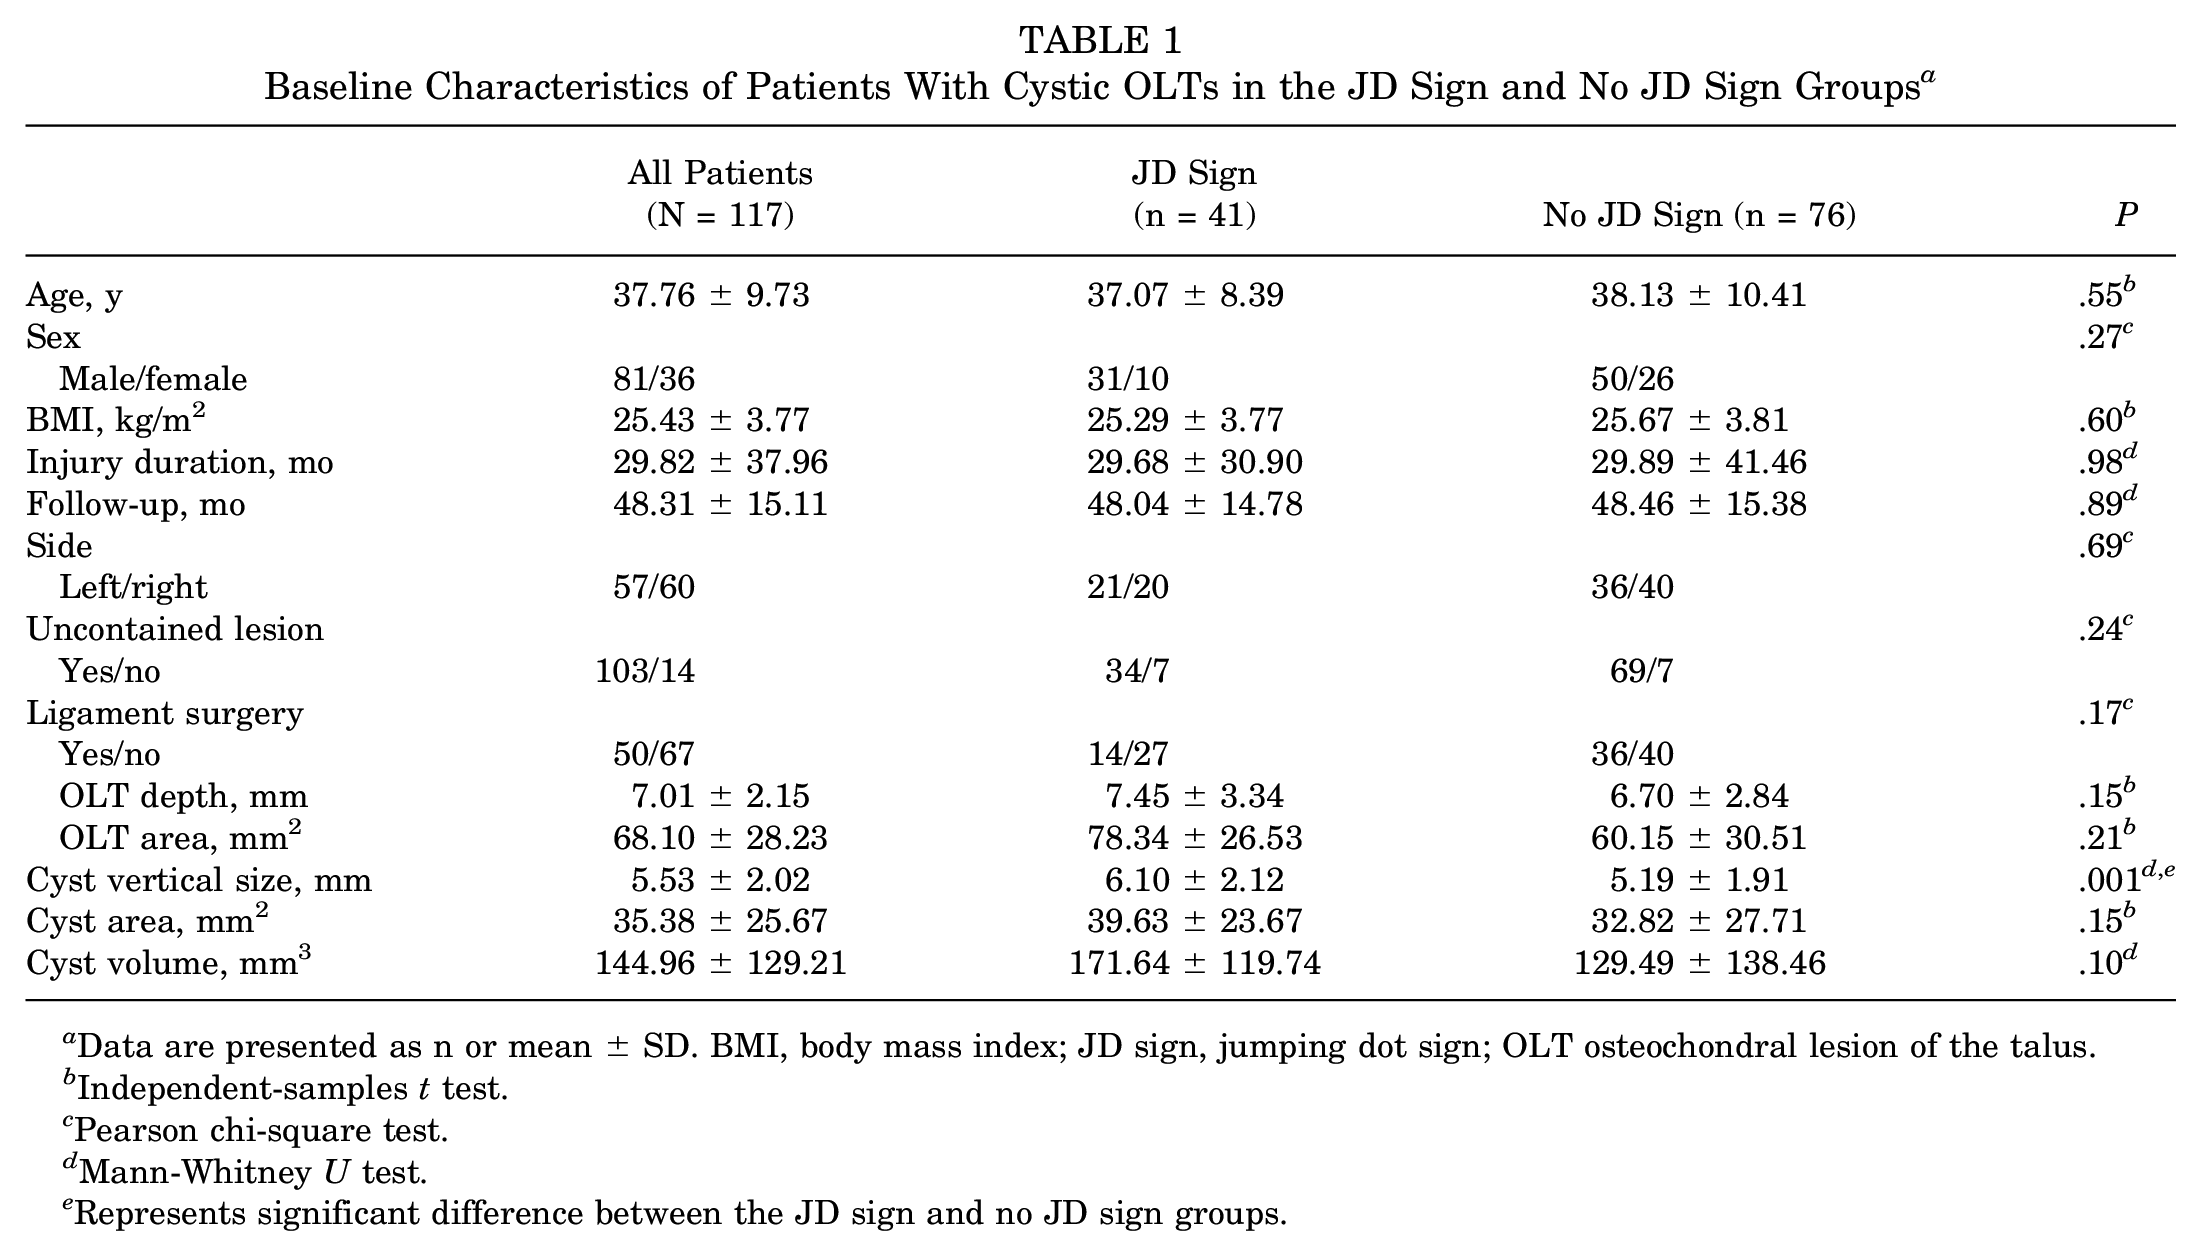
Data are presented as n or mean ± SD. BMI, body mass index; JD sign, jumping dot sign; OLT osteochondral lesion of the talus.
Independent-samples t test.
Pearson chi-square test.
Mann-Whitney U test.
Represents significant difference between the JD sign and no JD sign groups.
Patient-Reported Outcomes
Overall, the patients had significantly improved AOFAS scores (68.69 ± 7.46 vs 86.40 ± 10.75; P = .009). Specifically, there was no significant difference regarding preoperative AOFAS or VAS pain scores between the 2 groups. However, the JD sign group showed significantly inferior postoperative AOFAS and VAS pain scores, inferior improvement in AOFAS and VAS pain scores, and lower satisfaction rate than the no JD sign group (all with P < .05) (Table 2). On the Tegner activity scale, the no JD sign group was significantly greater than the JD sign group (P < .05). Based on previous studies, the reported minimal clinically important difference (MCID) for improvement in VAS score was 2 points for ankle pathologies.21,22 For the improvement of enrolled patients in VAS scores between the 2 groups at the follow-up, 81.58% of patients (62/76) in the no JD sign group exceeded the reported MCID, compared with 60.97% of patients (25/41) in the JD sign group (P < .05). Additionally, no significance was found for the postoperative range of motion restriction, sensory disturbance, and reoperation between the 2 groups (P > .05). Moreover, the general linear model identified the JD sign as an independent risk factor for inferior PROMs (P < .05) (Table 3).
Comparison of Clinical Results Between the JD Sign and No JD Sign Groups a

Data are presented as mean ± SD or n (%). AOFAS, American Orthopaedic Foot & Ankle Society; JD sign, jumping dot sign; ROM, range of motion; VAS, visual analog scale.
Mann-Whitney U test.
Represents significant difference between the JD sign and no-JD sign groups.
Independent-samples t test.
Pearson chi-square test.
Multivariate Analysis of the Association Between Risk Factors and Postoperative Clinical Results a

The general linear model, including factors of JD sign, age, follow-up, LCL surgery, cyst vertical diameter, and cyst area, was performed to investigate the independent effect of JD sign on clinical outcomes. AOFAS, American Orthopaedic Foot & Ankle Society; JD sign, jumping dot sign; LCL, lateral collateral ligament; VAS, visual analog scale.
Represents significant difference between the JD sign and no JD sign groups.
Radiological Outcomes
The ICCs are shown in Table 4, and good reliability of both inter- and intraobserver could be observed. The JD sign group had a significantly higher rate of recurrent postoperative cysts (75.60% vs 15.78%) and lower MOCART scores than the no JD sign group (all with P < .05) (Table 5). Moreover, the multivariate logistic model revealed the JD sign and cyst vertical diameter were independent risk factors for the cyst recurrence after BMS (P = .00 and P = .036, respectively) (Table 6).
Inter- and Intraobserver Reliability for MRI Measurements a
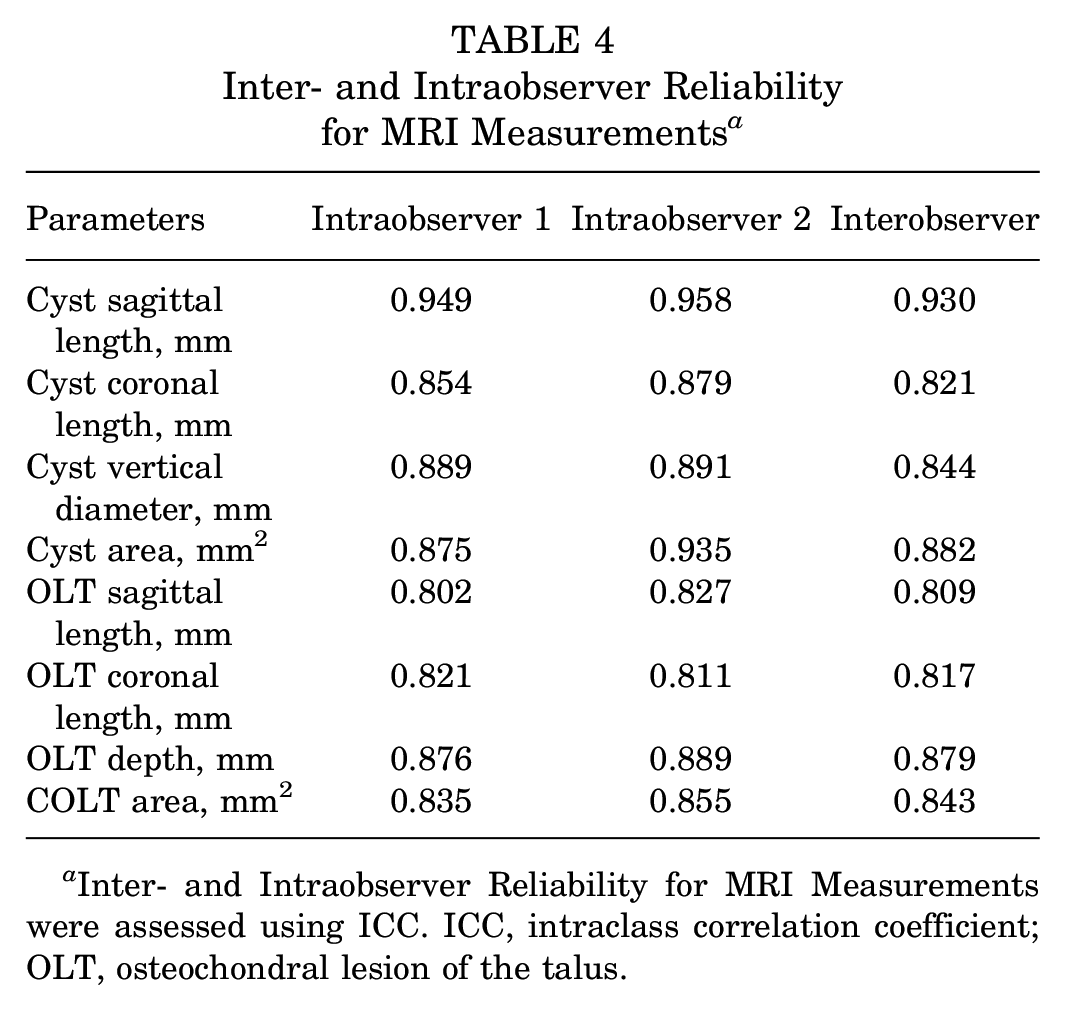
Inter- and Intraobserver Reliability for MRI Measurements were assessed using ICC. ICC, intraclass correlation coefficient; OLT, osteochondral lesion of the talus.
Comparison of Radiological Indicators Between the JD Sign and No JD Sign Groups a

Data are presented as n (%) or mean ± SD. BME, bone marrow edema; BMS, bone marrow stimulation; JD sign, jumping dot sign; MOCART, magnetic resonance observation of cartilage repair tissue; MRI, magnetic resonance imaging; relative maximal signal of the cyst, the maximal signal in the cyst/the signal of the normal bone; relative mean signal of the cyst, the mean signal in the cyst/the signal of the normal bone; relative maximal signal of the BME+JD sign, the maximal signal of BME+JD sign/the signal of the normal bone; relative mean signal of the BME+JD sign, the mean signal of BME+JD sign/the signal of the normal bone.
Represents significant difference between the JD sign and no JD sign groups.
Pearson chi-square test.
Mann-Whitney U test.
Independent-samples t test.
Multivariate Logistic Regression Analysis of the Factors Associated With the Presence of Postoperative Cyst a

The multivariate logistic regression, including factors of JD sign, age, follow-up, LCL surgery, the maximal vertical diameter of the cyst, and cyst area, was performed to investigate the independent effect of JD sign on the presence of a postoperative cyst. JD sign, jumping dot sign; LCL, lateral collateral ligament; OR, odds ratio; OLT, osteochondral lesion of the talus. JD sign represents the abnormal high signal around cyst in the proton density–weighted images.
Represents significant difference between the JD sign and no JD sign groups.
Additionally, the maximal vertical diameter of the cyst as the test variable and the presence of postoperative cyst as the state variable were used to perform the ROC curve analysis and calculation of the AUC at this part. The AUC of the maximal vertical diameter of the cyst was 0.78, for predicting recurrent postoperative cyst, with a cutoff value of 5.4 mm (sensitivity, 81.4%; specificity, 68.9%; PPV, 61.34%; and NPV, 86.44%) (Figure 5). Typical cases are shown in Figure 6. The patient with the maximal vertical diameter of the cyst >5.4 mm and JD sign showed relatively high cyst recurrence rate (32/36; 88.89%) and low AOFAS scores (77.97 ± 9.15), while the patient with the maximal vertical diameter of the cyst >5.4 mm deep (depth range in this study, 2.4-9.0 mm) but without JD sign showed relatively low cyst recurrence rate (6/25; 24%) and good AOFAS scores (87.88 ± 10.35).
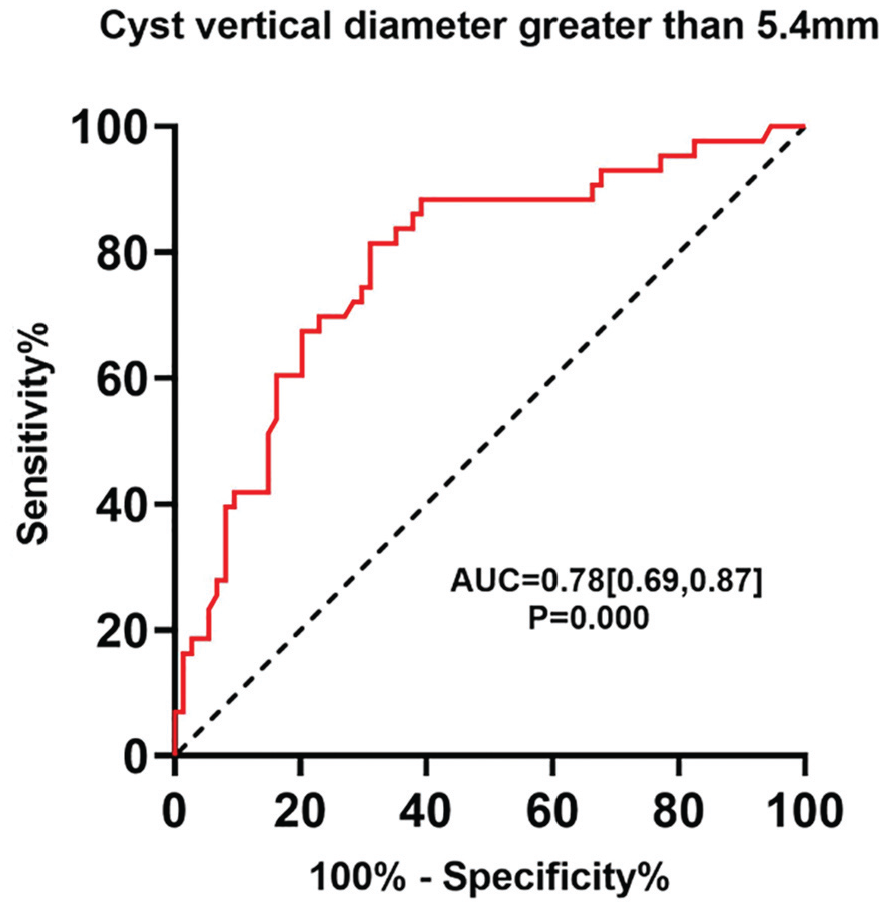
Receiver operating characteristic (ROC) curve analysis. ROC curve calculated from the maximal vertical diameter of the cyst. Area under the ROC curve (AUC) was 0.78. The potential cutoff value was 5.4 mm (sensitivity, 81.4%; specificity, 68.9%; positive predictive value, 61.34%; and negative predictive value, 86.44%).
The comparison between the JD sign and no JD sign groups of MRIs. (A, B) Preoperative images in the no JD sign group. (E, F) No postoperative cyst was found at the follow-up of 26 months. (C, D) Preoperative images in the JD sign group. Obvious JD sign was found in the coronal images. (G, H) The presence of postoperative cyst was found at the follow-up of 25 months. JD sign, jumping dot sign; MRI, magnetic resonance imaging.
Regarding the semiquantitive analysis of signal intensity, the JD sign group showed significantly higher relative max and mean signals of the BME area (P < .05) (Table 4). The AUC of the relative maximal signal of BME for cyst recurrence was 0.71, with a cutoff value of 3.43 (sensitivity, 74.4%; specificity, 59.5%; PPV, 50.8%; and NPV, 78.5%). When only the JD sign was considered by visual inspection, the cyst recurrence rate was 75.6%, which was significantly higher than the control group (15.78%; P < .001). Given the presence of JD sign around the cyst, the cyst recurrence rate using the cutoff of 3.43 was 77.14% (27/35).
Discussion
The most important finding of this study was that the JD sign was significantly associated with inferior clinical outcomes, worse cartilage repair, and higher SBC recurrence following BMS for cystic OLT. For those patients with the maximal vertical diameter of the cyst >5.4 mm and with JD signs, BMS may be not a recommended option.
The JD sign had a negative association with the clinical outcomes of OLT following BMS in this study. The sign around the cyst refers to ≥1 speckle-like area of elevated signals higher than the surrounding BME. The JD sign of this study was commonly seen in the area of BME and an important indicator of inferior bone quality surrounding the cyst. Microdamage of subchondral bone in knee osteoarthritis was once reported in the form of a range of submicron-sized cracks, 13 which commonly indicated that the bone quality was inferior and the mineralized subchondral bone structure was more fragile. Additionally, several studies indicated that persistent BME could develop into cysts.10,14 During the BMS procedures, the formed cyst would be debrided, but the surrounding area of the cyst was less likely to be cleaned thoroughly. The surrounding bone showing JD sign may result in poor integration between the blood clots and the surrounding environment, which may lead to inferior clinical outcomes after BMS.
The JD sign around the cyst was found to be an independent risk factor for the cyst recurrence after BMS in this study. Cyst formation is an important pathology that may lead to pain and hinder cartilage repair. 6 Although the underlying mechanism of cyst formation is not yet fully understood, it may develop through repeated microtrauma, excessive mechanical stress, and ischemia. 3 Additionally, the SBC often indicates obvious damage to the subchondral bone, which is highly innervated and plays an important role in the metabolism and mechanical support of the covering cartilage. 7 Furthermore, in histological analysis, SBCs commonly contains mixed fibrous tissue with a varying degree of bone remodeling and is often encased with sclerotic bone. 6 Based on this evidence, the JD sign found in the PD-weighted images might be a sign of a precyst, which may easily progress into a mature cyst. The basic mechanism needs to be further studied.
Specifically, 75.60% of patients with JD sign had the postoperative cyst after BMS in this study, compared with 15.78% for patients without this sign. The results indicated that the predictive value of the JD sign for the cyst recurrence was good. In cases with JD sign, focal regions with heightened signal would occur in the corresponding BME area, which resulted in elevated mean and maximal signal values in the BME. According to the semiquantitative analysis in this study, when the relative maximal signal of preoperative BME exceeded 3.43, 77.14% of patients (sensitivity) with a JD sign developed into postoperative cysts after BMS, comparable with the visual inspection of a JD sign (75.60%). The consistency between the semiquantitative analysis and visual inspection revealed that JD sign recognized by visual inspection may serve as a simple, efficient, and feasible clinical indicator for predicting the cyst recurrence after BMS.
Moreover, when combined with the maximal vertical diameter of the cyst, the JD sign showed excellent effectiveness in the prediction of cyst recurrence in this study. Deep OLTs were commonly associated with the poor PROMs following BMS in previous studies.1,2,8 An international consensus showed that the ideal size of an OLT for BMS was <5 mm in depth. 8 Moreover, for obtaining good to excellent PROMs, potential cutoff depth of 7.8 mm for general OLT 2 and 7.56 mm for cystic OLT was previously reported based on the MRI measurements. 4 However, due to the heterogeneity of cyst morphology and nature, these values could not be a uniform standard for all patients. In addition, objective indicators such as postoperative MRI were rarely used in previous studies for evaluation. The present study included PROMs and postoperative MRI, and the results suggested that the combination of JD sign and the maximal vertical diameter of the cyst >5.4 mm had excellent predictive values of cyst recurrence.
To our knowledge, this study is the first to combine lesion size and subchondral bone characteristics to analyze the indication for BMS surgery. Other strengths included the large sample size of cystic OLTs with pre- and postoperative MRI. This study demonstrated that the new imaging sign (JD sign) could be a good predictor for inferior prognosis and cyst recurrence following BMS of OLT. Moreover, the combination of JD sign and maximal vertical diameter of the cyst >5.4 mm had excellent predictive value of cyst recurrence, which might provide a more accurate reference standard for the treatment selection of patients with cystic OLT. The patient with the maximal vertical diameter of the cyst >5.4 mm and JD signs may be the contraindication of the BMS. However, for the patient with the maximal vertical diameter of the cyst >5.4 mm (range, 2.4-9.0 mm) but without JD sign, BMS may remain as the first-recommended treatment strategy.
Limitations
This study has some limitations. First, the study is limited by its retrospective design, and some potential selection bias may exist. Second, the follow-up was not standardized, including 2- to 7-year follow-up, which may be a potential confounding factor for cyst formation, though no significant effect was found regarding the variable of follow-up in the multivariate analysis. Third, as the semiquantitative analysis was 2-dimensional, some slices of the MRIs might not have been considered comprehensively. Further advanced techniques, such as 3-dimensional reconstruction, should be applied to analyze the JD sign around the bone cysts in the future.
Conclusion
The JD sign might be significantly associated with inferior clinical outcomes as well as higher SBC recurrence following BMS for cystic OLTs. For those patients with the maximal vertical diameter of the cyst >5.4 mm and with JD signs, BMS may not be an appropriate option.
Footnotes
Final revision submitted February 12, 2025; accepted March 7, 2025.
One or more of the authors has declared the following potential conflict of interest or source of funding: This work was supported by grants from Capital Health Research and Development of Special(2022-2Z-40913), Beijing Natural Science Fund-Haidian Original Innovation Joint Fund (L222064), Innovation & Transfer Fund of Peking University Third Hospital (BYSYCY2024077), and Clinical Cohort Construction Program of Peking University Third Hospital (BYSYDL2022016). AOSSM checks author disclosures against the Open Payments Database (OPD). AOSSM has not conducted an independent investigation on the OPD and disclaims any liability or responsibility relating thereto.
Ethical approval for this study was obtained from the medical committee institutional review board of Peking University Third Hospital (IRB00006761-M2021178).
Data Accessibility Statement
The data sets used and/or analyzed during the current study are available from the corresponding author on reasonable request.