
Abstract
Background:
Ulnar collateral ligament (UCL) injuries are prevalent in baseball pitchers. Epidemiological research has identified body weight as a risk factor.
Purpose/Hypothesis:
The purpose of this study was to evaluate the influence of anthropometric characteristics (ie, height, weight, and related measures) on elbow varus torque in adult baseball pitchers. It was hypothesized that weight and height would each be correlated with elbow varus torque.
Study Design:
Descriptive laboratory study.
Methods:
Anthropometric and fastball pitching biomechanical data from 627 collegiate and professional pitchers were analyzed. Elbow varus torque during pitching was computed using the pitcher’s weight, height, pitching biomechanics, and inverse dynamics. Pearson correlation coefficients were calculated between individual anthropometric characteristics and elbow varus torque. Stepwise multivariate regression was also performed.
Results:
There was a strong correlation of elbow varus torque with weight and weight × height; a moderate correlation with body mass index; and a weak correlation with forearm length, height, and upper arm length. Stepwise regression explained 38% of elbow varus torque, with weight as the main contributor.
Conclusion:
Larger pitchers, particularly heavier pitchers, produced greater elbow varus torque.
Clinical Relevance:
Pitchers with a greater weight may be at a higher risk of UCL injuries.
An injury to the ulnar collateral ligament (UCL) of the elbow is an unfortunate and frequent occurrence among baseball pitchers. The resultant decrease in pitching performance and the need to miss time from playing baseball to undergo rehabilitation or surgical management of these injuries are significant concerns for athletes and baseball organizations. A UCL injury is related to high varus torque requirements placed on the ligament to counteract the valgus loads generated during the throwing motion, and previous work has shown that the UCL injury risk is correlated with increases in these torque values. 2 Various risk factors for a UCL injury have been identified, with recent studies focusing on characteristics intrinsic to the pitcher’s size and physical dimensions (anthropometric characteristics).6,9,29,37 A recent in vitro study measured UCL stiffness and failure torque in a sample of 20 cadaveric right arms from relatively young (mean age, 33 ± 6 years) male donors of varying body weights and heights. 3 The results showed no correlation between body weight and UCL stiffness (r = 0.29; P = .21) or UCL failure torque (r = 0.05; P = .85). That study also showed no correlation between body height and UCL stiffness (r = 0.28; P = .24) or UCL failure torque (r = 0.28; P = .25). Now knowing that a larger size does not correspond to a stronger UCL, it becomes important to determine whether larger pitchers place increased loads on the UCL, as they would therefore have a higher injury risk without any protective benefit related to size.
Thus, the purpose of the present study was to evaluate the relationship between elbow varus torque and anthropometric characteristics (height, weight, and upper extremity segment lengths) as well as demographic characteristics in a large sample of collegiate and professional baseball pitchers. Our hypothesis was that increased anthropometric measurements would correlate with increased elbow varus torque.
Methods
The Ascension Institutional Review Board determined this study to be exempt from full review. This study utilized a deidentified retrospective dataset of 627 healthy adult (ie, collegiate or professional) baseball pitchers who had been previously evaluated by the American Sports Medicine Institute. Each pitcher was recognized as healthy at the time of testing based on his subjective ability to pitch with 100% effort, throwing at least 5 fastballs during testing. Although there were no inclusion/exclusion criteria based on sex, all participants were male.
Before each pitcher’s biomechanical evaluation, a set of demographic and anthropometric characteristics was measured/calculated and recorded. The arm with which they pitched (handedness) and their competition level at the time of the biomechanical evaluation (professional vs collegiate) were documented. Age was determined based on the pitcher’s date of birth and the date of his biomechanical evaluation. Weight and height were measured with a digital scale and stadiometer, respectively. Body mass index (BMI) was calculated as the participant’s weight (in kg) divided by the square of his height (in m). Weight × height was also calculated and used as a parameter in this study because elbow varus torque in pitching biomechanical studies is often normalized by this parameter.7,8,12,20,25,26
A set of 39 retroreflective markers was placed on the participant’s bony landmarks as previously described. 14 The participant then warmed up as he would before pitching in a game, and when he indicated that he was ready, he threw 5 to 15 full-effort fastballs from an indoor pitching mound to a strike zone located above a home plate 18.44 m from the pitching rubber. Each participant threw from either the windup or stretch position during testing; pitchers who only throw from the stretch position were instructed to do the same during testing, while all others were instructed to throw from the windup position during testing. The motion of the reflective markers during each pitch was captured at 240 Hz by 12 synchronized cameras, while ball velocity was measured with a radar gun (Stalker Radar). The 3-dimensional position-versus-time data of each reflective marker were filtered with a 13.4-Hz fourth-order Butterworth low-pass filter.13,15,16,39 Joint centers of the elbows, wrists, knees, and ankles were defined as the midpoints between their respective medial and lateral markers, while shoulder and hip joint centers were calculated employing techniques described previously.13,15,16,39 Upper arm length was the distance between the shoulder marker and lateral elbow marker on the throwing arm, while forearm length was the distance between the lateral elbow and wrist markers. Linear and angular velocities and accelerations for the hand, forearm, upper arm, and upper trunk joint centers and segments were calculated using a 5-point center difference method.13,15,16,39 Inertial properties (mass, moment of inertia) for the hand, forearm, and upper arm segments were estimated using the weight and height of the pitcher. 15 For instance, the throwing hand, forearm, and upper arm were modeled as 0.7%, 1.6%, and 2.7% of the body weight, respectively. The baseball was modeled as a 0.142-kg point mass in the hand until ball release. A time series of elbow varus torque was calculated for each pitch using these joint center and segment kinematic data (position, velocity, and acceleration), inertial properties, and inverse dynamics.13,15,16,39 Maximum elbow varus torque was defined as the maximum value during each pitch, which usually occurred when the arm was cocked near the time of maximum shoulder external rotation.
Statistical Analysis
The mean and standard deviation among all participants were determined for elbow varus torque, age, ball velocity, and 6 anthropometric parameters: weight, height, weight × height, BMI, forearm length, and upper arm length. Elbow varus torque for each pitcher was calculated as the mean value of maximum elbow varus torque among his fastball trials. Similarly, ball velocity was calculated as the mean value among his fastball trials. For each of these 8 continuous independent parameters, the individual relationship with elbow varus torque was assessed using the Pearson correlation coefficient, with correlations categorized as weak (R < 0.3), moderate (0.3 ≤ R < 0.5), strong (0.5 ≤ R < 0.7), or very strong (R ≥ 0.7). In addition, elbow varus torque was compared between 3 categorical parameters (competition level, delivery type, and handedness) using an independent t test. Effect sizes (Cohen d) were calculated and categorized as trivial (d < 0.2), small (0.2 ≤ d < 0.5), medium (0.5 ≤ d < 0.8), or large (d ≥ 0.8).
Anthropometric parameters with significant results were then entered into a stepwise multivariate regression model to determine how well a combination of these parameters could explain the variance in elbow varus torque. The stepwise criteria to enter were set at P ≤ .05, while the criteria to remove were set at P > .10. The variance inflation factor was assessed to ensure no issues of multicollinearity. 36 All analyses were conducted in SPSS (Version 29.0; IBM), with an a priori level of significance (α) of .05.
Results
Across the 627 adult pitchers, the mean elbow varus torque was 94.8 ± 17.0 N·m. Overall, 7 of the 8 continuous parameters had a statistically significant (P < .05) correlation with elbow varus torque, with age being the only exception (Table 1). There was a strong correlation with weight and weight × height; a moderate correlation with BMI; and a weak correlation with forearm length, height, ball velocity, and upper arm length. Elbow varus torque was significantly larger in professional pitchers in comparison to collegiate pitchers (Table 2), but this result had a small effect size. Neither delivery type nor handedness showed a statistically significant difference between groups.
Correlation of Continuous Parameters With Elbow Varus Torque a

Strong correlations (0.7 > R ≥ 0.5) are in bold text, moderate correlations (0.5 > R ≥ 0.3) are in italicized text, and weak correlations (R < 0.3) have been left in plain text. No correlations with elbow varus torque were found to be very strong (1.0 ≥ R ≥ 0.7). BMI, body mass index.
Statistical significance.
Differences in Elbow Varus Torque Between Categorical Parameters

Statistical significance.
Stepwise multivariate regression (Table 3) resulted in a model (Table 4) that was a statistically significant prediction of elbow varus torque: F(3,623) = 126.3; P < .001; adjusted R2 = 0.375. The final model included 3 of the 6 anthropometric parameters: weight, upper arm length, and forearm length. All 3 included parameters were found to be statistically significant individual predictors (P < .05).
Regression Model Steps

Final Regression Model for Elbow Varus Torque a
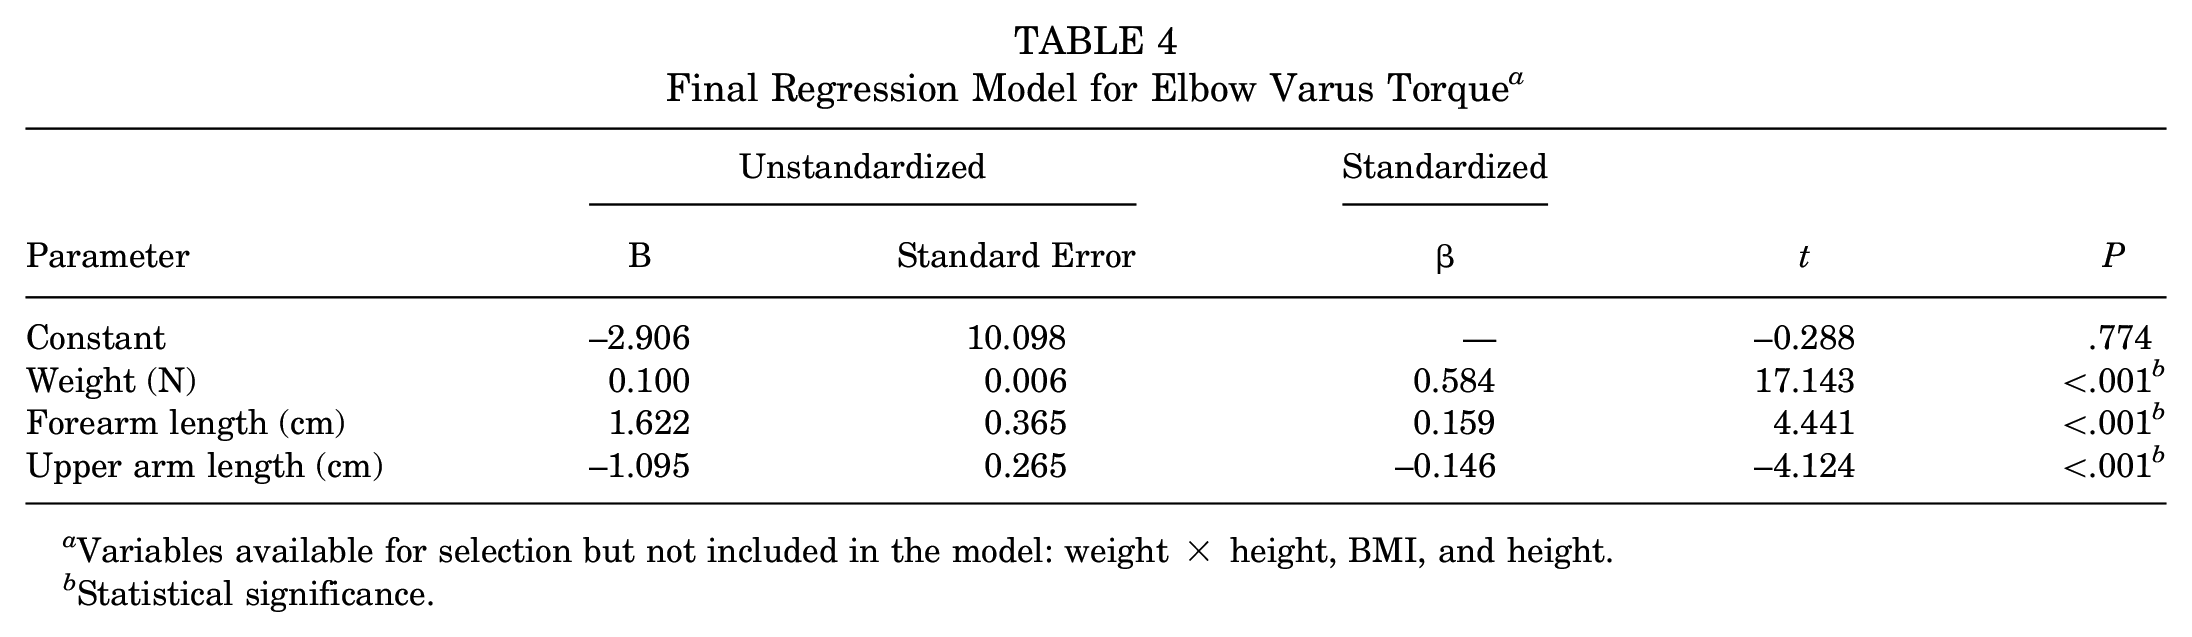
Variables available for selection but not included in the model: weight × height, BMI, and height.
Statistical significance.
Calculations using the model’s unstandardized coefficients showed that a 1-N·m increase in elbow varus torque would result from any one of the following: a 10.0-N (2.25-lb) increase in weight, a 0.6-cm increase in forearm length, or a 0.9-cm decrease in upper arm length. It must be noted that the direction of influence on elbow varus torque for upper arm length flipped in comparison to the univariate result.
Discussion
As hypothesized, there were significant positive relationships between anthropometric parameters and elbow varus torque when pitching. Our univariate analysis found that weight was the parameter with the strongest correlation to elbow varus torque, while the two parameters with the next strongest correlations (weight × height and BMI) were also related to weight (see post hoc correlation analysis in Appendix Table A1). Forearm length, height, ball velocity, and upper arm length also had significant correlations with elbow varus torque during pitching. The multivariate regression model showed that weight was the strongest contributor, explaining 35% of the elbow varus torque variance on its own (while the inclusion of forearm and upper arm lengths together explained an additional 2.5%). Although the model did not select weight × height, BMI, or height, this does not necessarily suggest that these variables are unrelated to elbow varus torque. More likely, their inclusion did not significantly improve the existing model because of their close relationship with the selected variables.
Tension in the UCL provides approximately one-third of the required elbow varus torque during pitching.4,31 Thus, because bigger pitchers require greater elbow varus torque, they likely also have greater UCL tension. However, a bigger body size does not correlate with greater UCL strength. 3 Greater UCL tension during pitching without greater UCL strength suggests that larger pitchers are more susceptible to UCL injuries. This belief is supported by the work of Chalmers et al, 6 who followed 1327 pitchers in Major League Baseball (MLB) during an 8-year period and found a significant difference (P = .005) in weight between pitchers with subsequent UCL reconstruction (mean weight, 98.2 kg) compared with pitchers who were not injured (mean weight, 96.1 kg) but no difference in height (P = .934). However, those results differed from the findings of a study of 104 MLB pitchers who underwent UCL reconstruction and a matched control group. 37 The smaller study developed a logistic regression model explaining approximately 20% of the variance; while weight was not selected by their model, height was selected (second weakest of 5 contributors; with taller pitchers having a slightly decreased risk of injuries).
Since the first UCL surgery in 1974, the average height and weight of top MLB pitchers have steadily increased (eg, 6 ft 2 inches and 193 lb in the 1970s vs 6 ft 4 inches and 221 lb in the 2000s 17 ); weight has increased at a faster rate, resulting in increased BMIs as well (24.9 vs 27.3 kg/m2, respectively). Thus, our findings suggest that the anthropometric characteristics of modern-day pitchers place them at a higher risk of UCL injuries than pitchers of past eras. While increases in ball velocity and spin rate are commonly cited as chief contributors to the continued rise in UCL injuries,1,22 anthropometric factors have been comparatively underinvestigated.
The dataset utilized for this study has many strengths (eg, quantity of pitchers, high competition levels, and average ball velocity); however, the lack of participant-specific mass distribution data is an unfortunate limitation. Thus, while our results highlight the influence of weight-related parameters, we were unable to isolate the effects of body weight from those of individual segment weights (eg, the upper arm and forearm). Considering the high angular velocities involved in the pitching motion and the timing of peak elbow varus torque (near the transition from shoulder external rotation to internal rotation), it is likely that the weight and inertia of segments distal to the elbow (eg, the forearm) have the largest influence on elbow varus torque. Future studies could test this theory by incorporating detailed body composition imaging 33 and/or more complex modeling and simulation methods. 10
The relative significance of inertia of the forearm is further supported by our findings related to the segment lengths. Both the univariate and multivariate results suggest that increased forearm length was related to increased elbow varus torque. Yet, there was a discrepancy in the direction for upper arm length, which, from a physics perspective, should not directly influence elbow varus torque. Post hoc correlation analysis (Appendix Table A1) found that upper arm length had much stronger correlations with both forearm length (R = 0.418) and weight (R = 0.303) than with elbow varus torque (R = 0.097). Considering their own positive relationships with elbow varus torque, it is likely that the positive correlation of upper arm length to elbow varus torque in univariate analysis was actually a reflection of these other relationships. Interestingly, the regression model’s negative coefficient for upper arm length is likely also an indirect result of interactions between those same variables. When multivariate regression was performed again, with an arm length ratio parameter (ie, forearm length divided by the total of forearm and upper arm lengths) added to the list of variables available for selection by the regression model, the new parameter was selected in place of the individual segment lengths (Appendix Tables A2 and A3). While it was difficult to fully tease out these specific relationships via our statistical methods, we recommend that future work include a modeling and simulation study, systematically perturbing the individual segment inertial properties (eg, lengths and weights) and examining the resulting effects on elbow varus torque and ball velocity.
Recent suggestions aimed at reducing UCL injuries include the strengthening of forearm muscles that have the capability to provide UCL-protective varus torque.18,19,31,38 However, there may be a delicate balance between an increase in protective torque capability and an increase in muscle mass, which would increase rotational inertia about the varus-valgus axis and likely add to the detrimental valgus load. Furthermore, it may be difficult to strengthen the targeted muscles without inadvertently strengthening antagonistic muscles as well. As pitching involves large amounts of muscle co-contraction,34,35 the strengthening of antagonistic muscles may contribute to valgus torque in 2 ways: increased rotational inertia and increased muscle force.
While we had aimed to focus on anthropometric measures with our initial regression model, we did run another model (Appendix Table A4), adding ball velocity and competition level as variables available for selection (after confirming that they were only weakly correlated with the initial variables). While this model exhibited a large similarity to the anthropometric-only model, both newly available parameters were also selected, with ball velocity becoming the second variable selected (after weight) (Appendix Table A5). Thus, both our univariate and multivariate results suggest that increased elbow varus torque correlates with increased pitch velocity, which is consistent with numerous previous biomechanical studies11,23,24,26,30,32 as well as epidemiological studies that have suggested fastball velocity as a significant risk factor for UCL injuries.5,6,37 This is consistent with a common theory in the media and baseball world today that the rise in UCL injury rates in recent years is related to the pursuit of maximum velocity.1,22 While univariate analysis also suggests that a higher level of competition is correlated with higher elbow varus torque, it is important to note that competition level was even more strongly correlated with ball velocity (Appendix Table A1). Our additional regression model (Appendix Table A4) suggests that after controlling for velocity, professional pitchers have lower elbow varus torque than collegiate pitchers, supporting the results of a recent study that showed greater “biomechanical efficiency” (fastball velocity divided by varus torque) in professional pitchers than in collegiate pitchers. 7
Multivariate regression showed that a model incorporating solely anthropometric parameters could explain 38% of the variance in elbow varus torque between pitchers. While the inclusion of parameters such as ball velocity and competition level may lead to a small additional increase (~6%), more than half of the variance in elbow varus torque is still unexplained. Much of the remaining variance is likely caused by pitching biomechanics. Numerous studies have shown relationships between variations in pitching kinematics and elbow varus torque.7,8,11,12,14,15,21,23,24,26,32 Optimizing pitching kinematics may enable a pitcher to reduce his elbow varus torque and the risk of UCL injuries.
Additional limitations of the present study include the assumption of positive relationships for net elbow varus torque with UCL tension and with the UCL injury risk. While this may be a commonly accepted premise, future studies combining biomechanical analyses with musculoskeletal models and/or clinical outcomes could further validate this assumption. We also did not attempt to examine how fatigue may affect the findings, as each pitcher only threw approximately 10 fastballs during data collection. As weight may influence fatigue,27,28 researchers with more suitable datasets (ie, a larger number of pitches per session) may wish to examine these relationships. The current study was also limited to fastball pitches; future research may investigate relationships in other pitch types such as curveballs, sweepers, changeups, and sliders. Another limitation of the study is that only healthy adult baseball pitchers were included. The relationships between anthropometric properties and elbow varus torque may be different for other ages, such as youth or high school–aged pitchers. Regarding our statistical approach, stepwise regression can be prone to overfitting and getting stuck on local minima. This can affect the resulting coefficients, and a potential failure to reach the global solution could have contributed to differences between univariate and multivariate analyses. Future statistical analyses could incorporate more advanced techniques such as lasso and/or ridge regression.
Conclusion
Weight was the anthropometric parameter with the strongest contribution to elbow varus torque. Height, weight × height, forearm length, upper arm length, and BMI also influenced elbow varus torque, although it is important to be mindful of their relationship to each other. While these results suggest that the UCLs of larger pitchers are subject to higher varus torque requirements, previous research has shown no relationship between either weight or height and UCL strength. Thus, larger pitchers, particularly heavier pitchers, may be at a greater risk of UCL injuries. This is consistent with epidemiological data in MLB showing a greater weight in pitchers with a UCL injury.
Footnotes
Appendix
Regression Model Steps, With Ball Velocity and Competition Level Available for Selection

| Model Step | Entered Parameter | R | R 2 | Change in R2 | Adjusted R2 | Standard Error of Estimate, N·m |
|---|---|---|---|---|---|---|
| 1 | Weight (N) | 0.593 | 0.351 | 0.351 | 0.350 | 13.73 |
| 2 | Ball velocity (m/s) | 0.626 | 0.392 | 0.041 | 0.390 | 13.30 |
| 3 | Upper arm length (cm) | 0.638 | 0.407 | 0.015 | 0.404 | 13.15 |
| 4 | Forearm length (cm) | 0.655 | 0.429 | 0.023 | 0.429 | 12.90 |
| 5 | Competition level (professional = 1; collegiate = 0) | 0.662 | 0.438 | 0.009 | 0.434 | 12.81 |
Final revision submitted March 7, 2025; accepted March 28, 2025.
One or more of the authors has declared the following potential conflict of interest or source of funding: K.D.P. has received a grant from Arthrex and educational support from Smith & Nephew. J.R.A. has received a grant from Arthrex. AOSSM checks author disclosures against the Open Payments Database (OPD). AOSSM has not conducted an independent investigation on the OPD and disclaims any liability or responsibility relating thereto.
Ethical approval for this study was waived by the Ascension Institutional Review Board.