
Abstract
Background:
In patients undergoing high tibial osteotomy (HTO), an excessive increase in joint line obliquity (JLO) after surgery leads to poor clinical outcomes. Phenotype analysis is a simple and intuitive method to classify knee alignment, including JLO. However, there are no studies investigating phenotype changes before and after surgery in patients undergoing realignment osteotomy.
Purpose:
To investigate (1) the preoperative and postoperative phenotype distribution in patients undergoing primary realignment osteotomy for medial compartmental osteoarthritis and (2) the incidence and radiographic risk factors for excessive postoperative JLO.
Study Design:
Cross-sectional study; Level of evidence, 3.
Methods:
A total of 348 knees (320 patients) undergoing primary realignment osteotomy for medial compartmental osteoarthritis with a varus deformity from January 2010 to July 2021 were included. Preoperatively and at 1 year postoperatively, we evaluated coronal-plane alignment on standing scanograms, classifying them into 9 phenotypes based on the modified Coronal Plane Alignment of the Knee classification. We identified changes in the preoperative and postoperative phenotype distribution through scatterplots and analyzed differences in excessive postoperative JLO (arithmetic JLO [aJLO] >4°) based on the preoperative phenotype. Receiver operating characteristic analysis identified preoperative radiographic parameters and their cut-off values as risk factors for excessive postoperative JLO after HTO.
Results:
The most common preoperative phenotype was type I (varus and apex distal; n = 149 [42.8%]), and the most common postoperative phenotype was type VI (valgus and apex neutral; n = 187 [53.7%]). The incidence of excessive postoperative JLO was significantly higher in preoperative type IV (varus and apex neutral; 14.5%) than in type I (0.7%), type II (neutral and apex distal; 0.0%), and type V (neutral and apex neutral; 10.4%). In receiver operating characteristic analysis for excessive postoperative JLO, the preoperative mechanical lateral distal femoral angle (mLDFA) and aJLO showed a high area under the curve of 0.916 and 0.914, respectively, with cut-off values of 90.2° and −1.5°, respectively. In the preoperative mLDFA ≥90.2° group, the incidence of excessive postoperative JLO was significantly higher than in the preoperative mLDFA <90.2° group (19.8% vs 0.4%, respectively; P < .001). In the preoperative aJLO ≥–1.5° group, the incidence of excessive postoperative JLO was significantly higher than in the preoperative aJLO <–1.5° group (35.1% vs 1.4%, respectively; P < .001).
Conclusion:
Preoperative type IV (varus and apex neutral) had a higher risk of excessive postoperative JLO. Specifically, when the preoperative mLDFA was ≥90.2° or the preoperative aJLO was ≥–1.5°, there was an increased risk of excessive postoperative JLO after isolated HTO.
Keywords
High tibial osteotomy (HTO) is an effective surgical treatment option for varus-aligned medial compartmental osteoarthritis. However, this procedure inevitably alters the patient's natural alignment, and an excessive increase in joint line obliquity (JLO) is known to increase subluxation and shearing force within the joint, negatively affecting the patient's clinical symptoms and the joint itself.2,9,10
The acceptable range of JLO varies in different studies, but some have proposed JLO ≤4° or ≤5° as permissible limits.3,11,19,22 Particularly in studies focusing on medial opening wedge HTO (MOWHTO), an increase in the medial proximal tibial angle (MPTA) >95° is known to be associated with negative effects on the patient's function and clinical outcomes.6,10,21 For these reasons, some studies recommend additional distal femoral osteotomy (DFO), known as double-level osteotomy (DLO), which has been shown to yield better clinical outcomes in patients with severe varus accompanied by femoral varus.1,3,19,20 However, in the majority of cases involving osteoarthritis with a varus deformity, positive clinical outcomes have been observed using single-level HTO procedures.4,5,25
In many studies, JLO is defined as the angle between the ground and the tibial articular surface on standing radiographs.14,15 However, this value can vary depending on the position of lower limb adduction on radiographs, and particularly, changes in lower limb alignment after MOWHTO can induce compensatory reactions in the hip and ankle joints, causing lower limb adduction. 17 The Coronal Plane Alignment of the Knee (CPAK) classification, proposed in 2021, is a relatively simple and intuitive classification system for knee alignment. 13 In this classification, JLO is defined as the calculated sum of MPTA and mechanical lateral distal femoral angle (mLDFA), allowing for a simple and consistent measurement, regardless of the limb position. However, to date, there have been no reported studies on the phenotype of patients undergoing osteotomy.
The hypothesis of this study was that the degree of JLO after realignment osteotomy would vary depending on the preoperative phenotype. We aimed to investigate the preoperative and postoperative phenotype distribution of patients who underwent realignment osteotomy for medial compartmental osteoarthritis using the modified CPAK classification, to identify whether there is a difference in the incidence of excessive postoperative JLO based on the preoperative phenotype, and to investigate the related radiographic risk factors.
Methods
Patient Selection
A total of 378 knees (350 patients) that underwent surgical correction for varus alignment of the knee between January 2010 and July 2021 at a single institution were retrospectively reviewed in this study. The inclusion criteria were symptomatic medial osteoarthritis (Kellgren-Lawrence grade ≤3) with varus alignment (mechanical hip-knee-ankle angle [mHKAA] >3°) that failed nonoperative treatment and a range of motion with >90° of flexion. The diagnosis was confirmed through standing whole lower limb anteroposterior (AP) radiography, 45° flexion posteroanterior (Rosenberg view) radiography, and 3-T magnetic resonance imaging. There were 2 cases excluded because of fracture malunion, which compromised constitutional alignment, while 3 knees that underwent revision surgery were also removed from the study. Additionally, 2 knees that experienced correction loss from trauma-induced fractures within 2 years of osteotomy were excluded. Lastly, 23 cases were omitted because of loss to follow-up within 2 years postoperatively. As a result, the study included a total of 348 knees (320 patients), consisting of 323 cases of MOWHTO, 11 cases of lateral closing wedge DFO, and 14 cases of DLO.
Surgical Procedure
Patients suitable for a surgical intervention typically underwent MOWHTO. When varus alignment originating from the femur was observed, lateral closing wedge DFO was performed. In cases of severe varus accompanied by femoral varus and potential concerns about excessive JLO after HTO alone, DLO was adopted. Preoperative planning for all patients was based on true AP standing scanograms. The correction angle was primarily calculated to achieve 62.5% of the tibial plateau width at the medial border (known as the Fujisawa point) using a line connecting the hip center and ankle center. Slight undercorrection (from 50% to 62.5%) was permitted based on the degree of articular cartilage damage in the medial or lateral compartment observed on magnetic resonance imaging.
MOWHTO was performed in the standard manner. The semitendinosus and gracilis tendons were retracted, and the superficial medial collateral ligament was released distally. In a fully extended position of the knee, a true AP view of the knee joint was obtained under fluoroscopic guidance, and 2 parallel 2.3-mm guide wires were inserted to mark the osteotomy line. Using a radiolucent retractor to protect the posterior neurovascular bundle, main osteotomy was performed along the guide wires up to 1 cm from the lateral cortex, followed by anterior ascending osteotomy to complete biplanar osteotomy. After confirming the planned opening gap, fixation was performed using a TomoFix plate (DePuy Synthes). For the first 6 weeks postoperatively, patients were allowed partial weightbearing with crutch assistance and wore a hinged brace. The range of motion was gradually increased within tolerable limits.
Radiographic Evaluation
We retrospectively reviewed standing scanograms taken just before surgery and at 1 year postoperatively. All lower limb images were standardized to full extension of the knee with the patella facing forward. Radiographic parameters, including the mHKAA, mLDFA, MPTA, and joint line convergence angle (JLCA), were measured. The mLDFA was measured as the angle between the mechanical axis of the femur and the distal femoral articular line, while the MPTA was measured as the angle between the mechanical axis of the tibia and the proximal tibial articular line. The JLCA was determined by the angle between the distal tibia's articular line and the proximal tibia's articular line. Radiographic measurements were conducted by 2 certified orthopaedic surgeons, and the intraclass correlation coefficient for the mLDFA and MPTA between the 2 observers was 0.933 and 0.874, respectively, indicating excellent agreement.
Phenotype Analysis
A study in 2021 first introduced the CPAK classification, defining the neutral alignment boundary at ±2° and calculating arithmetic JLO (aJLO) as the sum of MPTA and mLDFA. 13 However, a study in 2022 identified an error in this calculation in which aJLO was mistakenly doubled. 8 Additionally, the authors found that applying the original CPAK classification to an Asian population resulted in a skewed phenotype distribution because of demographic differences. To address these issues, they proposed a modified CPAK classification, adjusting the neutral alignment boundary to ±3°. 8
Because the participants in this study belong to an Asian population in which the standard deviation of the arithmetic hip-knee-ankle angle (aHKAA) was 2.8°, applying the original CPAK classification would have led to a biased phenotype distribution. Therefore, the modified CPAK classification was adopted as the reference standard to ensure a more accurate phenotype categorization. aHKAA and aJLO were defined as follows:

We divided axial alignment into varus (aHKAA < –3°), neutral (–3°≤ aHKAA ≤ 3°), and valgus (aHKAA > 3°) and JLO into apex distal (aJLO < –3°), apex neutral (–3°≤ aJLO ≤ 3°), and apex proximal (aJLO > 3°), resulting in a total of 9 phenotypes.8,13
Definition of Excessive Postoperative JLO
In previous studies, JLO has been defined as the angle between the ground and the articular surface of the tibia or the Mikulicz joint line angle (MJLA) on scanograms,12,16,22 and the majority suggested acceptable JLO as ≤4°.18,22 The MJLA is a line connecting the center of the hip and the center of the ankle; thus, it remains consistent, regardless of the limb's adduction position. Therefore, we defined the reference for JLO as the angle formed by the MJLA and the tibial articular line, considering a 90° angle as an indication that no JLO has occurred. Assuming that the MJLA is perpendicular to the surface, subtracting 90° from (MPTA + mLDFA)/2 yields the same angle formed between the ground and the tibial articular surface. We defined aJLO as (MPTA + mLDFA)/2 – 90 and excessive postoperative JLO as aJLO >4°.
Statistical Analysis
Descriptive statistics for demographic characteristics were presented using the mean and standard deviation. One-way analysis of variance was utilized to compare continuous variables: age, body mass index, and bone mineral density as well as preoperative and postoperative aHKAA, aJLO, mLDFA, MPTA, and JLCA. The Fisher least significant difference test was employed for post hoc analysis. Scatterplots were drawn to identify the distribution of alignment before and after surgery.
The chi-square test was used to compare the difference in the incidence of excessive postoperative JLO based on radiographic risk factors. In this case, the Bonferroni correction was used for post hoc analysis, which is a nonparametric method.
Receiver operating characteristic (ROC) analysis was conducted to evaluate whether preoperative radiographic parameters were risk factors for excessive postoperative JLO and to determine their cut-off values. The cut-off value was set at the point in which the Youden index (sensitivity + specificity − 1) was maximized. All statistical analyses were performed using SPSS (Version 21.0; IBM). This study was approved by the ethics committee of our institution (No. S2023-1476-0001).
Results
Preoperatively, using the modified CPAK classification, type I (varus and apex distal; n = 149 [42.8%]) was the most common, followed by type IV (varus and apex neutral; n = 89 [25.6%]), type V (neutral and apex neutral; n = 56 [16.1%]), and type II (neutral and apex distal; n = 54 [15.5%]) (Figures 1 and 3). Postoperatively, type VI (valgus and apex neutral; n = 187 [53.7%]) was the most common, followed by type V (n = 98 [28.2%]) and type IX (valgus and apex proximal; n = 39 [11.2%]) (Figures 2 and 3).

Distribution of preoperative phenotypes in patients undergoing osteotomy for primary medial compartmental osteoarthritis. aHKAA, arithmetic hip-knee-ankle angle; aJLO, arithmetic joint line obliquity; DFO, distal femoral osteotomy; DLO, double-level osteotomy; HTO, high tibial osteotomy; mLDFA, mechanical lateral distal femoral angle; MPTA, medial proximal tibial angle.

Distribution of postoperative phenotypes in patients undergoing osteotomy for primary medial compartmental osteoarthritis. aHKAA, arithmetic hip-knee-ankle angle; aJLO, arithmetic joint line obliquity; DFO, distal femoral osteotomy; DLO, double-level osteotomy; HTO, high tibial osteotomy; mLDFA, mechanical lateral distal femoral angle; MPTA, medial proximal tibial angle.
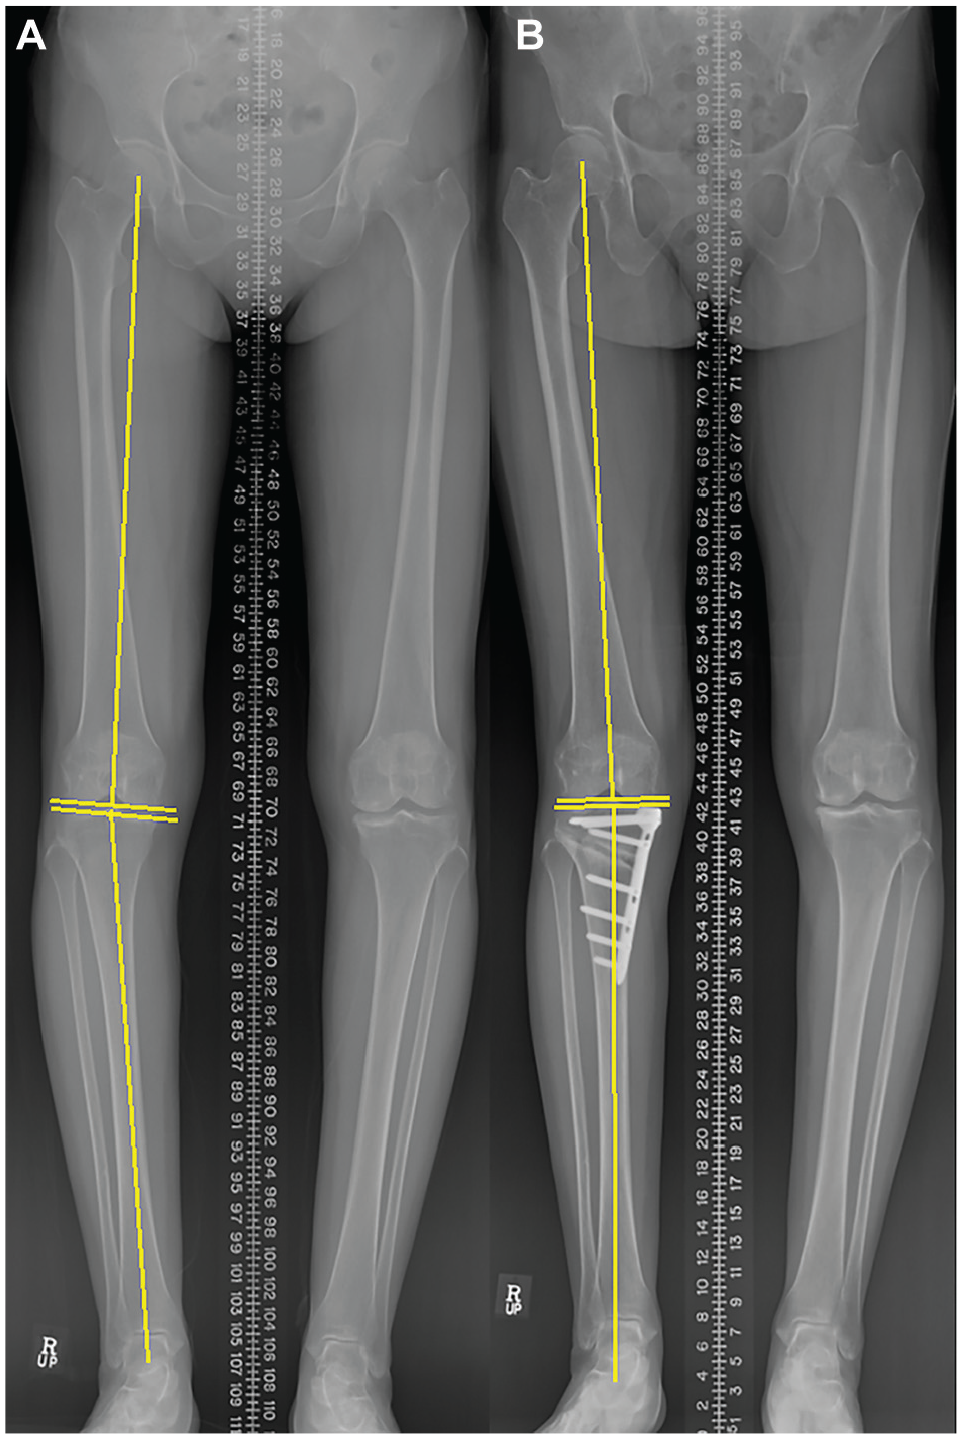
Radiological images demonstrating phenotypic changes after high tibial osteotomy (HTO) in a 57-year-old male patient. (A) Preoperative scanogram showing type I (varus and apex distal). (B) Postoperative scanogram at 1 year showing type VI (valgus and apex neutral).
At the time of surgery, the patients had a mean age of 56.4 ± 7.9 years and a mean body mass index of 26.4 ± 2.8 kg/m2, with no significant difference among the preoperative phenotypes. The mean preoperative mLDFA was 89.0°± 2.1°, and there was a significant difference in the mean mLDFA among the preoperative phenotypes (P < .001), with type IV showing the highest value (91.1°± 1.4°). Additionally, the mean preoperative MPTA was 84.7°± 2.2°, and there was a significant difference in the mean MPTA among the preoperative phenotypes (P < .001), with type I showing the lowest value (83.0°± 1.4°) and type V showing the highest value (88.0°± 1.4°). The mean JLCA also significantly differed by preoperative phenotype, being the lowest in type IV (2.5°± 1.9°) and the highest in type V (3.9°± 2.0°) (Table 1).
Demographic Characteristics, Preoperative Radiographic Parameters, and Postoperative Clinical Outcome Scores by Preoperative Phenotype a

Data are reported as No. or mean ± SD. aHKAA, arithmetic hip-knee-ankle angle; aJLO, arithmetic joint line obliquity; DFO, distal femoral osteotomy; DLO, double-level osteotomy; HTO, high tibial osteotomy; JLCA, joint line convergence angle; mHKAA, mechanical hip-knee-ankle angle; mLDFA, mechanical lateral distal femoral angle; MPTA, medial proximal tibial angle.
In knees undergoing DFO or DLO, excessive postoperative JLO did not occur in any cases. However, in the group undergoing HTO, 17 cases (5.3%) had excessive postoperative JLO. The incidence of excessive postoperative JLO varied significantly among preoperative phenotypes (P < .001). Among knees that underwent isolated HTO, type IV (14.5%) and type V (10.4%) exhibited the highest rates of excessive postoperative JLO (Table 2).
Incidence of Excessive Postoperative JLO by Preoperative Phenotype a

Data are reported as n (%). DFO, distal femoral osteotomy; DLO, double-level osteotomy; HTO, high tibial osteotomy; JLO, joint line obliquity.
The postoperative mHKAA did not show significant differences among preoperative phenotypes (P = .208). However, the postoperative aJLO significantly varied among preoperative phenotypes (P < .001), with type IV showing the highest value (1.7°± 2.3°) (Table 3).
Postoperative Radiographic Parameters After HTO Alone by Preoperative Phenotype a
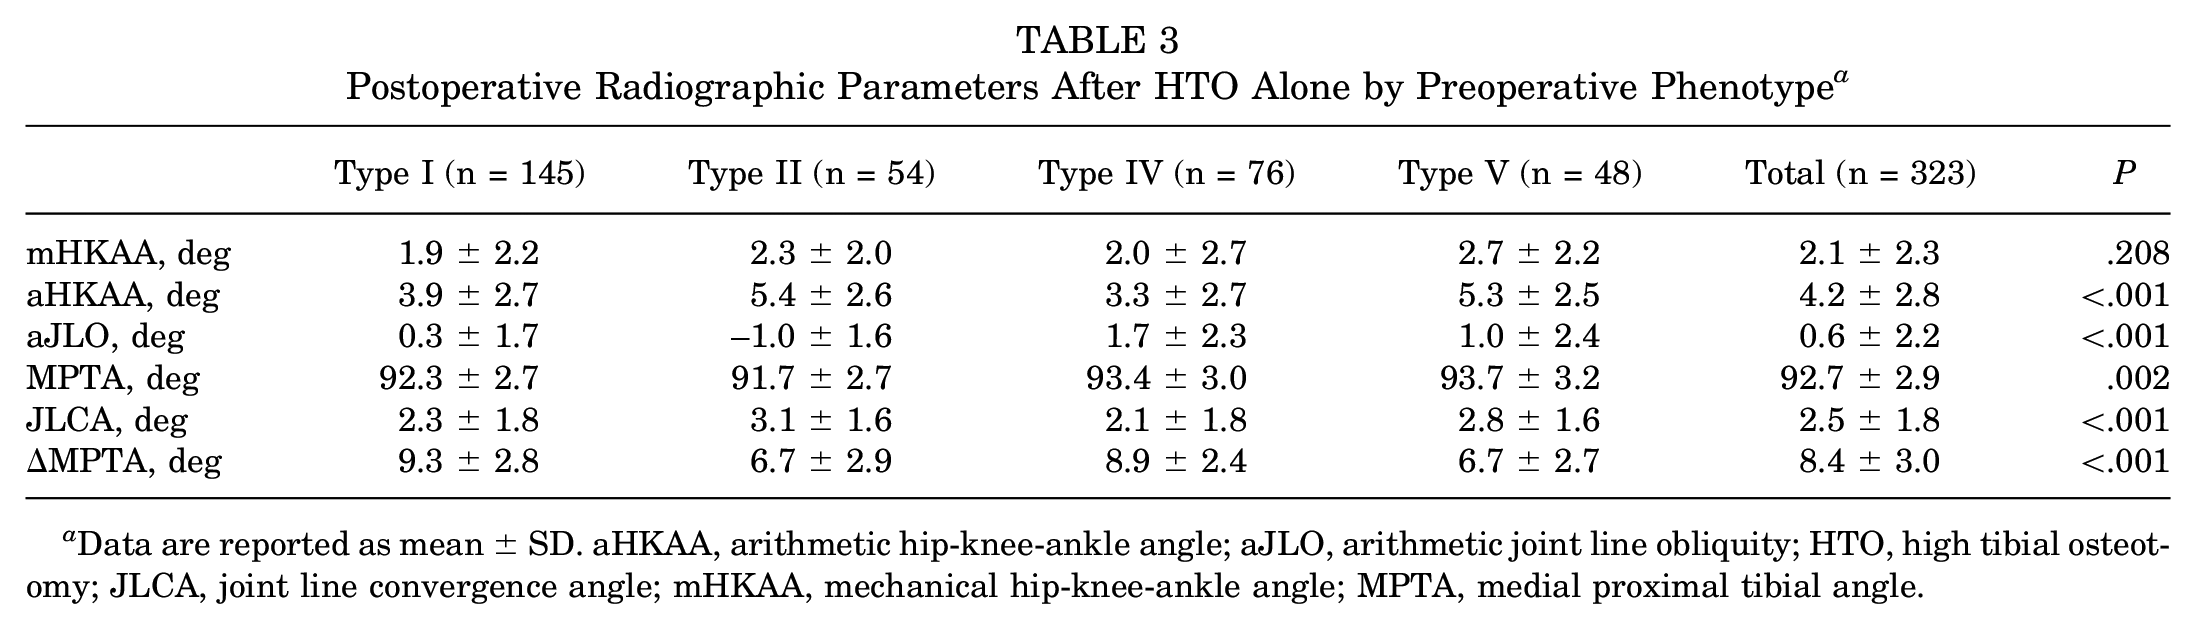
Data are reported as mean ± SD. aHKAA, arithmetic hip-knee-ankle angle; aJLO, arithmetic joint line obliquity; HTO, high tibial osteotomy; JLCA, joint line convergence angle; mHKAA, mechanical hip-knee-ankle angle; MPTA, medial proximal tibial angle.
In the group that underwent isolated HTO, ROC analysis for the risk of excessive postoperative JLO demonstrated excellent diagnostic ability. The area under the curve (AUC) for preoperative mLDFA and aJLO was 0.916 and 0.914, respectively. The cut-off values for preoperative mLDFA and aJLO were 90.2° and −1.5°, respectively (Figure 4). In ROC analysis based on the postoperative MPTA, the AUC for postoperative MPTA was 0.976 with a cut-off value of 95.4°. The AUC for preoperative aHKAA, mHKAA, JLCA, and MPTA was 0.460, 0.387, 0.679, and 0.787, respectively.

Receiver operating characteristic (ROC) analysis for the occurrence of excessive postoperative joint line obliquity (JLO) based on the preoperative mechanical lateral distal femoral angle (mLDFA) and arithmetic JLO (aJLO) after high tibial osteotomy (HTO) alone. (A) Area under the curve (AUC) and cut-off value for preoperative mLDFA. (B) AUC and cut-off value for preoperative aJLO. MPTA, medial proximal tibial angle.
The incidence of excessive postoperative JLO after isolated HTO was significantly higher in the preoperative mLDFA ≥90.2° group than in the preoperative mLDFA <90.2° group (19.8% vs 0.4%, respectively; P < .001). Similarly, the incidence of excessive postoperative JLO was significantly higher in the preoperative aJLO ≥–1.5° group than in the preoperative aJLO <–1.5° group (35.1% vs 1.4%, respectively; P < .001) (Table 4).
Incidence of Excessive Postoperative JLO After HTO Alone by Preoperative mLDFA and aJLO a

Data are reported as n (%). aJLO, arithmetic joint line obliquity; HTO, high tibial osteotomy; JLO, joint line obliquity; mLDFA, mechanical lateral distal femoral angle.
In the subgroup analysis for patients with a postoperative MPTA ≥95.4°, the incidence of excessive postoperative JLO after isolated HTO was significantly higher in the preoperative mLDFA ≥90.2° group than in the preoperative mLDFA <90.2° group (44.4% vs 2.4%, respectively; P < .001). Similarly, the incidence of excessive postoperative JLO was significantly higher in the preoperative aJLO ≥–1.5° group than in the preoperative aJLO <–1.5° group (65.0% vs 6.9%, respectively; P < .001).
Discussion
This study found that most of the patients who underwent realignment osteotomy for varus-aligned medial osteoarthritis maintained a horizontal joint line even after surgery. However, in cases of type IV, the risk of excessive postoperative JLO was significantly higher compared with other types. Specifically, in cases in which preoperative femoral varus was present (mLDFA ≥90.2°) or with a preoperative horizontal joint line (aJLO ≥–1.5°), there was a high risk of excessive postoperative JLO after HTO alone.
The most common phenotype in the preoperative distribution was type I. To reduce selection bias in analyzing the distribution of preoperative phenotypes, we included all cases of medial osteoarthritis that underwent realignment osteotomy, including DFO and DLO. Also, the distribution was similar to that observed in previous studies targeting the Asian population.8,23,24
In the distribution of postoperative phenotypes, the most common was type VI, and for the majority, JLO was horizontal even after surgery. Considering that femoral osteotomy was performed in <10% of the total cases (n = 25 [7.2%]), it was observed that in most patients, maintaining a horizontal joint line and correcting alignment could be achieved with HTO alone.
In the case of type IV, the incidence of excessive postoperative JLO was significantly higher compared with other types after HTO alone. Analyzing the radiographic measurements, it was hypothesized that the characteristic features of type IV, femoral varus and constitutional horizontal joint line, could be risk factors for postoperative JLO. We demonstrated this through ROC analysis and provided threshold values.
In several previous studies, it has been reported that JLO can occur with large-correction HTO, especially when the postoperative MPTA is ≥95°.2,6 Also, in this study, ROC analysis revealed that the cut-off value for postoperative MPTA for the risk of excessive postoperative JLO was 95.4°. However, in the group with a postoperative MPTA ≥95.4°, the incidence of excessive postoperative JLO was rare when the preoperative mLDFA was <90.2° or the preoperative aJLO was <–1.5° (2.4% and 6.9%, respectively). To prevent excessive postoperative JLO, it is important to consider not only the postoperative MPTA but also the preoperative phenotype. Notably, this study found that patients who developed excessive postoperative JLO exhibited characteristics consistent with type IV in which femoral varus was present while JLO remained neutral. Therefore, if a patient is classified as type IV preoperatively and has an mLDFA ≥90.2°, this suggests the need for DFO or DLO rather than HTO alone.
Few studies have reported the correlation between preoperative mLDFA and postoperative JLO.7,11 Yet, this study had a larger sample size compared with previous studies and provided threshold values for the risk of postoperative JLO through ROC analysis, making it a strength compared with previous studies.
The limitations of this study include a short follow-up period. Although we included 1-year postoperative Hospital for Special Surgery and Lysholm scores, we found no significant differences between preoperative type IV, which was expected to have a higher likelihood of developing excessive JLO postoperatively, and other types. Therefore, we aimed to indirectly compare outcomes by using a cut-off value for JLO of >4° as the primary outcome, as suggested by previous literature as a clinically significant threshold.
Additionally, this study analyzed postoperative JLO using the CPAK classification, incorporating aJLO, which differs from previous studies. Thus, JLCA was not considered as a factor. However, the mean JLCA deviation for each type was <1°. We believe that the influence of JLCA on each type was therefore minimal, validating our phenotype analysis of the postoperative JLO risk. Future research is planned to further investigate the effect of JLCA on the phenotype distribution.
Conclusion
Preoperative type IV (varus and apex neutral) had a higher risk of excessive postoperative JLO. Specifically, when the preoperative mLDFA was ≥90.2° or the preoperative aJLO was ≥–1.5°, there was an increased risk of excessive postoperative JLO after isolated HTO.
Footnotes
Final revision submitted March 4, 2025; accepted March 17, 2025.
The authors have declared that there are no conflicts of interest in the authorship and publication of this contribution. AOSSM checks author disclosures against the Open Payments Database (OPD). AOSSM has not conducted an independent investigation on the OPD and disclaims any liability or responsibility relating thereto.
Ethical approval for this study was obtained from the University of Ulsan College of Medicine (No. S2023-1476-0001).