
Abstract
Background:
Walking in minimalistic footwear (MF) increases mechanical loading on the knee joint, exposing it to acute stresses that may heighten the risk of early onset of knee osteoarthritis. This type of footwear can modify walking patterns in the lower limbs, further intensifying joint stress and contributing to the deterioration of articular surfaces.
Purpose:
First, to evaluate the differences in kinetic variables associated with the early onset of knee osteoarthritis between MF and neutral footwear (NF) during walking; second, to determine the extent of acute cartilage loading in the knee joint, particularly footwear after 45 minutes of walking in an urban environment, using magnetic resonance imaging (T2 relaxation times [T2RTs] and percentage change of loading) in weightbearing zones.
Study Design:
Controlled laboratory study.
Methods:
Knee forces and knee moments were obtained during walking trials of 20 healthy participants using statistical parametric mapping. The analysis focused on alterations across specific intervals of the stance phase, expressed as percentages of the gait cycle. T2RT values of cartilage were quantified using a 1.5 T magnetic resonance imaging at baseline and immediately after 45 minutes of walking in each condition.
Results:
Significant differences were observed in knee force during the stance phase: (1) in the sagittal plane, greater values were between 2% and 9% and between 90% and 100%, and lower values were between 18% and 40% and between 62% and 85% in MF; (2) the frontal plane showed lower values between 7% and 14% and 98% in MF, and greater values were between 7% and 14% and 98% in MF; and (3) the transversal plane showed greater values between 0% and 9% and between 54% and 78%, and lower values were between 25% and 40% and between 81% and 100% in MF. Knee adduction moment showed significantly lower values between 0% and 8%, 32% and 90%, and >92% and 100%. Knee flexion moment showed significantly lower values between 3% and 5%, 25% and 69%, and >7% and 19% in MF. The main effect of loading in NF of cartilage showed significantly lower T2RT values in all superficial femur parts and significantly greater T2RT values in deep central tibia. MF showed significantly lower T2RT values in the superficial anterior-posterior femur in the medial cartilage compartment.
Conclusion:
Increased knee moments in all planes reflect the effect of an acute change to particular footwear. NF reveals a greater response to loading in weightbearing knee cartilage zones. The superficial layers appeared to be more sensitive to loading after 45 minutes of walking.
Osteoarthritis (OA) is a degenerative disease that primarily affects the cartilage of the weightbearing joints. 33 OA is characterized by joint pain, stiffness, crepitus, decreased range of motion, and the formation of osteophytes, often accompanied by joint tenderness, effusion, and deformity. 40 There are several screening methods to reveal the early stages of OA (conventional radiography, magnetic resonance imaging [MRI], ultrasound, scintigraphy, and tomography). MRI has been developed as a noninvasive diagnostic tool for the evaluation of degenerative or traumatic lesions in articular cartilage and has been confirmed as the gold standard of screening methods. 14 Together with biomechanical analysis, MRI provided more detailed information regarding the loading of the knee joint. Although these advanced methods for assessing joint function are available, there remains no effective treatment or approach to slow the progression of OA.
The knee joint has been shown to be the most affected area by OA 29 because of its weightbearing function and exposure to significant mechanical stress during daily activities such as walking, standing, and stair climbing. 9 The absence of a footwear midsole could increase mechanical loading that may have negative consequences on the knee joint during walking. 13 The mechanical stresses of walking exert significant loads on the knee medial compartment, specifically the medial tibia, medial femur, and the posterior femur. 48 These loads may be reduced by barefoot walking, 38 which has been cited as a natural human movement. 10 However, it is impractical to walk barefoot in the modern urban environment, and people have adapted to walking in closed footwear. 44 On the other hand, footwear positively influences the absorption of impact forces during loading on the urban hard surfaces. 18 To return as much as possible to natural walking, footwear companies have started to focus on producing different types of footwear with minimal soles called minimalistic footwear (MF). 11
From the biomechanical perspective, one of the most common parameters that could affect the incidence and risk of OA is the knee adduction moment (KAM) and the knee flexion moment (KFM). 51 These parameters are indicators of compression load in the frontal and sagittal plane and may be predictors of the presence 8 and progression of knee OA. 26 Other biomechanical parameters that appear to be associated with knee OA include elevated ground-reaction forces and increased propulsion forces. 23 Previous research focused on the KAM peak, impulse, and magnitude (values along the curve at any given time) and indicated that the rate of the KAM magnitude was the most sensitive biomechanical parameter associated with OA and correlated with degeneration in the medial knee cartilage. 20 Studies that compared neutral footwear (NF) and MF found a greater vertical ground-reaction force component (vGRF) in MF compared with NF, which could potentially increase the risk of early onset of knee OA in MF.15,16 However, they did not consider the loading on knee cartilage, which has been shown as a risk factor for the early onset of OA. 23
From the perspective of MRI, a common quantitative assessment of knee articular cartilage, the T2 relaxation time (T2RT) values are obtained by MRI-derived T2 maps. 42 Changes in T2RT after loading reflect changes in water content and orientation of collagen fibers in the extracellular matrix.21,22 These changes are often correlated and attributed to the first indicators of knee cartilage degeneration and the development of OA. 49 Thus, specifically, elevated T2RT values are one indicator of an OA risk factor. 28 A more thorough understanding of the changes within the cartilage of the knee joint is aided by the division of cartilage into the deep, superficial, and bulk layers. 49 T2RT is reduced under mechanical loading in human cartilage specimens (but areas of prolongation within an articular surface can be found),4,30,36 and the superficial layer is more sensitive to loading than the other cartilage layers. 9 After walking, T2RT decreased in the medial and lateral central tibia, with greater changes observed in the superficial layers compared with the deep layers, and in the medial cartilage compared with the lateral cartilage. 9 Under static loading of the knee, T2RT decreased in the medial central femur, and medial and lateral tibia 31 ; decreased in the medial joint 41 and the superficial layer; and increased in the deep layer. 40 Finally, T2RT decreased in load-bearing areas but increased in regions adjacent to load-bearing areas. 46
This study aimed to evaluate the effects of different types of footwear on key kinetic variables influencing knee cartilage loading during walking, and their relationship with changes in cartilage homeostasis as reflected by T2RT. First, it was hypothesized that walking in MF would show significantly greater values in all noted knee joint kinematic parameters compared with NF. Second, it was hypothesized that T2RT values would show significantly decreased T2RT values in each footwear in the superficial layer after 45 minutes of walking. Third, it was hypothesized that walking in MF would show a greater effect of acute compressive loading in T2RT in the weightbearing zones compared with NF.
Methods
Study Population
To detect true differences, the sample size was calculated to be 20 participants using GPower 3.1 software, 7 with an alpha of .05 and a beta of 0.95. The estimated sample size calculations were based on differences between unloaded and loaded T2RT values in the posterior part of the medial tibia after 30 minutes of walking. 9 A group of 20 volunteers, including 9 men and 11 women (mean height, 173.70 ± 0.07 cm; mean body mass, 67.65 ± 8.75 kg/m2; mean age, 28.81 ± 4.98 years; BMI, 22.42 ± 2.50 kg/m2), were recruited to participate in this study. All volunteers were selected among young adults (age range: 18-36 years) because of the low incidence of knee OA and increased interest in MF within this age group. The group of participants consisted of students and working people who previously performed sports at a recreational level no more than 5 times a week. This physical activity can be considered moderate, which was previously shown to have positive effects on knee cartilage health. 3 Eligibility criteria required participants to have no previous injury to the lumbar spine, knee pain, knee surgery, or any other lower extremities issues.
All participants were asked to sign an informed consent form approved by the institutional review board of our university (ID: OU-53107/45-2022). As part of the study, participants were fully informed about the procedures, gave written consent for participation, and did not have any contraindications to undergoing MRI.
MRI and Biomechanical Measurements
The MRI measurements in each footwear condition were performed separately on 2 different days. Participants underwent scans before and immediately after 45 minutes of walking in 2 footwear conditions—MF and NF. The walking time was established based on the recommendation of the Arthritis Foundation guidelines for well-being, which recommend 30 to 60 minutes of walking 3 to 5 days per week. 5 The order of conditions was randomized by using a research randomizer for both MRI and biomechanical examination. 45 Participants performed walking in MF (minimalistic index: 96%, indicating the percentage of barefoot conditions, which is established to be 100%). The MF was Primus Knit (Vivobarefoot Ltd), and the NF (minimalistic index: 28%) was a Brooks Launch 5 shoe (Brooks Sport Inc). The walking route and their distance were monitored by a smartwatch, Fitbit Charge 3 (Fitbit Inc), to maximize step equality in both conditions. All measurements were collected in the morning between 6:00 and 9:00 am to minimize the potential diurnal effect on the cartilage T2RT values. Participants were instructed not to do any physical activity 24 hours before the prewalking scan day and were instructed to have 15 minutes of rest in the sitting position before positioning for the scan. After these 15 minutes, the participant was positioned feet first in the supine position on the bed of the MRI scanner. The total MRI scanning time was approximately 10 minutes (Table 1).
Sequence Parameters for MRI Quantification a

FS, fat-suppressed; MRI, magnetic resonance imaging; PD, proton density; TSE, turbo spin-echo.
The right knee joint was placed in a 12-channel knee coil in an isocentric position. The upper edge of the coil was marked with a black highlighter on the participant’s skin to achieve a maximally identical knee joint position after walking. Scans of right knee cartilage were acquired with a 1.5 T Siemens Magnetom Sempra Scanner (Siemens) using a 12-channel transmit/receive knee coil while participants were lying supine with the semi-flexed knee.
After the MRI protocol, a biomechanical analysis of walking trials was performed. Retroreflective markers were bilaterally attached to participants using a customized lower extremity and foot model. 24 After several minutes of adjusting to the specific footwear conditions and completing the standing calibration trial, participants underwent separate walking trials in the 2 different conditions (both conditions in 1 day). The starting point was marked by a small red cone positioned 5 meters before the first force plate. The participants were asked to pay close attention to the yellow line on the ground. This line was approximately 5 meters away from the force plates on the other side of the walkway. Participants were encouraged to walk at a self-selected speed in the range of previously reported 19 regular walking speed of 1.45 m·s−1± 5%. The walking trial was successful when the participant contacted the first force plate with the right foot at the correct approach speed. Each footwear condition (MF and NF) required 8 successful trials.
MRI Data Analysis
Each MRI scan was manually analyzed using a segmentation and analysis tool developed in MATLAB (Mathworks Inc). A single reader, blinded to morphological findings, manually segmented T2-weighted knee cartilage images (J.M., supervised by V.C.). A total of 768 slices were analyzed, 3 slices from the central part of the lateral femur and tibia condyle, and 3 slices from the central part of the medial femur and tibia condyle for all participants. The knee cartilage was divided into 17 regions of interest (ROIs) based on MATLAB software (MathWorks Inc). However, only 8 of the most weightbearing ROIs (Figure 1) were selected for further analysis in accordance with a previous study. 39 T2RT maps were generated by fitting a 2-parameter monoexponential decay function to signal intensities on a pixel-by-pixel basis. For each ROI, the mean T2RT values were calculated for all voxels of the superficial and deep layers of cartilage based on the mean of the 3 consecutive slices, weighted by the number of pixels (Figure 1). To assess the difference between loaded and unloaded mean T2RT values (ΔT2RT) in each footwear condition, the following equation was used:


Knee cartilage regions and zones: aCF, anterior central femur; aPF, anterior posterior femur; CF, central femur; CT, central tibia; daCF, deep anterior central femur; daPF, deep anterior central femur; dCT, deep central tibia; dpCF, deep posterior central femur; pCF, posterior central femur; saCF, superficial anterior central femur; saPF, superficial anterior posterior femur; sCT, superficial central tibia.
To determine the intrareader reliability, 5 knee cartilages were randomly selected and manually segmented 3 times for each ROI for medial and lateral parts, with an interval of 5 days. According to the scale for each of our ROIs, the root-mean-square error coefficient of variation was determined 6 as very good (<5%).
Biomechanical Data Analysis
The raw kinematic and kinetic data processing was performed in QTM (Track Manager; Qualisys) and Visual3D software (C-Motion). A fourth-order Butterworth, low-pass filter with a cutoff frequency of 40 Hz (kinetic) was used for filtering overground walking trials. 17 The mean values of dependent variables for each participant were determined from the first step of 8 walking trials for each condition.
Kinetic variables were obtained from 3-dimensional knee net moments and selected loading characteristics (sagittal plane anterior-posterior force, KFM; frontal plane adduction moment, mediolateral force, and transverse plane vGRF). All dependent variables curves were normalized into 101 points (0%-100% stance phase) for statistical parameter mapping (SPM) analysis.
Statistical Analyses
A Shapiro-Wilk test was performed to test the normality of all data. Means and standard deviations were determined to describe study population characteristics, MRI, kinetic, and step frequency parameters. In the case of non-normal data distribution, the values were reported as medians and interquartile ranges. Continuous gait parameters were analyzed in MATLAB Version R2017a (Mathworks Inc) using a 1-dimensional Statistical Parametric Mapping (SPM) method. 34 All SPM analyses were conducted with a custom-written Matlab script using the open-source software package spm1D 0.4 (www.spm1d.org). Forces and moments were evaluated as functions of the progression of the stance phase, expressed as percentages of the stance phase duration (0%-100%), to identify biomechanical variations across footwear conditions. The main effects of footwear in SPM analysis were analyzed using a parametric t test 35 to assess the effect of loading and the difference in step frequencies between footwear conditions. A 2-way repeated-measure analysis of variance was performed to assess the interaction between the influence of loading and the effect of footwear. The critical threshold for statistical significance in the initial analysis was set at α = .05.
Results
The difference in step frequencies between footwear conditions was not significantly different (P = .439; MF: 4639.79 ± 499.85 steps/45 min; NF: 4670.21 ± 674.20 steps/45 min).
Figure 2A presents an SPM analysis of right knee kinetics between MF and NF during the stance phase of walking. There was a significantly lower anterior-posterior force in the sagittal plane in the first contact with the ground (P = .05) after significantly greater values between 2% and 9% (P = .003), lower values between 18% and 40% (P < .001), 62% and 85% (P < .001), and greater values between 90% and 100% (P < .001) in MF compared with NF during the stance phase. Figure 2B presents an SPM analysis of knee kinetics between MF and NF in the stance phase in the frontal plane. The t test revealed significantly lower values in 5% (P < .037), between 39% and 45% (P < .001), and between 86% and 92% (P < .001) in MF. On the contrary, significantly lower values were observed in NF between 7% and 14% (P < .001) and in 98% in MF (P = .043). Figure 2C presents an SPM analysis of knee kinetics between MF and NF in the stance phase in the transversal plane. MF showed significantly greater values than NF between 0% and 9% and between 54% and 78% (P < .001, both), and significantly lower values in MF compared with NF between 25% and 40% and between 81% and 100% (P < .001, both) of the stance phase.

SPM of the right knee force during the stance phase in the (A) sagittal plane, (B) frontal plane, and (C) transversal plane. The top plot symbolizes the mean and standard deviation of the stance phase for MF and NF. The bottom plot represents the curve of the t test showing the main effect between the 2 footwear conditions (SPM {t}). The critical threshold was set at α≤ .05 (dashed red line). MF, minimalistic footwear; NF, neutral footwear; SPM, statistical parameter mapping.
Figure 3A presents an SPM analysis of the KAM between MF and NF during the stance phase. The statistical analysis showed significantly lower values in MF compared with NF between 0% and 8% (P = .022) and between 32% and 90% (P < .001), and greater values in the stance phase between 92% and 100% in MF (P = .007). The last set of biomechanical analyses included a comparison of KFM between MF and NF during the stance phase (Figure 3B). Comparing MF and NF, these results showed a significantly lower value of MF immediately after the first peak between 3% and 5% (P = .026) and between 25.5% and 69.5% (P < .001), and a significantly greater value between 7% and 19% in MF (P < .001).

SPM of the right knee adduction moment in the (A) stance phase and (B) right knee flexion moment in the stance phase. Curves in the upper part of the figure symbolize the mean and standard deviation of the stance phase. The curve of the t test showing the main effect between the 2 footwear conditions (MF and NF) is located in the lower part of the figure (SPM {t}). The critical threshold was set at α≤ .05 (dashed red line). MF, minimalistic footwear; NF, neutral footwear; SPM, statistical parameter mapping.
The first set of MRI analyses includes unloaded and loaded T2RT values measured in knee cartilage before and after 45 minutes of walking in MF and NF, and their interaction in the medial cartilage compartment (Table 2). There was no significant interaction between loading and footwear conditions. However, we found a significantly greater loaded T2RT values in the main effect of footwear in MF in the superficial anterior-posterior femur (P < .002; d = −0.346) on the medial cartilage compartment. The significant differences in the main effect of loading in superficial anterior central femur (P = .001; d = −0.770), superficial posterior central femur (P < .001; d = −0.785), superficial anterior posterior femur (P < .001; d = 0.435), superficial central tibia (P = 0.011; d = 0.399), and the deep central tibia (P = .01; d = −0.513) were observed after 45 minutes of walking in the medial cartilage compartment.
Quantitative Analysis of Selected T2RT Parameters in the Medial Compartment of the Cartilage Under Different Footwear Conditions a
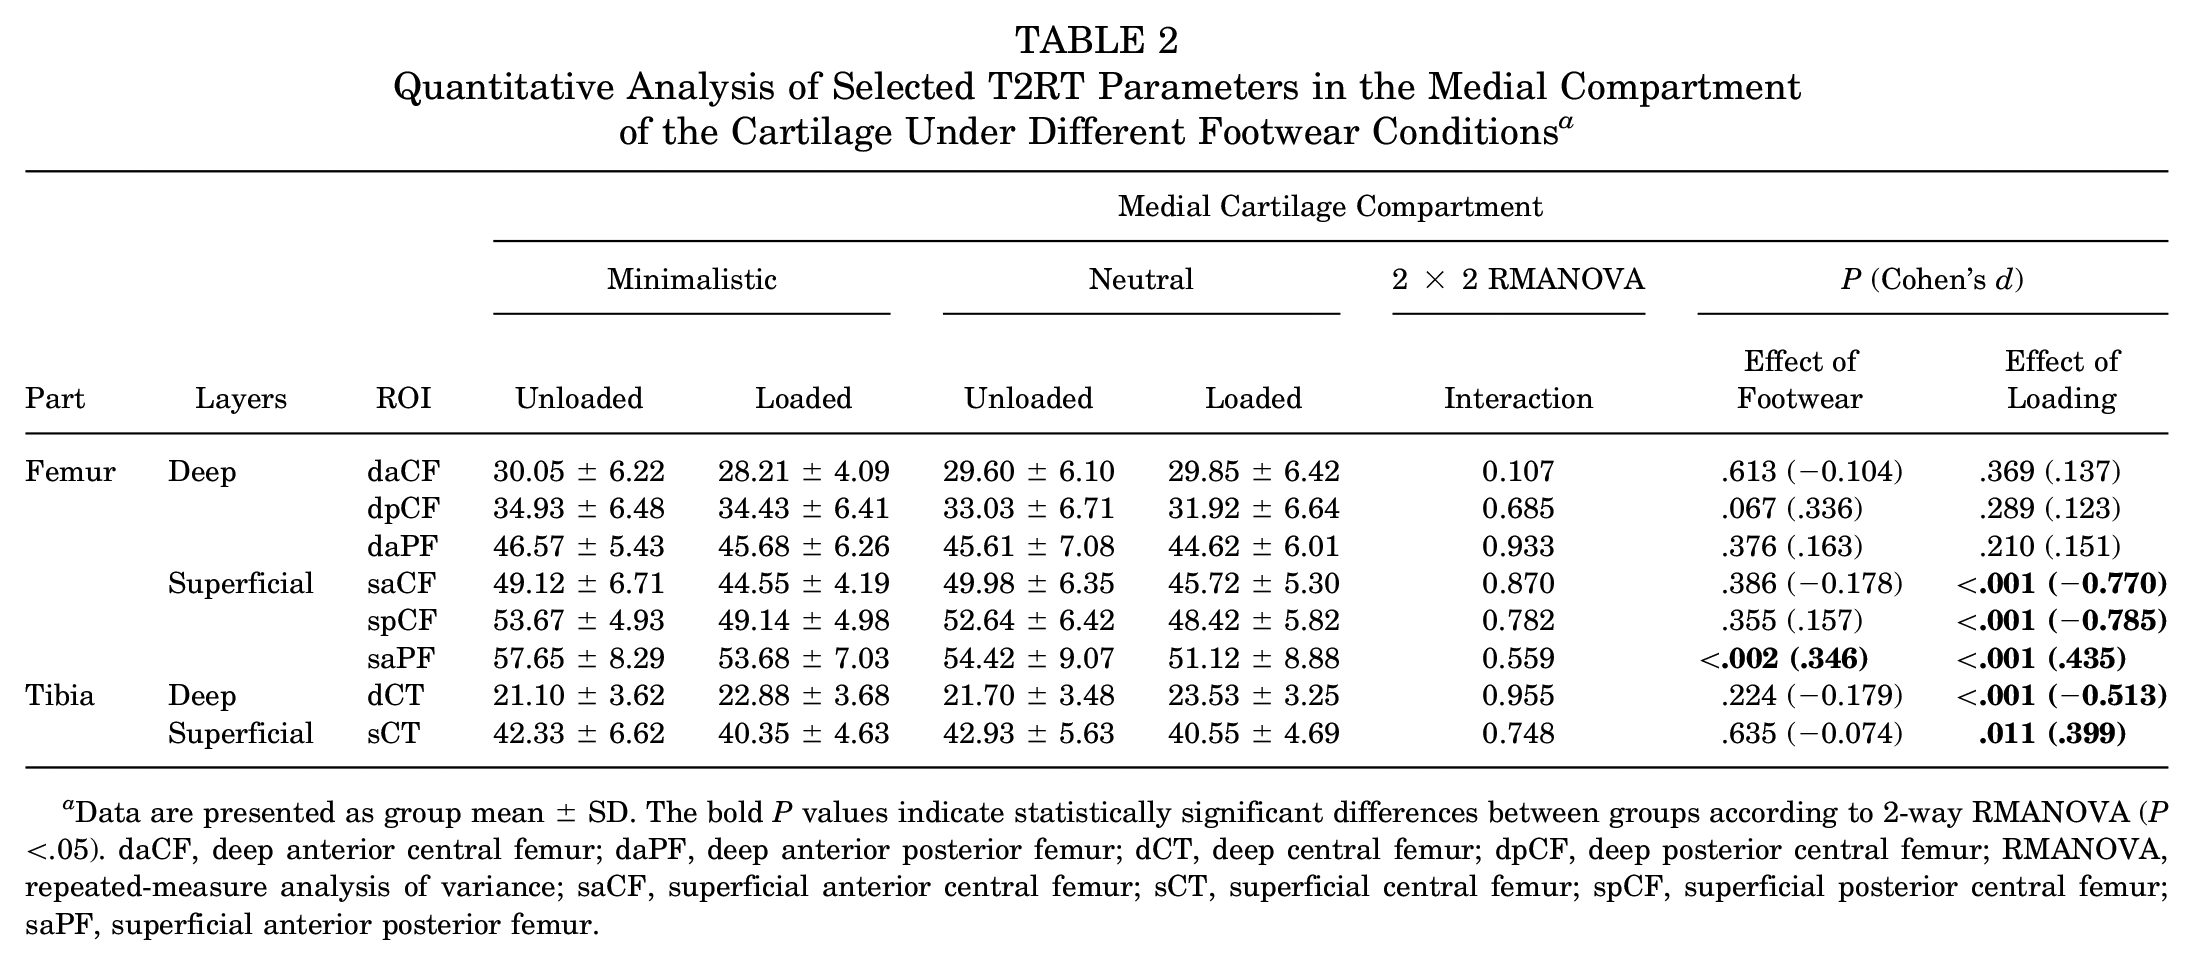
Data are presented as group mean ± SD. The bold P values indicate statistically significant differences between groups according to 2-way RMANOVA (P <.05). daCF, deep anterior central femur; daPF, deep anterior posterior femur; dCT, deep central femur; dpCF, deep posterior central femur; RMANOVA, repeated-measure analysis of variance; saCF, superficial anterior central femur; sCT, superficial central femur; spCF, superficial posterior central femur; saPF, superficial anterior posterior femur.
The second set of MRI analyses includes unloaded and loaded T2RT values measured in knee cartilage before and after 45 minutes of walking in MF and NF, and their interaction in the lateral cartilage compartment (Table 3). Similar to the medial compartment, there was no significant interaction between loading and footwear conditions in the lateral compartment as well. The results showed a significant differences in the main effect of loading in the superficial anterior central femur (P < .001; d = −0 to 0.327), superficial posterior central femur (P < .001; d = −0.615), superficial anterior posterior femur (P= .007; d = 0.374), superficial central tibia (P < .001; d = 0.524), and deep central tibia (P = 0.001; d = −0.442) after 45 minutes of walking.
Quantitative Analysis of Selected T2RT Parameters in the Lateral Compartment of the Cartilage Under Different Footwear Conditions a

Data are presented as group mean ± SD. P values indicate statistically significant differences between groups (P < .05). daCF, deep anterior central femur; daPF, deep anterior posterior femur; dCT, deep central femur; dpCF, deep posterior central femur; RMANOVA, repeated-measure analysis of variance; saCF, superficial anterior central femur; saPF, superficial anterior posterior femur; sCT, superficial central femur; spCF, superficial posterior central femur; T2RT, T2 relaxation time.
The third set of MRI analyses examined the ΔT2RT values of 45 minutes of walking between footwear conditions (Table 4). The ΔT2RT results in MF showed the greatest negative change in the deep central tibia part of the cartilage, followed by positive significant changes in the superficial posterior part of the cartilage, the anterior central femur, and the superficial anterior posterior femur (P < .05). The lateral part of the cartilage showed the greatest positive significant change in the superficial posterior central femur and a negative significant change in deep centra tibia (P < .05). The ΔT2RT of the NF in the medial part of cartilage showed the greatest negative value in deep central tibia (P < .05). The lateral part of the cartilage showed also greatest negative values in deep central tibia and positive value in superficial anterior central, posterior central femur, and superficial anterior posterior parts of the femur (P < .05). In other ROIs, the ΔT2RT values were in the range of ± 5% in both footwear conditions. There were no significant differences in ΔT2RT of 45 minutes of walking between the footwear conditions in the lateral and medial cartilage compartments.
Quantitative Analysis of Selected MRI Parameters of Loading Between Footwear Conditions a

Data are presented as group mean ± SD. P values indicate statistically significant differences between groups according to RMANOVA (P <.05). daCF, deep anterior central femur; daPF, deep anterior posterior femur; dCT, deep central femur; dpCF, deep posterior central femur; RMANOVA, repeated-measure analysis of variance; ROI, region of interest; saCF, superficial anterior central femur; saPF, superficial anterior posterior femur; sCT, superficial central femur; spCF, superficial posterior central femur; T2RT, T2 relaxation time.
Discussion
This study aimed to determine the effects of different types of footwear on key kinetic variables influencing knee cartilage loading during walking and their relationship to changes in cartilage homeostasis as reflected by T2RT.
First, it was hypothesized that walking in MF would show significantly greater values in knee joint kinetics parameters compared with NF. It was observed that, in knee force in the frontal plane, when comparing the time profiles of MF and NF, there was a time shift at the beginning of the stance phase (see Figure 2B) as well as in the sagittal plane. To our knowledge, the only study comparing walking in a different type of footwear in terms of SPM analysis is our previous study, which showed the same trend in the resulting curves. 25 Nevertheless, one of the possible explanations of this finding is that the absence of a cushioned sole in MF influences the timing of the first peak of the GRF. 32 Results from sagittal and frontal planes were supported by the vGRF peak in MF, which occurred earlier in the stance phase compared with NF. This was probably because of the faster transfer of the impact from the initial contact with the ground due to the absence of a cushioned sole. However, the footfall pattern was similar because of the acute effect of footwear conditions (MF and NF). From this point, we can conclude that the GRF results do not support our hypothesis. Greater GRF in all planes in the first 10% of the stance phase could indicate a higher risk of early onset knee OA from an MF perspective. 23 These kinetic results in MF could theoretically increase the risk of plantar fasciitis and other musculoskeletal microtraumas during faster walking without any changes in walking pattern, which could lead to earlier development of OA. 43
Even though GRFs suggest lower NF loading of the knee joint (except the first 10% of the stance phase), on the contrary, the adduction moment and flexion moment of the knee joint have been marked as the key factors influencing the development of knee cartilage OA. 51 Time shift loading was also demonstrated for KFM, where the shift resulted in an opposite greater load during NF walking. Based on previous cross-sectional studies that reported less knee flexion at heel strike and greater KFM in midstance as risk factors for OA, walking in NF in terms of KFM would pose a higher risk of knee OA development.12,23
The results related to the KAM represent the most significant and compelling finding in our biomechanical analysis. This measure provides crucial insights into the loading dynamics of the knee joint, highlighting its potential implications for understanding the progression of the onset of knee OA. Here, there was a significantly greater loading of 65% to 100% for NF during the stance phase of walking. These greater values were particularly evident in the early and midstance, which supports the findings from earlier cross-sectional studies.16,25 This result points to probably the main biomechanical variable that correlates with T2RT values and most influences knee cartilage loading, thus explaining the changes in T2RT in our study.
Second, it was hypothesized that T2RT values would significantly decrease in the superficial layer after 45 minutes of walking in various footwear, reflecting the deformation of collagen fibers and water loss because of their positive correlation with T2RT values. 41 The superficial layer, known to be more compliant than the deeper zones, showed notable sensitivity to loading, with significant decreases observed in the anterior-posterior femur and central tibia, particularly in the medial knee compartment. These findings were further supported by decreases in other ROI, such as the anterior central femur and superficial central tibia. Deep layers showed significant increases in T2RT values in the central tibia for the NF condition, further supporting the idea that superficial layers are more compliant under mechanical loading. 9 Interestingly, despite the NF condition having a higher sole, which could theoretically absorb more load, there was still a significant decrease in T2RT values observed in both lateral and medial compartments of the knee cartilage, both in superficial and deep layers. This may be explained by differences in walking patterns, with a more cautious gait in MF footwear and biomechanical factors like KAM contributing to these observations. These results are consistent with earlier studies that found decreased T2RT in the medial central femur and tibia after static knee loading, 31 supporting the view that the medial part of the cartilage is more sensitive to load and susceptible to OA development. 2 However, some studies, particularly treadmill-based, 9 reported different findings, which may be due to the controlled, ecological walking environment and specific footwear conditions in our study. Previous research has emphasized the role of biomechanical factors—including KAM and flexion moments, adduction angles, and anatomic positioning of the knee joint—as critical influencers of cartilage load and condition.12,23 While the MF condition may suggest greater risk of biomechanical stress early in the stance phase, the T2RT values did not reflect this hypothesis. Nevertheless, both NF and MF conditions revealed decreases in weightbearing ROI in the superficial layers, and increases were observed in the deep central tibia in NF, confirming our second hypothesis. This suggests that single-point biomechanical analyses may not fully capture the complex relationship between mechanical loading and cartilage health.
Third, it was hypothesized that walking in MF would show greater differences of ΔT2RT in the weightbearing zones compared with NF. The detailed analyses comparing walking loading to ΔT2RT separately in each condition did not support our third hypothesis. From a previous study, comparing these MF and NF from a biomechanics perspective, significantly greater vGRF in the absorption phase, greater knee internal rotation moment in the absorption and propulsion phases, and lower KFM in the propulsion phase were reported. 25 Based on these findings, it was suggested that the greater differences after loading in T2RT values in weightbearing zones were found in MF. If we do not take note of the greatest change that was shown in the deep central tibia on the lateral part in MF, the greatest ΔT2RT occurred in the superficial layer in the medial part of the cartilage in MF. This could be explained by the different shape of the medial and lateral condyles, causing the damage to the medial portion of the cartilage to occur earlier. Because of the different anatomic position of the condyles during walking, knee flexion shifts the lateral femoral condyle more proximally than the medial femoral condyle. When sharing the longitudinal compressive stresses of the tibiofemoral joint, the femoral condyles impinge on the tibial plateau, and the tibiofemoral joint experiences introversion stresses that increase the compressive load on the medial tibial plateau. 47 It was reported 50 that the tibiofemoral joint stress regions shift posteriorly when the knee is flexed at 30° to 45°. During walking, the knee joint flexes to approximately 45°, which probably does not reflect such significant changes in the posterior cartilage but rather in the central cartilage. Although significant differences in loading between MF and NF are evident, it appears that a common activity, such as walking in an urban environment, does not significantly influence the knee joint cartilage (eg, running or walking upstairs, even with a shorter duration). 9 Also, daily activities (eg, getting up from a seated position and walking on a different incline) may affect the condition of the knee cartilage. 1 However, these results must be seen as an acute response to a load that can accumulate over a day, a month, or even years.
Limitations
Several limitations to this study need to be acknowledged. The cross-sectional design of the study does not allow us to directly link our findings to injury mechanisms. A longitudinal study or individual modeling illustrating the gait pattern could better identify specific changes in the biomechanics and cartilage loading of the knee that may predict early OA development. 37 The results could also be influenced by the 1.5 T Siemens Magnetom Sempra compared with a 3 or 5 T scanner. Although the guidelines were followed, recommending a daily walk of 30 to 60 minutes, it seems that 45 minutes of walking in a hard, flat, urban environment may not reflect a sufficient load on the knee joint cartilage in different types of footwear, even though the number of steps was controlled. This study evaluated only 1 pair of MF and 1 pair of NF, which limits the generalizability of our findings to other types or brands of footwear within these categories. Different designs, materials, or structural features of MF and NF may yield varying biomechanical effects, and future studies should consider including a broader range of footwear types to better understand their influence on knee cartilage loading and walking mechanics.
Conclusion
The acute response to MF is manifested by an increase in knee moments in the sagittal, frontal, and transverse planes. Superficial layers seem to be more sensitive to loading after 45 minutes of walking. NF reveals a greater response to loading in weightbearing knee cartilage zones in both the medial and lateral parts of cartilage. To fully assess the effect of loading in different types of footwear on knee cartilage, a longitudinal study may be required in which people change not only the footwear type but also the surface while walking. Increasing walking time or more frequent MRI scans at different times during the day could also be a potential for future studies.
Footnotes
Final revision submitted December 10, 2024; accepted January 9, 2025.
One or more of the authors has declared the following potential conflict of interest or source of funding: This research was supported by the University of Ostrava (grant No.: SGS01/PdF/2020-2021 and SGS08/PDF/22) and by the European Union and Ministry of Education, Youth and Sports of the Czech Republic (grant No.: CZ.02.1.01/0.0/0.0/16_019/0000798 Program 4 Healthy Aging in Industrial Environment). AOSSM checks author disclosures against the Open Payments Database (OPD). AOSSM has not conducted an independent investigation on the OPD and disclaims any liability or responsibility relating thereto.
Ethical approval for this study was obtained from University of Ostrava, Pedagogical faculty (OU-53107/45-2022).