
Abstract
Background:
Tibial tuberosity–trochlear groove (TT-TG) distance has typically been used to determine the need for a tibial tuberosity medialization. However, because it is an absolute value, TT-TG distance does not consider the patient’s size and, therefore, has the potential to over- or underestimate the need for a medialization of the tibial tuberosity.
Purpose/Hypothesis:
The aim of the study was to propose a ratio combining the TT-TG distance and the posterior bicondylar width (PBCW) of the femur as a representation of patient size. It was hypothesized that this ratio would provide a more accurate assessment of patellofemoral instability than the TT-TG distance.
Study Design:
Cohort study (diagnosis); Level of evidence, 3.
Methods:
A consecutive series of patients with recurrent patellofemoral instability between 2020 and 2022 was reviewed and compared with a consecutive cohort of patients with isolated meniscal tears. The TT-TG distance and PBCW were assessed using magnetic resonance imaging, and the ratio created using both measurements (TT-TG ratio was calculated by expressing the TT-TG distance as a percentage of the PBCW) was compared to the TT-TG distance alone to evaluate differences in diagnostic accuracy and differences based on femoral size and sex.
Results:
In total, 129 patients with objective patellofemoral instability (OPI) and 105 controls were included in this study. The mean TT-TG distance was 15 ± 5.2 mm in the OPI group and 8.6 ± 3.6 mm in the control group (P < .001), with a cutoff value of 11.15 mm for distinguishing between the 2 groups. The TT-TG ratio was 22.3% ± 3% in the OPI group and 11.7% ± 4.6% in the control group (P < .001), with a cutoff value of 16%. The TT-TG distance had an area under the curve of 0.848, whereas the TT-TG ratio had an area under the curve of 0.892. Subgroup analysis indicated that the TT-TG distance (P = .02) and PBCW (P < .001) were significantly different based on sex in the OPI group; however, the TT-TG ratio did not show significant differences (P = .84).
Conclusion:
The TT-TG ratio provides an enhanced discriminant value compared with the TT-TG distance in distinguishing patients with patellofemoral instability from controls. This ratio accounts for inherent sex- and size-based differences associated with the TT-TG distance, offering a more individualized assessment when considering the need for tibial tuberosity osteotomy and the extent of medialization required.
Clinical Relevance:
This study highlights the importance of the TT-TG ratio in the analysis of patients with patellofemoral instability, providing improved diagnostic accuracy while accounting for sex and size-based differences. This allows for a more personalized treatment approach and can lead to better decision making regarding tibial tuberosity osteotomy.
The tibial tuberosity–trochlear groove (TT-TG) distance is one of the most used measurement methods to quantify the lateralized patellar tendon insertion relative to the femoral trochlea. The TT-TG distance represents an axial quantification of the Q angle. 13 Despite the different inherent values seen within populations and across different imaging modalities,2,11,18 the TT-TG distance is still relied upon to guide decision making for a tibial tuberosity transfer osteotomy. 16
Values are expressed in absolute terms; 20 mm measured with a computed tomography scan and 13 mm measured on magnetic resonance imaging (MRI) are considered threshold values to contemplate a medialization of the tibial tuberosity.1,7,20 However, given that the TT-TG difference is an absolute value, it does not consider the patient’s size. Values may differ based on the size and sex of the patient and have the potential to over- or underestimate the personalized value and the need for a medialization of the tibial tuberosity.8,15
To address this issue, a ratio offers the ability to scale the TT-TG to the size of the patient. Numerous TT-TG ratios have been published in the literature, which demonstrate good utility in discriminating between patients with and without patellar instability and also exhibit a good correlation with mediolateral distal femoral size, reflecting that these ratios are a scaled measure based on the patient’s size.2,4,10,12,14,19 However, these measures are complex to perform, involving measurement of different reference points at different levels of the knee in the axial, sagittal, or coronal plane. Because of the complexity of these measures and the time required to perform them, they are not routinely used in practice.
The posterior bicondylar width (PBCW) has been shown to be correlated to the length and width of the femur to individuals’ sex and height. 21 Given that the posterior bicondylar line (PBCL) is used as a standardized reference line for patellofemoral measurements, incorporating the PBCW into a ratio would not increase the workflow or complexity. Therefore, it seems to be an ideal reference value to create a user-friendly TT-TG ratio that would be more likely used by the wider medical community in the study of patellofemoral pathology. 9
The aim of the study was to propose a ratio combining the TT-TG distance and the PBCW using the PBCL as a reference. We hypothesized that this ratio would have better sensitivity and specificity than the TT-TG absolute distance in differentiating patients with objective patellofemoral instability (OPI) from a control group.
Methods
Ethics
All patients provided informed consent for the use of their data for research, and the study was approved by the ethical board in advance (IRB: COS-RGDS-2023-11-008-DEJOUR-D).
Study Population
This was a retrospective cohort study. All patients with OPI who were treated by the senior surgeon (D.H.D.) were prospectively added to an institutional database at a referral center for patellofemoral instability between 2020 and 2022. All patients included in this cohort had experienced at least 2 episodes of documented patellar dislocation and had undergone preoperative MRI. Patients with knee osteoarthritis, associated ligament injuries, and previous knee surgery involving bony procedures for patellar instability were excluded from the study. A continuous cohort of patients from the same period treated for isolated meniscal tears from the same institution was used as a control group. Patients with a history of ligamentous injury, anterior knee pain, or previous knee surgery were excluded from this cohort.
Measurement Tools and Methods
Measurements were performed on axial and sagittal, fat-saturated, T2-weighted knee MRI slices using Horos DICOM software (Version 3.3.6; Horos Project) by 2 independent reviewers (T.P. and N.C.). Measurements were performed twice by each reviewer, with 1 month between measurements. Reviewers were blinded to the patient’s group (control vs OPI). The control and OPI groups were combined and placed in random order before distribution to reduce potential bias.
The PBCL was determined in 3 steps6,9 (Figure 1):
Select the axial MRI slice that intersects the center of the medial condyle (Figure 1A).
Select the sagittal MRI slice that intersects the most posterior point of the medial condyle (Figure 1B).
Return to the axial slice and draw the PBCL, which passes through the subchondral bone at the posterior aspect of the medial and lateral femoral condyles (Figure 1C).
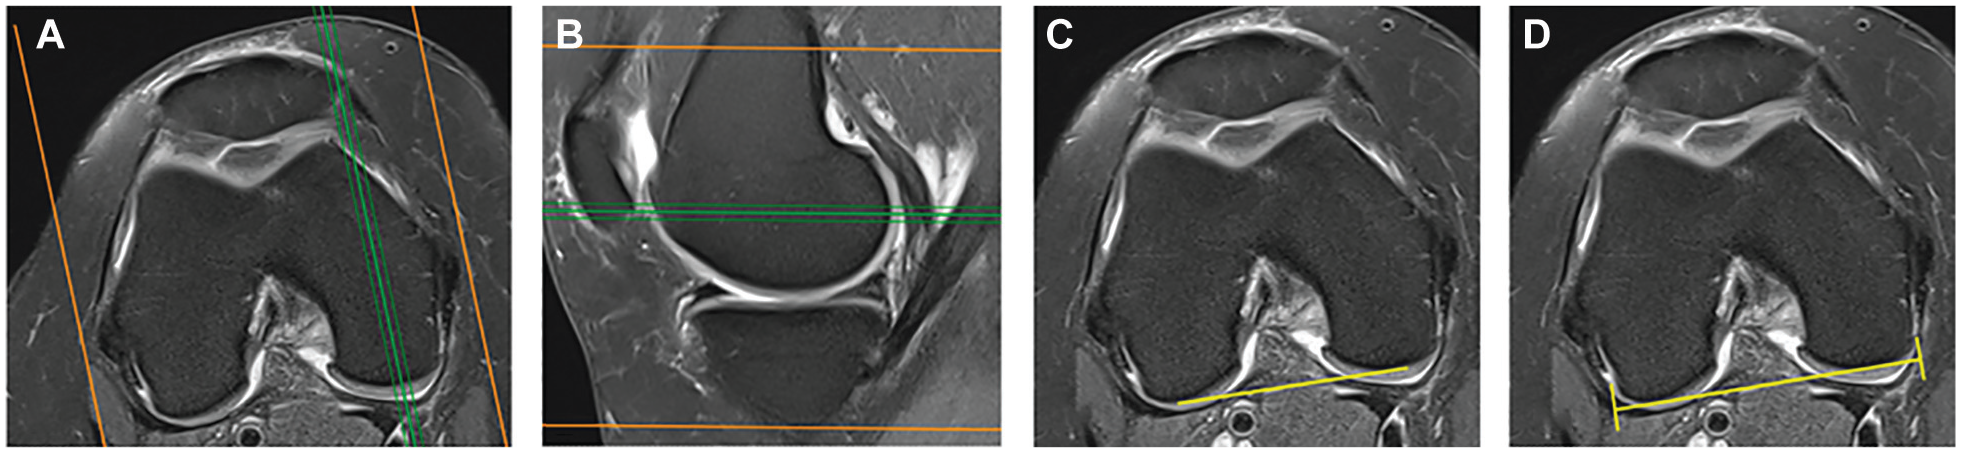
Definition of the posterior bicondylar line (PBCL) and posterior bicondylar width (PBCW). (A) Axial magnetic resonance imaging (MRI) slice that intersects the center of the medial condyle (green line). (B) Sagittal MRI slice that intersects the most posterior point of the medial condyle (green line). (C) Axial MRI slice showing the PBCL, which passes through the subchondral bone at the posterior aspect of the medial and lateral femoral condyles. (D) Axial MRI slice showing the measurement of the PBCW using the PBCL. Images A, C, and D correspond to the same axial slice.
The PBCW was defined as the distance between the most medial surface of the cartilage on the posterior medial condyle and the most lateral surface of the cartilage on the posterior lateral condyle following the PBCL (Figure 1D).
The trochlear groove point was defined as the deepest point of the trochlear cartilage groove, scrolling from cranial to caudal using the first MRI slice with clear visibility of the trochlear cartilage, showing the formation of the sulcus and the medial facet. The tibial tuberosity point was defined as the central point of the tendon in the most cranial slice where no space was visible between the patellar tendon and the anterior tibial cortex. The TT-TG distance was then measured as the distance between these 2 points using perpendicular lines to the PBCL (Figure 2). This value is referred as the TT-TG distance, and the TT-TG ratio was calculated by expressing the TT-TG distance as a percentage of the PBCW.

Measurement of the tibial tuberosity–trochlear groove distance (TT-TG). (A) Axial magnetic resonance imaging (MRI) slice showing the trochlear groove (TG) point. (B) Axial MRI slice showing the tibial tuberosity (TT) point. (C) Axial MRI slice showing the measurement of the TT-TG distance, as the perpendicular distance of the TG to the TT, with respect to the posterior bicondylar line. 10
Statistical Analysis
Continuous variables were expressed as mean ± standard deviation, whereas dichotomous variables were expressed as numbers and percentages. The Shapiro-Wilk normality test was used to evaluate the normal distribution of the sample. The independent-samples t test was used to compare measurements between cohorts. Sex distribution between the OPI and control groups was analyzed using the chi-square test. The Cramer V was calculated to assess the strength of the association between sex and group allocation.
Reliability was tested using the intraclass correlation coefficient via a 2-way mixed model.
Receiver operating characteristic (ROC) curves and the area under the ROC curve (AUC) were measured to assess the diagnostic accuracy. An AUC of 0.5 represents no diagnostic value, an AUC of 1.0 represents a perfect diagnostic test, and an AUC of 0.7 is considered to be a valuable diagnostic test. The Youden J statistic was calculated to determine optimal cutoff values to distinguish between knees with and without OPI for each sensitivity/specificity pair. AUC and cutoff values were reported for each parameter, and subgroup analysis was performed for male and female patients. The AUCs were compared using a paired-samples test.
Furthermore, Pearson correlation analysis was performed to examine the relationship between TT-TG distances and continuous variables such as age.
SPSS (Version 25; IBM) was used to perform these statistical analyses, and statistical significance was set at a P value <.05.
Results
The final analysis included 129 patients (138 knees) in the OPI group: 9 of these patients had bilateral patellar dislocations. A total of 105 patients (107 knees) were included in the control group, including 2 bilateral cases (Table 1). A significant difference in age was noted; the mean age was 24.19 ± 9.94 years in the OPI group and 42.69 ± 14.63 years in the control group (P < .001). A significant difference in sex was noted: In the OPI group, 49 of 138 patients (35%) were male, and in the control group, 68 of 107 patients (64%) were male, with a Cramer V of 0.281 (P < .001). Given the differences in sex, results were compared based on sex throughout.
Comparison of OPI and Control Groups a

Values are expressed as n or mean ± SD. Boldface indicates statistical significance (P < .05). OPI, objective patellofemoral instability.
The intraclass correlation coefficients of intra- and interrater reliability were excellent for TT-TG absolute distance and TT-TG ratio. The intrarater reliability was 0.99 and the interrater reliability was 0.98 for TT-TG absolute distance. The intrarater reliability was 0.99 and the interrater reliability 0.95 for TT-TG ratio.
A significant difference in TT-TG absolute distance was found between the OPI group (mean 15 ± 5.2 mm) and the control group (mean 8.6 ± 3.6 mm) (P < .001). The PBCW showed a statistical difference between the study group (67.44 ± 6.85 mm) and the control group (73.69 ± 7.33 mm) (P < .001).
A significant difference in TT-TG ratio was found between the study group (22.3% ± 3%) and the control group (11.7% ± 4.6%) (P < .001) (Table 2).
Comparison of Mean Values Between OPI and Control Groups a
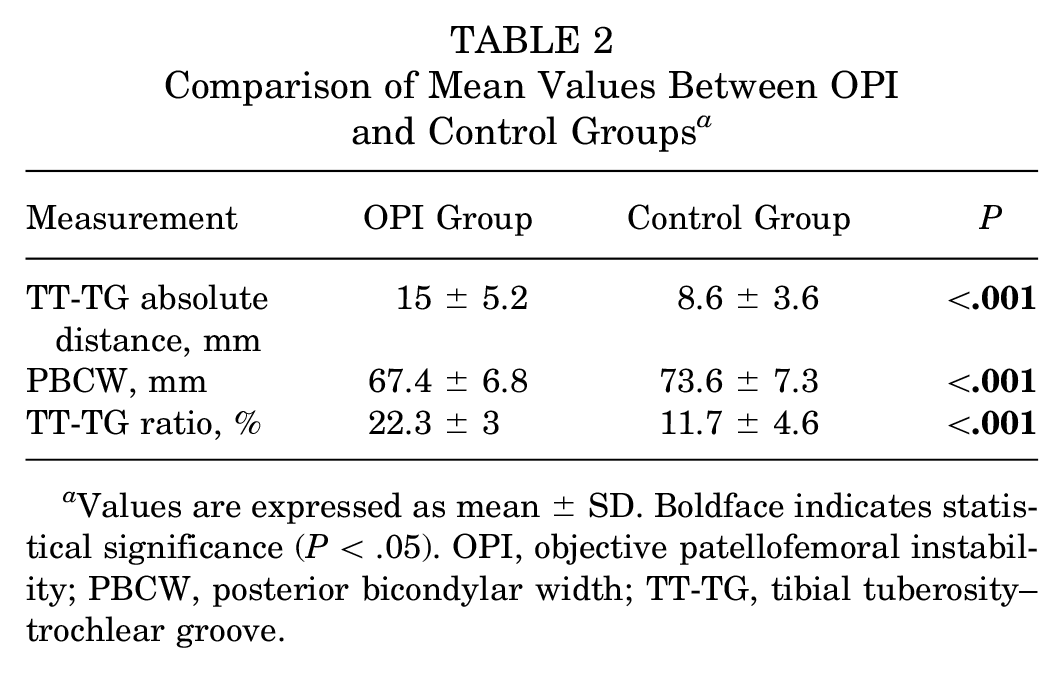
Values are expressed as mean ± SD. Boldface indicates statistical significance (P < .05). OPI, objective patellofemoral instability; PBCW, posterior bicondylar width; TT-TG, tibial tuberosity–trochlear groove.
A TT-TG distance >11.15 mm demonstrated an AUC of 0.848 (95% CI, 0.80-0.90), with 78% sensitivity and 75% specificity for predicting patellar dislocation (Table 3). A TT-TG ratio >16% showed an AUC of 0.892 (95% CI, 0.85-0.93), with 83% sensitivity and 81% specificity (Figure 3). The difference between the 2 AUC values was 0.044 (95% CI, 0.03-0.06; P < .001).
Sensitivity and Specificity of the Cutoff Values a

AUC, area under the receiver operating characteristic curve; TT-TG, tibial tuberosity-trochlear groove.

Receiver operating characteristic (ROC) curve showing the area under the ROC curve (AUC) for a tibial tuberosity–trochlear groove (TT-TG) distance with a cutoff value of 11.15 mm and a TT-TG/posterior bicondylar width ratio with a cutoff value of 16%.
The subgroup analysis showed that TT-TG distance (P = .02) and PBCW (P < .001) were significantly different according to sex within the OPI cohort. TT-TG distance had a mean of 14.28 ± 4.79 in the female participants compared with a mean of 16.57 ± 5.86 in the male participants. The PBCW had a mean of 64.09 ± 5.15 mm in the female participants compared with 73.57 ± 5.18 mm in the male participants. However, TT-TG ratio did not show significant sex-related differences (P = .84); the female participants had a mean of 22.23 ± 7.14 and the male participants had a mean of 22.49 ± 7.71 (Table 4).
Comparison of TT-TG Distance and TT-TG Ratio Between Groups a

Values are expressed as mean ± SD. Boldface indicates statistical significance (P < .05). OPI, objective patellofemoral instability; TT-TG, tibial tuberosity–trochlear groove.
No significant correlation was found between age and TT-TG distance (P = .97), age and TT-TG ratio (P = .99), or age and PBCW (P = .6). However, PBCW had a Pearson correlation coefficient of −0.643 with female sex (P < .001), suggesting an increase in PBCW with male sex.
Discussion
The main finding of the study is that the TT-TG ratio demonstrated superior accuracy compared with the TT-TG distance. The TT-TG ratio also adjusted for sex-based differences in the cut-off values, meaning that 1 cut-off value can be used for both male and female patients. Interobserver reliability and intraobserver reliability were excellent in both groups.
These findings suggest that larger absolute values for TT-TG distance may simply reflect larger patient size, particularly in male patients, rather than indicating a pathological condition. Conversely, smaller female patients with symptomatic patellar instability may present with a lateralized tibial tuberosity, which could benefit from medialization, yet their TT-TG distance may fall below traditional absolute thresholds. Therefore, a measurement that accounts for patients’ size and variability is crucial for more accurate clinical decision making.
Multiple ratios have been proposed in the literature to individualize TT-TG measurement, demonstrating improved diagnostic utility with a higher AUC compared with TT-TG distance.2-5,10,12,14,19 In a recent study, Su et al 17 evaluated 6 different ratios to individualize the measurement of TT-TG, and all of them proved to be effective in differentiating patellofemoral instability from controls, with greater precision than the TT-TG distance alone. However, their study used a small series and a mixture of computed tomography and MRI, introducing inevitable measurement bias. Su et al found that the TT-TG/trochlear width ratio demonstrated the highest efficacy in distinguishing between patients with OPI and a control group, that study being the only one with a higher AUC compared with our measurement (ROC 0.91). However, it is relevant to note that this measure, initially described to differentiate between patients with recurrent instability and those experiencing their first episode of instability, has the limitation of being determined by the trochlear size in a population with a high rate of trochlear dysplasia and has not been validated as a reference of femoral size or correlated with the size of the patients. 3 In comparison, our study used the PBCW, which is correlated with femoral size and patient size. 21
The TT-TG ratio has multiple advantages over other ratios. First, the posterior reference line is independent of the trochlear shape, which is known to differ in OPI compared with controls due to trochlear dysplasia. Second, the PBCL is part of the protocol for evaluating patellofemoral instability published by Dejour et al, 6 and it adds only a minimal step to the process because it can be determined on the same axial image used for obtaining a femoral size reference. 9 Third, this measurement has been previously validated as a reference for patient size, meaning it can account for differences in patient size. 21 Fourth, our TT-TG ratio had superior sensitivity and specificity compared with TT-TG absolute distance.
Although previous studies have shown no specific sex-based differences in TT-TG,2,12 our study revealed sex-based differences in the TT-TG distance. This necessitates the use of different cutoff values for men and women when considering this parameter. However, our results demonstrate that a single TT-TG ratio cutoff value can be used, regardless of sex, which supports the use of the TT-TG ratio in clinical practice.
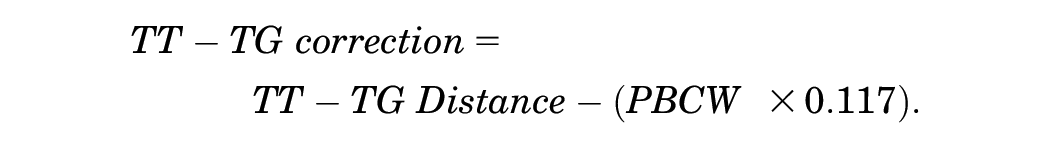
We provide the following to demonstrate how TT-TG ratio can be incorporated into surgical planning. We observed that the mean TT-TG ratio in the control group was 11.7%. This value is considered our final TT-TG ratio goal. To determine the extent of correction required, we propose multiplying the PBCW of each patient by the TT-TG ratio goal. By subtracting this value from the actual TT-TG distance, we are then able to establish the magnitude of correction needed. For example, in a patient with a TT-TG distance of 15 mm and a PBCW of 67 mm, the TT-TG correction needed is 7.1 mm:
This study had several limitations. First, this study compared only radiologic parameters; although such a comparison may aid in surgical decision making, the study did not correlate radiologic parameters with patient-reported outcomes or surgical interventions. Second, baseline differences between the study and control groups were inherent to the retrospective study design, as reflected in the significant differences in patient age, sex, and PBCW. To account for these differences, we performed separate subgroup analyses based on sex. We observed a significant correlation between sex and PBCW, with male participants having a larger PBCW. The TT-TG ratio effectively accounted for sex-based differences observed when the TT-TG distance was used. Third, although the investigators who reviewed the images were blinded to group allocation, inherent differences in imaging characteristics may have introduced some degree of unintentional bias, as the control group consisted predominantly of older male participants with meniscal tears, whereas the OPI group was composed mostly of younger female participants.
Conclusion
The TT-TG ratio provided an enhanced discriminant value compared with the TT-TG distance in distinguishing patients with patellofemoral instability from controls. The measurement accounts for sex and size-based differences inherent to TT-TG distance without introducing additional steps seen with other proposed TT-TG ratios. A proposed TT-TG ratio threshold of 16% enables differentiation between patients with OPI and patients in the control group, with a sensitivity of 83% and specificity of 81%. This personalized approach allows a more individualized assessment when considering the need for tibial tuberosity osteotomy and the extent of medialization required.
Footnotes
Final revision submitted March 3, 2025; accepted March 11, 2025.
The authors have declared that there are no conflicts of interest in the authorship and publication of this contribution. AOSSM checks author disclosures against the Open Payments Database (OPD). AOSSM has not conducted an independent investigation on the OPD and disclaims any liability or responsibility relating thereto.
Ethical approval for this study was obtained from Conseil d’Orientation Scientifique Ramsay Santé Comité d’Ethique (IRB: COS-RGDS-2023-11-008-DEJOUR-D).