
Abstract
Background:
A single universally accepted protocol does not exist for measuring the posterior tibial slope (PTS), limiting the application of cutoff values for surgical decision-making and risk stratification.
Purpose/Hypothesis:
This purpose of this study was to validate an online computer vision model using anatomic landmarks for PTS measurement on uncalibrated lateral knee radiographs. It was hypothesized that this model would achieve similar accuracy to manual measurement.
Study Design:
Cohort study; Level of evidence, 2.
Methods:
A total of 10,007 lateral knee radiographs collected between January 2009 and December 2019 were utilized. The data set comprised 9277 (93%) training, 500 (5%) validation, and 230 (2%) test radiographs. After defining “A” as the distance from the tibial joint line to the proximal aspect of the tibial tuberosity, 2 landmark-based methods for determining the tibial shaft axis were developed based on lines connecting the tibia midpoints at distances: (1) 2A and 3A (short method) and (2) 2A and 4A (long method). The PTS was then calculated using each tibial shaft axis. Model performance was evaluated against orthopaedic specialists’ measurements using inter- and intraobserver intraclass correlation coefficients (ICCs). Model performance on shortened images, subcategorized into normal, osteoarthritic, and implant-embedded knees, was also assessed, along with time efficiency comparisons.
Results:
The overall interobservers ICCs were 0.91 for the short method and 0.92 for the long method against manual measurement. The ICCs for normal, osteoarthritic, and implant-embedded radiographs were 0.84, 0.90, and 0.97 for the short method and 0.88, 0.91, and 0.97 for the long method, respectively. The intraobserver ICC for the computer vision model was a perfect 1.00, while manual measurements showed ICCs of 0.89 for the short method and 0.95 for the long method. The mean model measurement time was 2.5 ± 0.7 seconds, compared with 26.1 ± 1.9 seconds for the manual measurement (P < .001).
Conclusion:
A novel, time-efficient, deep learning model for measuring PTS demonstrated excellent accuracy and consistency across various lateral knee radiographs. If externally validated, this model may enable a pathway for direct clinical translation of research findings by providing a standardized measurement tool.
The posterior tibial slope (PTS), which is defined by the angle between the tibial plateau and the tibial shaft axis, plays a crucial role in the biomechanics of the knee joint, affecting both motion and stability.4,13,15,21 Historically, it was often overlooked, but more recently, the PTS has been identified as an important factor affecting the knee, including cruciate ligament biomechanics, outcomes after high tibial osteotomy, and the longevity of implants in total knee arthroplasty. ¶¶ With this relatively new appreciation for the importance of the PTS, the orthopaedic community has responded by making the PTS a necessary consideration when planning such surgical interventions.
Despite its clinical importance, there is a surprising lack of a standardized, universally accepted method for measuring the PTS.12,32 This lack of consensus results in significant variation across studies and creates challenges in clinical applications. This inconsistency can be attributed to several factors. First, the length of radiographs varies from partial to full tibial coverage, affecting the consistent definition of the tibial axis due to the tibia's natural curvature. 6 Moreover, the choice of landmarks for determining this axis often differs in research, with some advocating specific distances from the joint line.7,12,15,32 As not all radiographs are to scale, the possibility of magnification error arises, impacting the accuracy of distance measurements from the tibial joint line. While computed tomography (CT) and magnetic resonance imaging (MRI) may address some of the limitations, plain radiographs remain the preferred method of PTS calculation in clinical settings due to their low cost, time efficiency, and routine procurement.
In both clinical and research settings, manual measurement of PTS can be time-consuming and dependent on experience level, leading to interobserver variation. This underscores the need for an automated, valid, reliable, and fast PTS measurement method for clinicians and researchers alike. Recently, artificial intelligence (AI), particularly deep learning, has shown high accuracy and efficiency in automation technologies within orthopaedics. For instance, machine learning models have been reported to enhance image analysis and diagnostic accuracy in sports medicine. 26 Therefore, the purpose of this study was to validate an online, user-friendly, computer vision model based on anatomic landmarks for rapid PTS determination using uncalibrated lateral knee radiographs. The hypothesis was that this computer vision model would enable rapid calculation of PTS with similar accuracy to manual measurement on the same images.
Methods
Ethics Approval
This study was conducted in accordance with ethics guidelines and received approval from the institutional review board (No. 2100-200-1269). Informed consent was waived due to the retrospective design of the study.
Study Population
Lateral knee radiographs were collected from all patients visiting a single tertiary hospital between January 2009 and December 2019 (N = 49,731). Radiographs were excluded from the study if excessive osteophytes or loose bodies precluded the accurate identification of anatomic landmarks (n = 291). For patients with multiple radiographic entries, only 1 image was randomly selected for inclusion. A total of 10,007 radiographs met the inclusion and exclusion criteria and were used in the study. Of these, 9277 (93%) were allocated for training, 500 (5%) for validation, and 230 (2%) constituted the test set (Figure 1). The training data set included radiographs without osteoarthritis (n = 2109; 22.7%), radiographs with osteoarthritis (n = 5159; 55.6%), and radiographs after knee arthroplasty (n = 2009; 21.7%). The sizes of the training, validation, and test sets were determined arbitrarily as there is no consensus regarding the optimal split ratio in the literature.

Overview of the study population. PTS, posterior tibial slope.
Data Acquisition and Radiographic Protocols
Radiographs were obtained from the institution's picture archiving and communication system (PACS). The standard imaging protocol required the superimposition of the medial and lateral femoral condyles, constituting a lateral image without substantial rotation.
Anatomic Landmarks and PTS Measurement
Two orthopaedic specialists (B.R. and S.E.K.), each with >7 years of expertise, annotated 6 anatomic landmarks (keypoints) on the lateral radiographs for model training. The landmarks included the superior and inferior poles of the patella, the most distal margin of the patellar articular surface, the anterior and posterior apexes of the medial tibial plateau, and the proximal aspect of the tibial tuberosity (TT). In radiographs displaying knee arthroplasty implants, annotations were made at the anterior and posterior peak points of the tibial baseplate articular surface (Figure 2).

Examples of 6 anatomic landmarks on lateral knee radiographs. Radiographs (A) without and (B) with an implant. Landmarks 0 to 5 (indicated in red) represent the superior pole of the patella, the most distal margin of the patellar articular surface, the inferior pole of the patella, the anterior and posterior apexes of the medial tibial plateau, and the proximal tibial tuberosity.
The PTS was calculated using 2 primary methods: (1) distance-based and (2) landmark-based. For both methods, the tibial joint line was annotated by connecting the anterior and posterior apexes of the medial tibial plateau. For the distance-based method, the images had to include a calibration metric, and the tibial shaft axis was determined by connecting midpoints located 5 cm and 15 cm from the knee joint line as described by Yoo et al.10,32
The landmark-based method was developed to account for images that either did not have a calibration metric (ie, without a ruler in the radiograph) or were <15 cm. These represent common limitations in the clinical setting, and a ruler-free method similar to the one proposed by Hashemi et al 16 was applied. Here, the perpendicular distance from the tibial joint line to the proximal TT was designated as distance A. Two methods were used to define the tibial shaft axis by connecting the midpoints between the tibial outer cortices at distances of (1) 2A and 3A (short method) and (2) 2A and 4A (long method) from the tibial joint line (Figure 3). The proximal landmark was set at 2A, to circumvent the morphological posterior translation of the anterior and posterior cortices of the tibia near the proximal segment of the TT. For the distal landmark, 2 positions were evaluated (3A and 4A) to address potential variations in PTS values associated with different landmark points. This is a crucial consideration, especially when dealing with shorter radiographs that might not include a long enough view of the tibia to apply the long method.

Two landmark-based methods for determining the tibial anatomic axis on lateral knee radiographs. “A” is defined as the distance from the tibial joint line to the proximal tibial tuberosity. (A) The method of connecting midpoints on the tibial outer cortices at distances of 2A and 3A (short method). (B) The method of connecting midpoints on the tibial outer cortices at distances of 2A and 4A (long method).
Model Implementation
The disentangled keypoint regression (DEKR) algorithm was utilized for localization of the 6 previously defined keypoint landmarks (Figure 2). The DEKR uses a multibranch parallel adaptive convolution method to identify each landmark individually. The training process was partitioned into separate branches for detecting the 6 distinct landmarks. After this, a bone segmentation algorithm was used to identify the midpoint of the anterior-posterior dimension of the tibia. The distances and angles for measuring PTS were then calculated based on these landmarks. Model fine-tuning was conducted using a validation set of 500 lateral knee radiographs. Performance evaluation was then carried out on a test set of 230 radiographs, each embedded with a calibrated ruler. This data set comprised 100 radiographs without knee osteoarthritis, 100 radiographs of knees with osteoarthritis, and 30 radiographs obtained in patients who had undergone knee arthroplasty (Figure 4).

Examples of posterior tibial slope measurement by the deep learning model. (A) Normal, (B) arthritic, and (C) implant-embedded knees.
Model Performance
Evaluation of model performance with regard to tibial slope calculation was done in a stepwise fashion. First, the validity of the novel landmark-based method to approximate the PTS as defined by a previously published distance-based method was assessed through comparison of manual measurements using each technique. Next, the validity of the computer vision model was evaluated by comparing automated and manual PTS measurements (both using the landmark-based method). The third step was to repeat both manual and automated PTS measurements to evaluate the reliability of both techniques over time. Finally, efficiency was determined by comparing the time required to calculate the PTS using the computer vision model versus manual human measurement.
Validation of the Landmark-Based Method
The PTS was measured manually using both the distance-based and landmark-based techniques. The interobserver reliability was evaluated using intraclass correlation coefficients (ICCs) by comparing these manual measurements obtained using both methods.
Validation of the Computer Vision Model
To assess how well the computer vision model approximated the manual human measurement of PTS using the landmark-based method, the test set of radiographs was cropped shorter. The cropping was done to retain an area extending up to 4 times the distance from the tibial plateau to the proximal TT (4A distance). Measurement of the PTS was performed both manually and using the computer vision model on these images. Once again, the ICC was used to assess the level of agreement between the automated and manual measurement of the PTS using the landmark-based method. Model performance was also evaluated for the normal, osteoarthritic, and postarthroplasty subgroups.
Reliability Assessment
The intraobserver reliability was assessed by reevaluating the same set of radiographs after an interval of 4 weeks by both the orthopaedic specialists and the computer vision model. To evaluate whether the computer vision model recognized cropped images differently from the original ones, the ICCs of PTS measurements between the original and cropped images were also compared. This comparison was necessary because the identification of anatomic landmarks may not be identical in both sets of images. The strength of agreement for the ICCs was interpreted as follows: <0.20 was considered unacceptable, 0.20 to 0.39 was deemed questionable, 0.40 to 0.59 was considered good, 0.60 to 0.79 was categorized as very good, and 0.80 to 1 was regarded as excellent.22,28
Efficiency Assessment
The mean processing times for both the computer vision model and the orthopaedic specialists were compared using 50 randomly selected lateral knee radiographs. For the computer vision model, the processing time included logging in, loading the radiograph into the web interface, and subsequently confirming the PTS. The time to calculate the PTS using the computer vision model was also assessed, excluding the log-in time, to simulate a scenario whereby a user would already be logged in and calculating PTS for multiple images. For the orthopaedic specialists, processing time included loading the radiograph into the PACS, annotating the appropriate landmarks using the radiograph-embedded ruler, and using the angle measurement tool to determine the PTS.
Statistical Analysis
Statistical analyses, including the Student t test, calculation of ICCs, and generation of Bland-Altman plots, were conducted using SPSS for Windows Version 25 (IBM Corp) and Python 3.12.
Results
Validation of the Landmark-Based Method
Table 1 presents the interobserver ICC comparing the distance-based manual measurements with the landmark-based manual measurements (both short and long methods). The agreements were 0.84 (95% CI, 0.64-0.92) for the short method and 0.94 (95% CI, 0.92-0.96) for the long method.
Interobserver Reliabilities Comparing the Distance-Based and Landmark-Based Manual Measurements a

Values are given as ICC (95% CI). ICC, intraclass correlation coefficient.
Validation of the Computer Vision Model
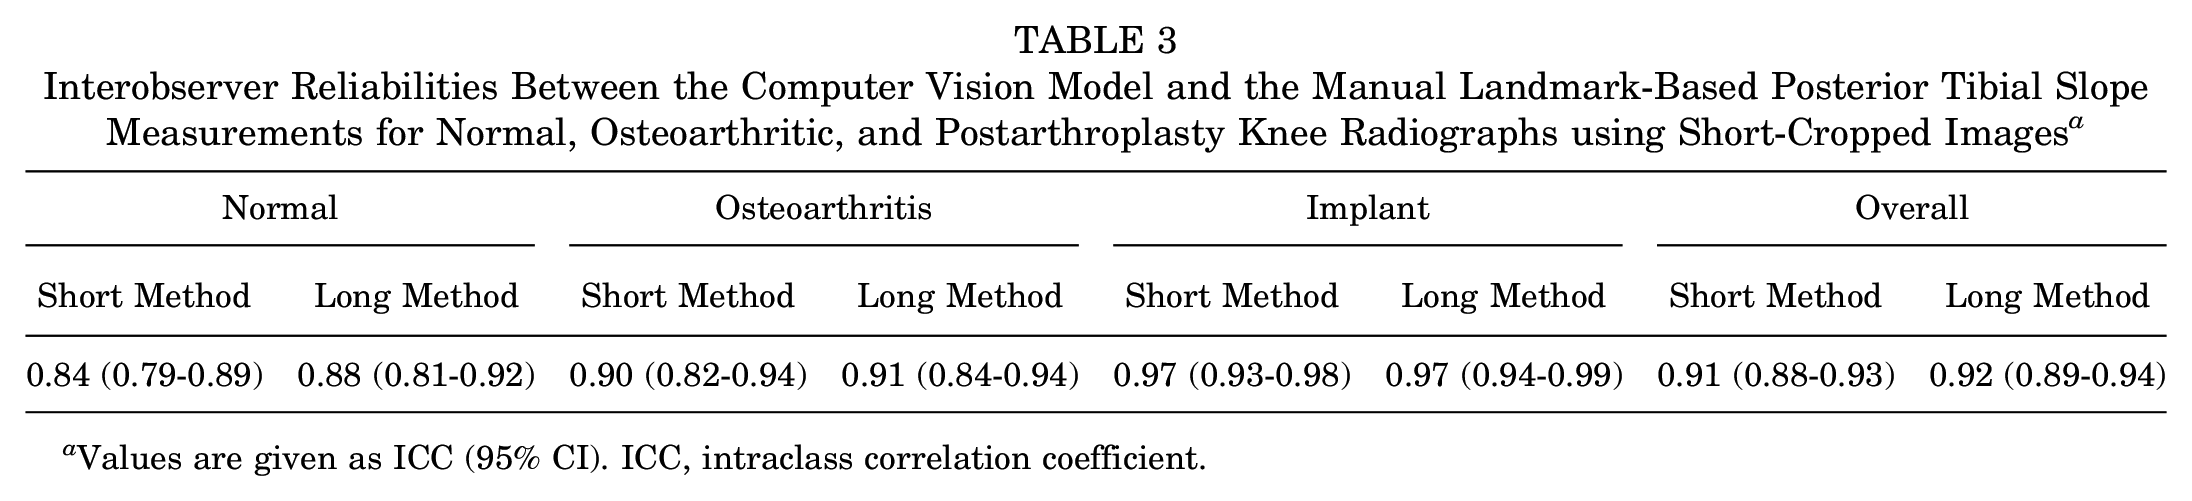
Comparison of the computer vision model and the orthopaedic specialists applying the landmark-based methods on the short radiographs demonstrated interobserver ICCs ranging from very good to excellent for both the short and long methods (Table 2). Table 3 presents the ICCs between the computer vision model and the manual landmark-based PTS measurements for normal, osteoarthritic, and postarthroplasty knee radiographs using the short-cropped images. The ICCs between the computer vision model and manual measurements were excellent for all subcategories, with higher ICCs for osteoarthritic and implant knee radiographs relative to normal knee radiographs.
Interobserver Reliabilities of Landmark-Based Posterior Tibial Slope Measurements on Short Radiographs a

Values are given as ICC (95% CI). ICC, intraclass correlation coefficient.
Interobserver Reliabilities Between the Computer Vision Model and the Manual Landmark-Based Posterior Tibial Slope Measurements for Normal, Osteoarthritic, and Postarthroplasty Knee Radiographs using Short-Cropped Images a
Values are given as ICC (95% CI). ICC, intraclass correlation coefficient.
Bland-Altman plots for the test sets comparing the computer vision and landmark-based manual measurements revealed no systematic bias (Figure 5). An assessment of outliers, defined as values beyond the standard deviation threshold of 1.96 in the Bland-Altman plots, showed rates of 5.7% for the short method and 3.5% for the long method. For the short method, manual measurements showed a mean PTS of 10.5°± 3.4°, while automated measurements yielded a mean PTS of 10.0°± 3.4°. For the long method, manual measurements had a mean PTS of 9.4°± 3.3°, and automated measurements had a mean PTS of 9.0°± 3.5°.

Bland-Altman plots comparing the computer vision model and landmark-based manual measurements. (A) Short and (B) long methods.
Reliability Assessment
The intraobserver ICCs for PTS measurements between the orthopaedic specialists and the computer vision model are presented in Table 4. The automated model achieved a perfect ICC of 1.00. The ICCs for manual measurements were 0.89 (95% CI, 0.84-0.93) using the short method and 0.95 (95% CI, 0.93-0.96) using the long method. The ICC for the computer vision model's measurements between original and shortened radiographs was 0.92 (95% CI, 0.89-0.94), suggesting a change in reliability with image size alteration.
Intraobserver Reliabilities of Posterior Tibial Slope Measurements on Short-Cropped Radiographs a

Values are given as ICC (95% CI). ICC, intraclass correlation coefficient.
Efficiency of the Computer Vision Model
The mean manual PTS measurement was 26.1 ± 1.9 seconds on calibrated ruler-embedded images. The mean computer vision model measurement time from log-in to confirming the result was 18 seconds. It was observed that if the surgeon was already logged into the web platform, obtaining results with the model took only 2.5 ± 0.7 seconds (P < .001).
Discussion
The most important findings of this study are that (1) the landmark-based method is valid for calculation of the PTS on lateral knee radiographs and (2) the computer vision model was valid, reliable, and time-efficient for PTS calculation. With the landmark-based method, this model is applicable to both short and uncalibrated images. The long method was particularly proficient in terms of accuracy and consistency, exhibiting excellent interobserver and intraobserver reliability comparable to the previously described method using 5 cm and 15 cm. It also achieved perfect consistency in repeated measurements of the same unaltered radiographs. This high level of performance extended to a diverse range of radiographs, encompassing normal knees, osteoarthritic knees, and knees with implants. Additionally, the speed of measurement was a notable advantage of the model.
Various methods for measuring PTS have been reported in the literature. Dejour and Bonnin 10 used an angle formed between the joint line and the diaphyseal axis. The diaphyseal axis was defined as the line connecting the 2 midpoints at the level of the tibial tubercle and a point 10 cm below on the tibial shaft. Kansara and Markel 20 took a different approach by measuring the angle between the horizontal line and the joint line. Meanwhile, Brazier et al 5 argued for the reliability of using the tibia's proximal anatomic axis and posterior tibial cortex among the proximal axis of the tibia. The diverse techniques described in the literature underscore the absence of a systematic review or a universally accepted standard for PTS measurement, highlighting the necessity for a consistent and reliable method.
In this study, a distance-based PTS measurement technique described by Yoo et al 32 in which the anatomic axis was defined by connecting midpoints located 5 cm and 15 cm from the knee joint line was compared with a novel landmark-based method. The primary challenge with the conventional approach is its inherent reliance on a predetermined distance, necessitating the use of a calibrated radiograph. This poses challenges for its applicability to noncalibrated images, frequently encountered in clinical environments. Additionally, in many centers the lateral knee radiographs may not extend distally for a distance of 15 cm, requiring an alternative measurement technique. In contrast, the axis determination of the present model eliminates the need for a calibrated radiograph. While an alternative approach, connecting midpoints of 2A and 6A to infer the anatomic axis (corresponding to the 5-cm and 15-cm references in the previous study by Yoo et al 32 ), could be proposed, it is often rendered infeasible due to the restricted length of certain radiographs, necessitating the adoption of the described methodology for short leg radiographs.
The high interobserver ICC between the orthopaedic specialists when applying the landmark-based and distance-based measurements suggests that the landmark-based method is a valid representation of the PTS. The high interobserver ICC between the automated computer vision model and the manual measurements suggests that the deep learning model is also valid for PTS calculation. Furthermore, the reliability of the model measurements was superior to the manual measurements when reevaluating the same images 4 weeks later. The superior performance of the long method over the short model can be attributed to the method used as the gold standard, which measured the angle between the joint line and the tibia shaft axis. The longer distance used in the long model is likely more accurate, considering the decreasing curvature of the anterior proximal tibia at further distances. This suggests that the long method is less affected by the bony curvature of the proximal tibia compared with the short method.
Other anatomic references, such as the anterior and posterior cortical lines, also have clinical implications when used instead of the shaft axis, but they differ in their mean PTS values. The model evaluated in this study used the shaft axis, which is less influenced in cases in which either the anterior or posterior cortex is disrupted or exhibits irregularities, compared with methods using the anterior or posterior cortical line as reference points. In addition, Yoo et al 32 demonstrated that the most representative anatomic reference for the sagittal mechanical axis is the proximal anatomic axis, further supporting the applicability of the computer vision model approach.
Recently, the role of AI in medical imaging—including MRI, CT, and plain radiographs—has significantly expanded. Several studies have similarly applied AI to PTS measurement. For example, Tong et al 30 and Lu et al 23 developed models for automatic PTS measurement from lateral knee radiographs, while Amerinatanzi et al 2 and Qiu et al 27 aimed to incorporate MRI alongside other AI methodologies for accurate and efficient measurements. Tong et al 30 reported a strong within-group correlation (Cronbach alpha of 0.864), and Lu et al 23 reported a mean Dice similarity coefficient of 0.885 in the validation cohort. However, Tong et al 30 pointed out limitations, such as a relatively small sample size and the reliance on the quality of radiographs for detecting regions of interest. Amerinatanzi et al 2 reported variations in the tibial slope across the tibial plateau, indicating that tibial slope is not a uniform structure when measuring PTS using MRI. However, they reported that a better understanding of 2-dimensional plane measurements would require further research with a larger sample size. They also pointed out the limitation that obtaining a standard supine lying position consistently from MRI examinations can be challenging. In the present study, the training data set incorporated >9000 radiographic images, a volume that significantly surpasses that of prior studies, and demonstrated exceptional ICC. The long method, with an interobserver ICC of 0.92, can be used as a principal methodology for PTS measurements. In instances in which radiographic images are of limited length, the short method, demonstrating an ICC of 0.91, presents itself as a viable alternative with excellent accuracy. Additionally, AI integration with automated tools like those proposed by Qiu et al 27 could lead to a standardized approach to PTS measurement, reducing interclinician variability and improving clinical outcomes. However, the use of MRI for such methods is often limited by costs and may face challenges in cases in which patients have implants, which can distort imaging and complicate measurements.
An interesting observation from this study was the model's relatively high accuracy in measuring PTS in radiographs of knees with osteoarthritis and implants, compared with those of normal knees. This heightened accuracy may be attributed to the distribution imbalance in the training set, where osteoarthritic images were more prevalent than normal images. Additionally, images with severe osteophytes or loose bodies that substantially obscured anatomy to such an extent that even orthopaedic specialists could not accurately identify them were excluded from both the training and test sets. This led to the inclusion of predominantly clearer osteoarthritic radiographs in the data set. Moreover, radiographs featuring implants typically exhibited distinct landmarks due to their high contrast, which facilitated the annotation process. This clarity in landmark identification likely contributed to the higher interobserver ICCs observed for these images.
The computer vision model in this study markedly reduced the time needed for PTS measurement. Manual measurements of PTS required approximately 26 seconds, whereas, if already logged in, the vision model needed only 2.5 seconds per radiograph. Automating the calculation process not only saves clinical time but also allows health care providers to use their resources more effectively. Furthermore, the quickened pace of this automated method aids in collecting large-scale data for research, thereby accelerating data analysis.
The potential clinical implications of a valid, reliable, and freely available PTS calculation model cannot be overstated. If the orthopaedics community were to collectively utilize the same measuring tool and with the same methodology, it would enable a more direct translation of research findings into clinical practice. For example, if future studies identifying cutoff values for clinical decision-making (such as the indication for slope-correcting osteotomy in ligament deficiencies) utilize an automated slope calculation technique, the cutoff value can be directly applied to clinical practice since the clinicians would be using the same measurement tool as the researchers. For this idea to become a reality, the external validity of the PTS model would first need to be established.
This study is not without limitations. First, the radiographs were collected from a tertiary hospital, leading to a predominance of images showing osteoarthritic conditions and knees with implants. Additionally, because the model was developed and tested using images from a single institution, assessment of the external validation with images from other institutions equipped with varied imaging devices and protocols is a crucial step to be performed before implementation into clinical and research practice. While landmarks in the patella were annotated, they were not the central focus of this study. However, this annotation was necessary for enhancing landmark recognition needed for measuring the PTS. These annotations also have the potential to serve as a foundation for future research into patellar metrics, including the automated measurement of patellar height. Second, this study used only the medial tibial plateau as an anatomic landmark. This approach was adopted to reduce the number of variables and enhance the model's accuracy. However, Hashemi et al 16 reported that the tibial slope may vary depending on whether the medial or lateral tibial plateau is referenced. Despite this, Akagi et al 1 demonstrated that the tibial slope measured using the medial tibial plateau still provides significant information. Another challenge faced was the absence of a universally accepted gold standard for PTS measurement. Nonetheless, the proposed model's strength lies in its ability to measure PTS in radiographs without the need for incorporated calibration, potentially paving the way for broader adoption.
Conclusion
A novel deep learning model for measuring PTS demonstrated excellent accuracy and consistency across various lateral knee radiographs. If externally validated, this model may enable a pathway for direct clinical translation of research findings by providing a standardized measurement tool. This model also offers significant time savings relative to manual measurements of PTS, facilitating deployment in both clinical and research environments.
Footnotes
Final revision submitted November 2, 2024; accepted December 6, 2024.
One or more of the authors has declared the following potential conflict of interest or source of funding: R.K.M. has received education support from Arthrex and Smith & Nephew and hospitality support from DePuy Synthes. E.I. has received consulting fees from Smith & Nephew. This research was supported by a grant from the Korea Health Technology R&D Project through the Patient-Doctor Shared Decision Making (PDSDM) Research Center, funded by the Ministry of Health & Welfare, Republic of Korea (grant No. HV23C1803). AOSSM checks author disclosures against the Open Payments Database (OPD). AOSSM has not conducted an independent investigation on the OPD and disclaims any liability or responsibility relating thereto.
Ethical approval for this study was obtained from SNUCM, SNUH (H-2110-200-1269).