
Abstract
Background:
A significant statistical association of increased critical shoulder angle (CSA) with rotator cuff tear (RCT) has been demonstrated; however, the mean difference between RCT and control groups varies between approximately 1° and 3.5°, with a wide range of distribution of the CSA from 18° to 55°. It may be more predictive to evaluate the CSA in conjunction with parameters that evaluate the morphology of the acromion in the sagittal plane.
Hypothesis:
It was hypothesized that the acromial incidence angle (AIA), which can evaluate the position and orientation of the acromion in the sagittal plane, may be associated with RCT and that AIA, when evaluated together with the CSA, may provide a highly predictive measure of risk for RCT.
Study Design:
Cross-sectional study; Level of evidence, 3.
Methods:
The study included 117 patients who underwent arthroscopic repair for posterosuperior RCT and 117 patients as a control group. The CSA, AIA, glenoid inclination, glenoid version, and anterior acromial coverage were measured on magnetic resonance imaging. The groups were compared in terms of these parameters.
Results:
The mean CSA was significantly higher in the RCT group (35.7°± 5.3°) than in the control group (33.9°± 4.5°), with a sensitivity of 57.1% and a specificity of 61.3% (P = .009). The mean AIA was also significantly higher in the RCT group (77.4°± 12.9°) compared with the control group (63.7°± 9.4°), with a sensitivity of 80.2% and a specificity of 83.9% (P < .001). The anterior acromial coverage showed significantly less anterior coverage in the RCT group (−16.5°± 14°) than in the control group (−9.7°± 10.5°) (P = .033). Logistic regression analysis showed that the CSA and the AIA were associated with RCT independently of other parameters (P < .001, P < 0.001, odds ratio [OR], 1.32, and OR, 1.34, respectively). In the patient group with a CSA of <35°, AIA values of >72° predicted RCT with a sensitivity of 85.6% and a specificity of 84.8%, while in the patient group with a CSA of ≥35°, values of >65° predicted RCT, with a sensitivity of 70.2% and a specificity of 76.7%.
Conclusion:
The AIA predicted RCT with a sensitivity of 80.2% and a specificity of 83.9% for values >70°. In patients with a CSA of <35°, it predicted RCT, with a sensitivity of 85.6% and a specificity of 84.8% at values >72°. By evaluating the relationship between the acromion and the glenoid in the sagittal plane, the AIA, as a novel parameter, allows for the reevaluation of the risk in the patient group with a CSA of <35°, which is considered to be in the low-risk category in terms of RCT.
Keywords
Rotator cuff tears (RCTs) are common in elderly patients and have a negative effect on daily life, as they cause functional loss and pain. 13 Most RCTs are degenerative and age-related. 17 In addition, risk factors related to differences in scapular morphology may accelerate age-related degeneration. 13 The relationship between the increase in the critical shoulder angle (CSA)—one of the intrinsic anatomic factors of the scapula—and RCT has been investigated in many studies.18,21,23 Moor et al 16 defined the CSA as the angle between the line joining the superior and inferior bony margins of the glenoid and the line joining the inferior glenoid and the lateral margin of the acromion on a coronal view. They showed that CSA values of >35° are associated with RCTs12,16 Cherchi et al 8 evaluated patients with full-thickness RCTs and those who had labral repair and found that the CSA value in the RCT group (36.4°± 4.4°) was significantly higher than in the labral repair group (33.3°± 3.3°). In their study, the CSA distribution was between 25° and 46°. Pandey et al 21 found significantly higher CSA values (74% sensitivity and 60% specificity) in patients with full-thickness RCTs (41°± 3.1°) compared with the control group (37.3°± 4.9°). Blonna et al 5 found significant intergroup differences in CSA values in full-thickness supraspinatus tears (36°± 3°), supraspinatus with infraspinatus tears (40°± 3.5°), and the control group (34.3°± 3°). Chalmers et al 7 found that the mean CSA was significantly higher in patients with full-thickness RCTs (33.9°± 4.2°) than in patients with adhesive capsulitis (31.7°± 4.3°). Bjarnison et al 4 did not find a significant difference in terms of CSA between the RCT patient group and the control group. 4 İncesoy et al 9 found that the mean CSA on magnetic resonance imaging (MRI) was significantly higher in the RCT group (33.6°± 3.9°) than in the control group (31.5°± 4°). On the other hand, Maalouly et al 15 did not find any difference in terms of CSA between the RCT patient group and the control group in their MRI measurements.
The significant association of increased CSA with RCT has been shown in many studies in the literature, but the mean difference between RCTs and control groups ranged between approximately 1° and 3.5°, while the range of distribution of the CSA was between 6 18° and 55°. Although it is known in the literature that the CSA values of >35° are associated with RCTs, we sought to evaluate the acromion morphology in the sagittal plane in addition to the coronal plane and define the acromial incidence angle (AIA).
This study aimed to evaluate the relationship between AIA and RCT and investigate whether the predictive value of the CSA for RCT can be increased when evaluated together with the AIA.
Methods
After obtaining institutional ethical approval, the data of 688 patients with RCTs who underwent arthroscopy by a single senior surgeon (M.Ö.) at a tertiary academic medical center between January 2018 and January 2023 were retrospectively reviewed, and 117 patients were included in the study. The exclusion criteria were shoulder arthrosis, acromial osteophyte, os acromiale, patients aged <40 and >65 years (excluded to minimize the effect of increasing age on the RCT), subscapularis rupture, traumatic cuff rupture, congenital deformities, history of instability, irreparable tears, patients with inappropriate imaging, patients with neurological diseases, a history of previous upper extremity surgery, and a history of previous upper extremity fracture. A total of 117 patients were selected as the control group to match the age and sex of the patients. The patients in the control group did not suggest any specific shoulder pathology on the physical examination and did not have any rotator cuff pathology, other soft tissues or bony pathologies on MRI. The exclusion criteria for the control group were shoulder arthrosis, acromial spur, os acromiale, patients aged <40 and >65 years, a history of instability, patients with inappropriate imaging, patients with neurological diseases, a history of previous upper extremity surgery, and a history of previous upper extremity fracture.
The CSA and glenoid inclination (GI) in the coronal plane, the glenoid version (GV) in the axial plane, and the AIA in the sagittal plane were measured on MRI. For CSA measurement, the most lateral point of the acromion was identified and marked on the coronal MRI images, and this mark was fixed on the screen. The coronal section was then advanced to the section passing through the center of the glenoid. The CSA was measured as the angle between the line extending from the marked point to the inferior border of the glenoid and the line extending from the superior border of the glenoid to the inferior border of the glenoid.9,23 (Figure 1).

Demonstration of the CSA measurement. (A) Detection of the most lateral point of the acromion on the T1 sequence coronal MRI and fixation on the screen (red asterisk). (B) Advancement of the coronal slice to a slice showing the superior and inferior bony margins of the glenoid, followed by measurement of the angle between the line joining the superior and inferior margins of the glenoid and the line between the projection of the lateral acromion (red asterisk) and the inferior glenoid. (C) T2 coronal MRI image of a 56-year-old female patient with CSA measurement and full-thickness RCT. CSA, critical shoulder angle; MRI, magnetic resonance imaging.
The GV was obtained by drawing a line from the most medial border of the scapula to the midpoint of the glenoid articular surface, and a line through the glenoid articular surface on axial MRI and subtracting 90° from the posterior angle14,19 (Figure 2)The GI measurement was obtained by subtracting 90° from the superior angle after drawing the lines between the line passing medial to lateral through the base of the supraspinatus fossa, and the superior border and inferior border of the glenoid on coronal MRI 19 (Figure 2).
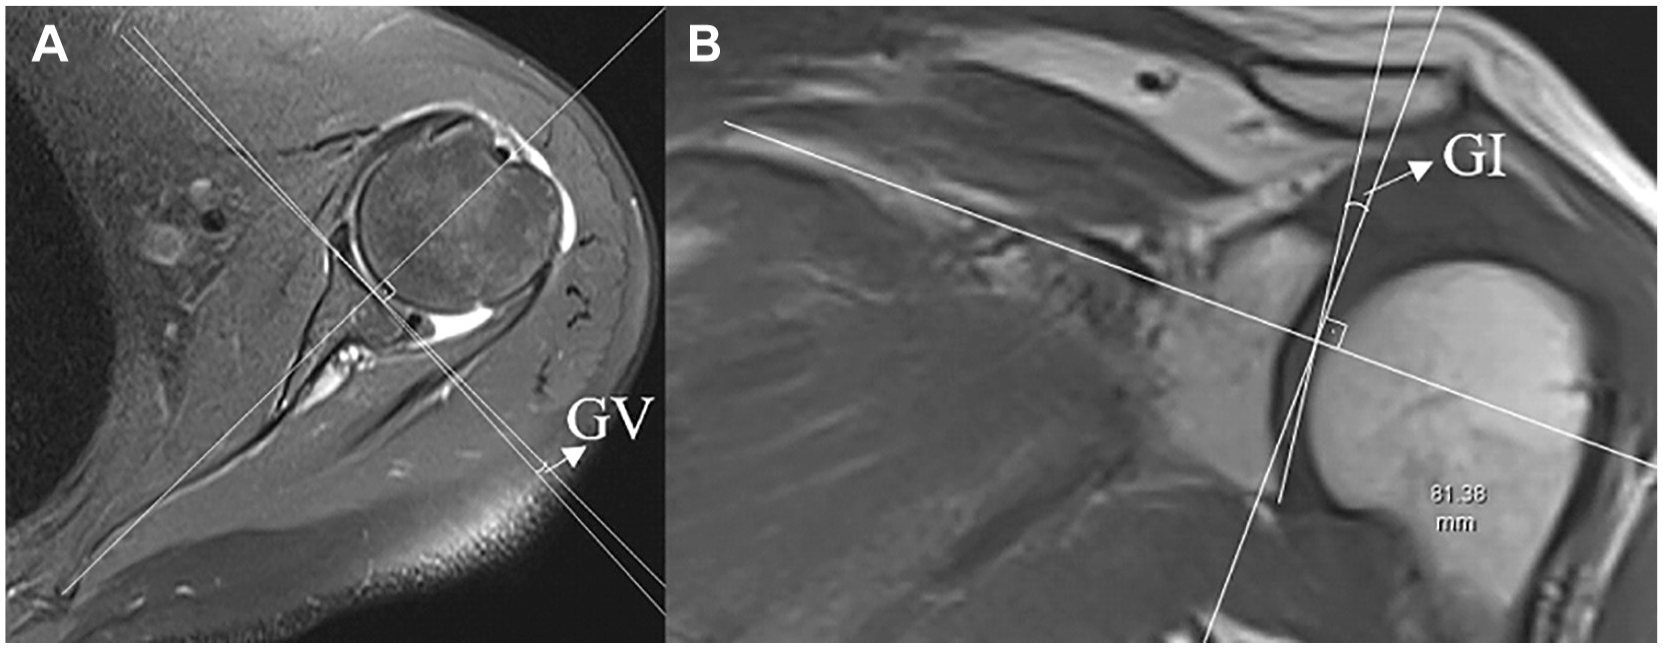
Demonstration of GV and GI measurements. (A) On the axial section, after determining the cross section through the most medial point of the scapula and the center of the glenoid, the GV is obtained by measuring the angle between the line through the glenoid articular face and the tangent of the line from the most medial point of the scapula to the midpoint of the glenoid articular face. (B) The GI is obtained by measuring the angle between the tangent of the line between the superior and inferior glenoid and the tangent of the line along the base of the supraspinatus fossa on the coronal MRI section. GI, glenoid inclination; GV, glenoid version.
Because the rotator cuff muscles try to centralize the humeral head in the glenoid, the center of the glenoid has been taken as a reference in the studies on the relationship between the acromion and the glenoid, and in our study for the AIA measurement, the glenoid center was first determined as described by Arner et al, 1 and a reference line extending from the glenoid center to the inferior corner of the scapula was drawn to determine the scapula axis (Figure 3). After fixing the glenoid center and the reference line on the screen, the sagittal section showing the acromion was advanced. The angle between the line connecting the anterosuperior and posteroinferior points of the acromion and the line connecting the glenoid center and the anterosuperior point of the acromion was measured as the AIA (Figure 3). The angle between the line extending from the glenoid center to the anterosuperior point of the acromion and the reference line was measured as the anterior acromion coverage (AAC) (Figure 3). 1 AAC values were positive when measured anterior to the reference line and were negative when measured posterior to the reference line.2,25
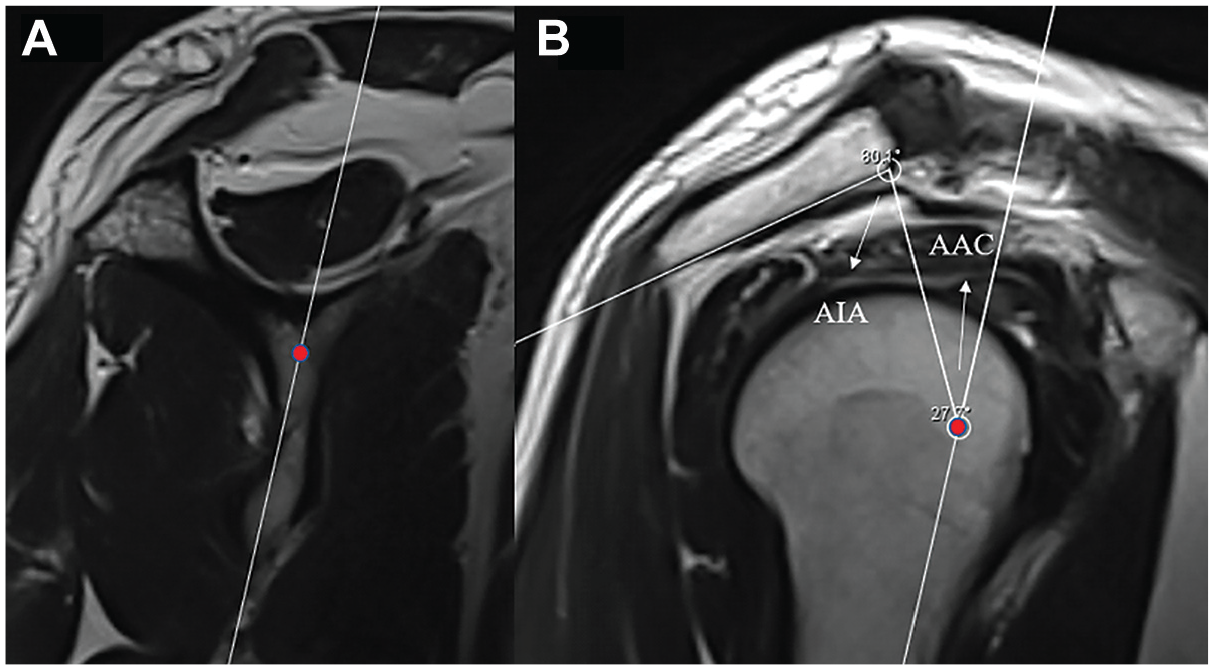
Demonstration of AIA measurement. (A) The glenoid center and the reference line between the glenoid center and the inferior corner of the scapula are identified in the sagittal section and fixed on the screen. (B) The sagittal section is advanced to the section where the acromion is seen widest. The AAC is obtained by measuring the angle between the line drawn from the glenoid center to the anterior aspect of the acromion and the reference line. The AIA is obtained by measuring the angle between the line drawn from the glenoid center to the anterior of the acromion and the line extending from the anterior to the posterior of the acromion. AAC, anterior acromion coverage; AIA, acromial incidence angle.
All measurements were performed by 2 senior surgeons (M.Ö. and H.Y.), blinded to each other, and each surgeon measured all MRIs twice, with a time interval of 4 weeks between readings. Intrarater and interrater reliability analyses were checked by the intraclass correlation coefficient (ICC), which was categorized as slight (0-0.2), fair (0.21-0.4), moderate (0.41-0.6), good (0.61-0.8), and excellent (>0.8). 11 Data analysis was performed using SPSS software Version 22.0 (IBM). After ICC analysis, mean values, standard deviations, and confidence intervals were calculated by averaging the 4 measurements. Post-hoc power calculations were performed using the G*Power software Version 3.1.9.4 (Heinrich Heine University), with an alpha error of .05 and a 2-tailed significance level. Skewness of the data was checked using the Shapiro-Wilk test. The t test was used to compare parametric independent variables, and the Mann-Whitney U test was used to compare nonparametric independent variables. Pearson and Spearman-Rho tests were used for correlation analyses. Receiver operating characteristic (ROC) analysis was done to calculate the best diagnostic cutoff thresholds of the parameters. Calculations with P < .05 were considered significant. Logistic regression analysis was used to investigate whether the parameters affect RCT independently of other parameters.
Results
The results of interrater and intrarater reliability analyses were between 0.78 and 0.93, indicating good and excellent reliability (Observer 1, M.Ö. Observer 2, H.Y.) (Table 1).
ICC Results for Both Groups a
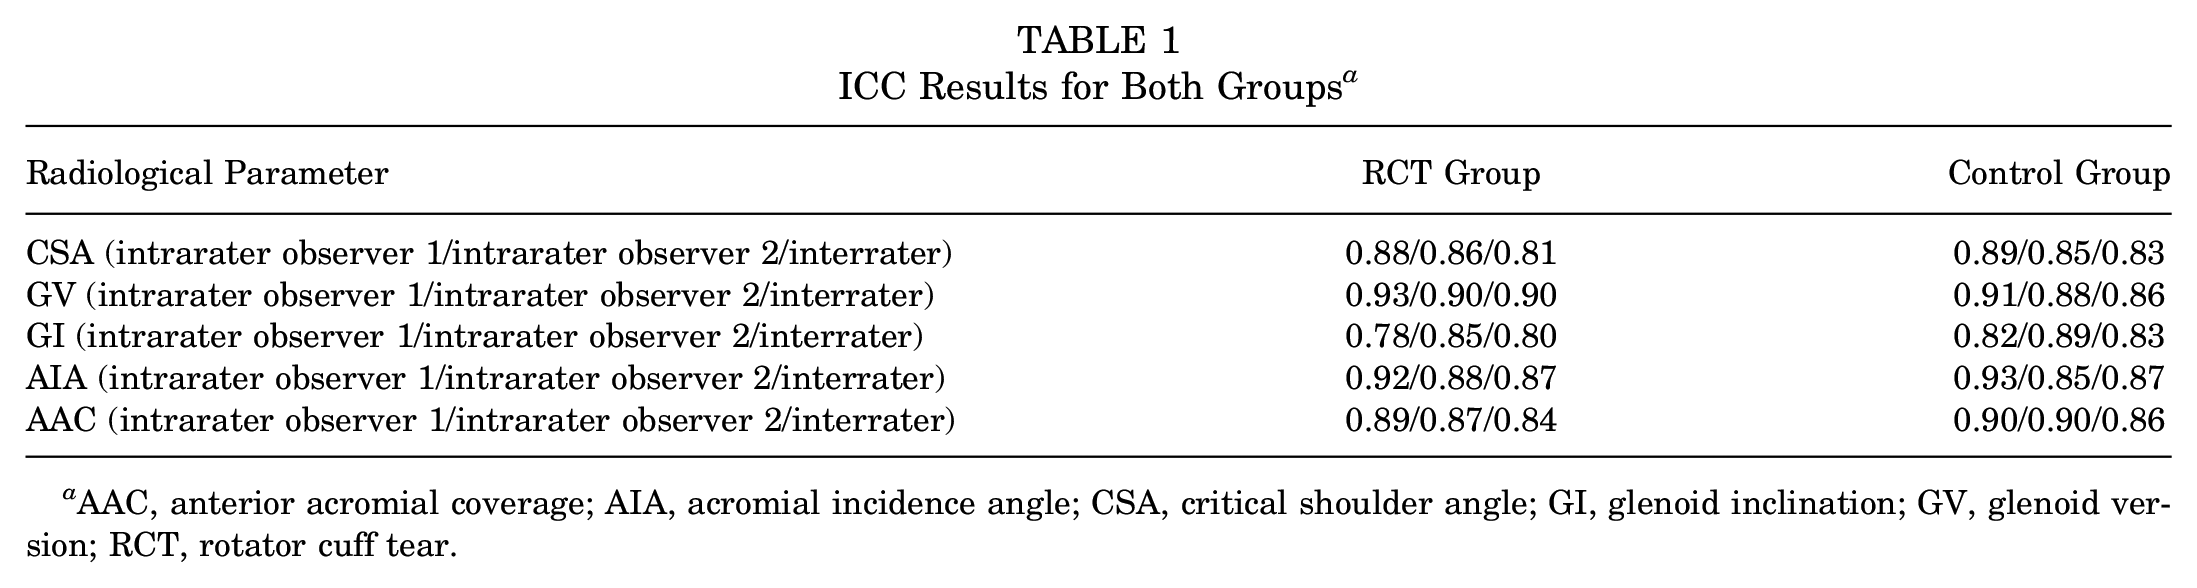
AAC, anterior acromial coverage; AIA, acromial incidence angle; CSA, critical shoulder angle; GI, glenoid inclination; GV, glenoid version; RCT, rotator cuff tear.
The mean age of the RCT group was 54.8 ± 5.8 years (range, 40-65 years), while the mean age of the control group was 54.4 ± 6 years (range, 40-65 years), and there was no significant difference between the 2 groups in terms of age (P = .595). There were 71 male and 46 female patients in the 2 groups. In the RCT group, 78 were right-sided and 39 were left-sided; in the control group, 73 were right-sided and 44 were left-sided, and there was no significant difference in terms of side (P = .691). Patient characteristics are presented in Table 2.
Patient Characteristics a

Data are presented as mean ± SD (range) or n (%). RCT, rotator cuff tear.
The mean CSA values were 35.7°± 5.3° (range, 25°-50.4°) in the RCT group and 33.9°± 4.5° (range, 22°± 44.10°) in the control group, and when the groups were compared in terms of CSA, the CSA was significantly higher in the RCT group (P = .009). In ROC analysis, the CSA showed 57.1% sensitivity and 61.3% specificity at a cutoff value of 34.7° (area under the curve [AUC], 0.589 [95% CI, 0.449-0.730]; likelihood ratio [LR], 1.47) (Figure 4). The mean AIA values were 77.4°± 12.9° (range, 42.2°-104.4°) in the RCT group and 63.7°± 9.4° (range, 53.4°± 91.9°) in the control group, and when the groups were compared in terms of AIA, the AIA was significantly higher in the RCT group (P < .001). In ROC analysis, the AIA showed 80.2% sensitivity and 83.9% specificity at the cutoff value of 70° (AUC, 0.885 [95% CI, 0.799-0.971]; LR, 4.98) (Figure 4).

ROC curves of the CSA and the AIA for RCT. AIA, acromial incidence angle; CSA, critical shoulder angle; ROC, receiver operating characteristic.
The mean AAC values were −16.5°± 14° (range, −50.7° to 11.6°) in the RCT group and −9.7°± 10.5° (range, −25.6° to 14.6°) in the control group, and when the groups were compared in terms of AAC, the AAC was significantly higher in the RCT group (P = .033). The mean GV values were 4.6°± 5.2° (range, −6° to 14.9°) in the RCT group and 3°± 4.5° (range, −9.1° to 12.9°) in the control group. There was no significant difference in terms of GV in the RCT group (4°± 7.1° [range, −11.9° to 24.9°]; P = .317) and the control group (9°± 6.1° [range, −5.7° to 23.4°]). There was no significant difference between the groups in terms of GI (P = .691). Logistic regression analysis showed that only the CSA (odds ratio [OR], 1.32 [95% CI, 1.06 to 1.65]; P < .001) and the AIA (OR, 1.34 [95% CI, 1.14 to 1.57]; P < .001) were effective in the occurrence of RCT independent of other parameters. There was a significant negative correlation between the AIA and the AAC (P < .001; R = −0.572) (Table 3).
Mean Values and Comparisons of CSA, AIA, AAC, GV, and GI a

Bold P values indicate significance. AAC, anterior acromial coverage; AIA, acromial incidence angle; CSA, critical shoulder angle; GI, glenoid inclination; GV, glenoid version; RCT, rotator cuff tear.
After this stage, the patient groups were divided into 2 groups: (1) patients with a CSA of <35° and (2) patients with a CSA of ≥35°. In the patient group with a CSA of <35°, AIA values >72° predicted RCTs with 85.6% sensitivity and 84.8% specificity (LR, 5.63; AUC, 0.904 [95% CI, 0.847-0.961]). In the group of patients with a CSA of ≥35°, values >65° predicted RCTs with 70.2% sensitivity and 76.7% specificity (LR, 3.01; AUC, 0.760 [95% CI, 0.653-0.867]) (Figure 5).

(A) ROC curve for RCT in patients with a CSA of <35°. (B) ROC curve for RCT in patients with a CSA of ≥35°. CSA, critical shoulder angle; RCT, rotator cuff tear; ROC, receiver operating characteristic.
Discussion
The most important finding of this study is that AIA values of >70° predicted RCTs with 80.2% sensitivity and 83.9% specificity, and AIA values of >72° predicted RCTs with 85.6% sensitivity and 84.8% specificity in patients with a CSA of <35° who were considered to be at low risk for RCT.
Factors affecting higher values of CSA are the lateral extension of the acromion in the coronal plane and the inclination of the glenoid articular surface; as the lateral extension of the acromion increases, the superior component of the force vector applied by the deltoid increases.16,17,20 As the superior vector of deltoid strength increases, the workload of the rotator cuff muscles to centralize the humeral head at the glenoid increases. A balanced rotator cuff muscle strength tries to centralize the humeral head in the glenoid by neutralizing the upward force exerted by the deltoid.16,20 It has been shown that the rotator cuff muscles, which degenerate and weaken with increasing age, cannot overcome the superior pulling force of the deltoid muscle, and the centralization of the humeral head in the glenoid is disrupted and the humeral head migrates superiorly, causing a secondary subacromial impingement and further tendon tear. 17 In our study, the CSA distribution ranged between 22° and 50.4°, and we noticed that the number of patients with a CSA value of <35° among patients who underwent surgical treatment for RCTs was too high to be ignored. The cause of RCT cannot be completely explained by bone morphology. Nonetheless, assuming that the sensitivity of the CSA, which is known to have a strong relationship with RCTs, can be increased by evaluating it with additional parameters, we aimed to examine the relationship between the acromion and the glenoid in the sagittal plane and define the AIA. The AIA evaluates the relationship between the acromion and the largest circle in the sagittal plane whose center is the same as the center of the glenoid and touches the inferior aspect of the acromion (Figure 6). When shoulder biomechanics are normal, the humeral head can be centralized at the glenoid. We hypothesized that this circle would be the maximum circular range of motion of the rotator cuff tendons in the sagittal plane without being affected by the anatomic barrier property of the acromion, and that the differences in the extension of the acromion in the sagittal plane could be associated with RCT by causing an imbalance of load and pressure distribution in the subacromial space.

Demonstration of the relationship between the acromion and the circle whose center is the same as the center of the glenoid in the sagittal plane.
The AIA was at least as sensitive and specific as the CSA when evaluated in all patients. When a CSA of <35° was assessed separately in patients, it predicted RCTs with 85.6% sensitivity and 84.8% sensitivity. The significant relationship between increased AIA and RCT can be explained in 2 ways. First, the rotator cuff muscles are unable to resist the pulling force of the deltoid superiorly over time, and the rotator cuff muscles, which are compressed in a smaller area between the humeral head and the acromion after the humeral head migrates superiorly, degenerate earlier with higher pressure, and undergo more microtrauma. This idea could partially explain Bigliani’s finding of more cuff ruptures in patients with type 3 acromion because the anterior acromion sloping anteroinferiorly and the increase in AIA may support each other. 3 On the other hand, acromioplasty may be performed after rotator cuff rupture repair, and the anteroinferior point of the acromion may be moved superiorly, and the AIA may be slightly reduced. Despite these ideas that may support the logic of the AIA, the high sensitivity and specificity of our data suggest that the compliance of the acromion to the glenoid-centered circle in the sagittal plane is the determinant of RCT. To further clarify this issue, it may be necessary to measure the amount of pressure in the cuff tissue between the acromion and the humeral head on cadaveric specimens with different AIA values. Second, the deltoid posterior fibers adhering to the posterior aspect of the acromion create a greater superior pulling force on the humeral head than the deltoid fibers adhering to the anterior aspect of the acromion because of their incompatibility with the sagittal circle in patients with high AIA.
The CSA, which reflects the biomechanical relationship between the deltoid muscle and rotator cuff muscles in the coronal plane, has been well discussed in the literature and its clinical importance has been understood. Patients with a CSA of >35° are classified as risky in terms of RCT, while patients with CSA values between 30° and 35° are classified as normal patients in terms of CSA. Because the mean difference of CSA between the RCT and control groups varies between approximately 1° and 3.5° in the literature and the AIA mean difference was found to be 13.7°, with high sensitivity and specificity, in our study, we think that the combination of the CSA evaluated in the coronal plane with the AIA measured in the sagittal plane may be useful in risk assessment.
In their study on anteroposterior massive RCTs, Ye et al 25 showed that greater AAC reduced the risk of retear independently of other parameters. In their study, they mentioned a possible reason for this by mentioning the study of Wu et al. 24 In their study, Wu et al stated that increased AAC created an effective fulcrum point for the humeral head migrating proximally and prevented the humeral head from migrating further superiorly, and they showed that it created a stable fulcrum point for the remaining intact rotator cuff muscles to work. RCTs were present in all patients with low and high AAC who were included in the Wu et al study. However, Kim et al 10 and Sakoma et al 22 showed that increased AAC was associated with RCT. To the best of our knowledge, the relationship between AAC and RCT is still controversial, with increased AAC being associated with both an increased likelihood of impingement and a stable fulcrum preventing migration of the humeral head superiorly . In our study, a significant association was found between low AAC and RCT; nonetheless, AAC was not found to be an independent risk factor in logistic regression analysis. One of the parameters found to be an independent risk factor was the CSA, and the other was the AIA. The data we obtained on the AIA and its relationship with AAC were as follows: the AIA showed a strong correlation with the RCT of the acromion to the glenoid-centered circle in the sagittal plane, and the relationship between AAC and RCT was not strong enough to be an independent factor; however, there was a moderate negative correlation between AAC and AIA.
The AIA does not appear to be diagnostically useful for RCT. However, further research may be needed to examine the relationship between the AIA and the rotator cuff retear rate, changes in the AIA after acromioplasty, the relationship between the AIA and clinical outcomes after acromioplasty, and the relationship between the AIA and instabilities and osteoarthritis.
Limitations
There were limitations in this study. One limitation was the small number of patients because patients >65 years were not included in the study to minimize the effect of age-related degeneration on the patients included in the study. Also, the measurements were performed on MRI, which is not the most suitable method for bone morphology, and the AIA is technically more difficult to measure than the CSA on a radiograph. In addition, the body mass index and occupation of the patients were not known.
Conclusion
The AIA predicted RCT with 80.2% sensitivity and 83.9% specificity for values of >70°. In patients with a CSA of <35°, it predicted RCT with 85.6% sensitivity and 84.8% sensitivity at values >72°. By evaluating the relationship between the acromion and the glenoid in the sagittal plane, the AIA is a new parameter that allows reevaluation of the risk in the patient group with a CSA of <35°, which is considered to be in the low-risk category in terms of RCT.
Footnotes
Final revision submitted November 14, 2024; accepted December 6, 2024.
The authors have declared that there are no conflicts of interest in the authorship and publication of this contribution. AOSSM checks author disclosures against the Open Payments Database (OPD). AOSSM has not conducted an independent investigation on the OPD and disclaims any liability or responsibility relating thereto.
Ethical approval for this study was obtained from Necmettin Erbakan University Ethical Committee (Reference No. 2024-5056).